Unit – 4
Object Oriented Design with UML
In the object-oriented design method, the system is viewed as a collection of objects (i.e., entities). The state is distributed among the objects, and each object handles its state data. For example, in a Library Automation Software, each library representative may be a separate object with its data and functions to operate on these data. The tasks defined for one purpose cannot refer or change data of other objects. Objects have their internal data which represent their state. Similar objects create a class. In other words, each object is a member of some class. Classes may inherit features from the superclass.
Unified process (UP) is an architecture-centric, use-case driven, iterative and incremental development process that leverages unified modelling language and is compliant with the system process engineering metamodel. It can be applied to different software systems with different levels of technical and managerial complexity across various domains and organizational cultures.
Unified process is a refinement of rational unified process. It is an extensible framework that can be customized for specific projects.
This process divides the development process into four phases:
Unified process has the following major characteristics:
Unified Modelling Language (UML) is a general purpose modelling language. The main aim of UML is to define a standard way to visualize the way a system has been designed. It is quite similar to blueprints used in other fields of engineering.
UML is not a programming language, it is rather a visual language. We use UML diagrams to portray the behaviour and structure of a system. UML helps software engineers, businessmen and system architects with modelling, design and analysis.
Need of UML
UML is linked with object oriented design and analysis. UML makes the use of elements and forms associations between them to form diagrams.
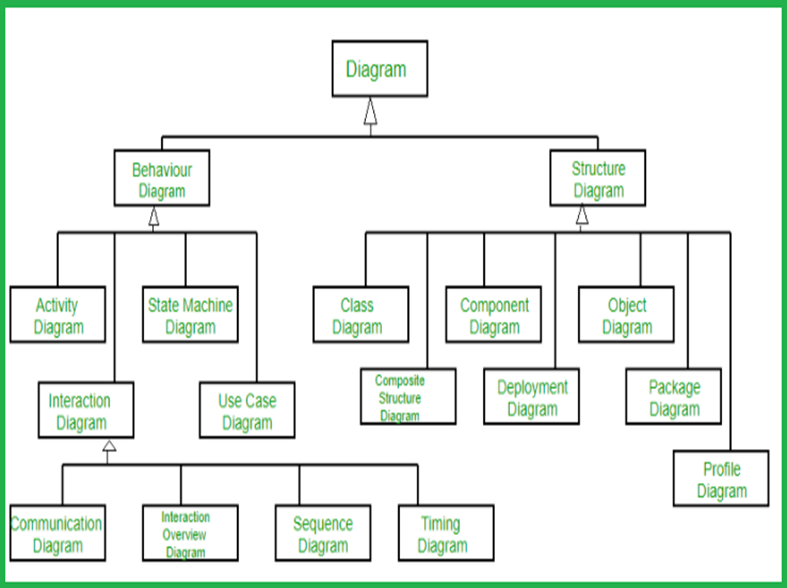
Diagrams in UML can be broadly classified as:
Structural Diagrams – Capture static aspects or structure of a system. Structural Diagrams include: Component Diagrams, Object Diagrams, Class Diagrams and Deployment Diagrams.
Behavior Diagrams – Capture dynamic aspects or behavior of the system. Behavior diagrams include: Use Case Diagrams, State Diagrams, Activity Diagrams and Interaction Diagrams.
The image below shows the hierarchy of diagrams according to UML
Object oriented concepts Used in UML
Class – A class defines the blue print i.e. structure and functions of an object.
Objects – Objects help us to decompose large systems and help us to modularize our system. Modularity helps to divide our system into understandable components so that we can build our system piece by piece. An object is the fundamental unit (building block) of a system which is used to depict an entity.
Inheritance – Inheritance is a mechanism by which child classes inherit the properties of their parent classes.
Abstraction – Mechanism by which implementation details are hidden from user.
Encapsulation – Binding data together and protecting it from the outer world is referred to as encapsulation.
Polymorphism – Mechanism by which functions or entities are able to exist in different forms. IEEE defines test case as “a set of input values, execution preconditions, expected results and execution post conditions, developed for a particular objective or test condition, such as to exercise a particular program path or to verify compliance with a specific requirement”.
Generally, a test case contains particulars, such as test case identifier, testcase name, its objective, test conditions/setup, input data requirements, steps, and expected results.
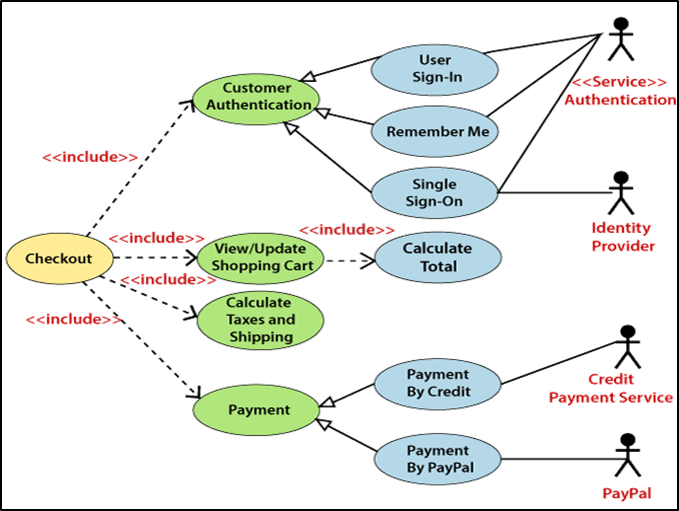
A use case diagram is used to represent the dynamic behavior of a system. It encapsulates the system's functionality by incorporating use cases, actors, and their relationships. It models the tasks, services, and functions required by a system/subsystem of an application. It depicts the high-level functionality of a system and also tells how the user handles a system.
Purpose of Use Case Diagrams
The main purpose of a use case diagram are:
Rules that must be followed while drawing a use case diagram:
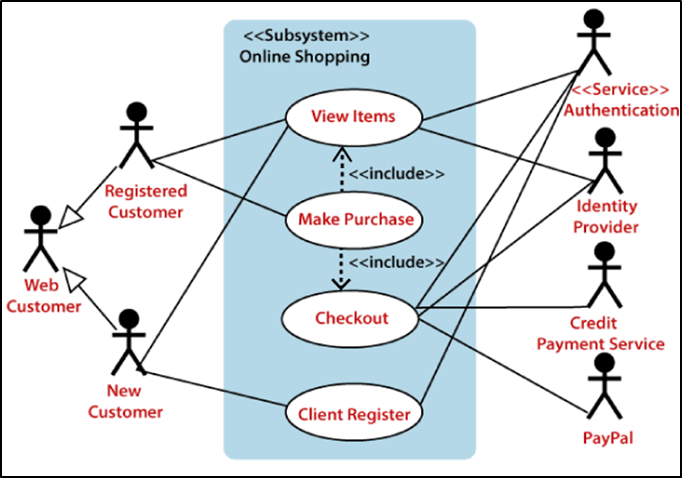
Case study example of Online Shopping website is given to draw a USE case diagram.
Actors and uses are: Web Customer actor uses online shopping website to purchase online. The top-level uses are as follows; View Items, Make Purchase, Checkout, Client Register.
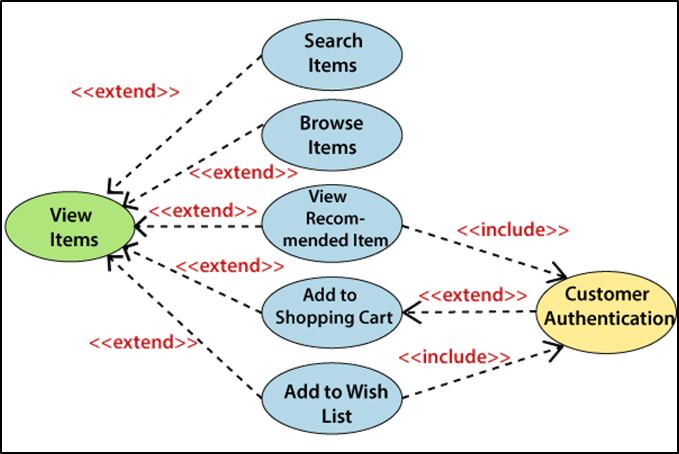
The View Items use case is utilized by the customer who searches and view products.
The Client Register use case allows the customer to register itself with the website for availing gift vouchers, coupons, or getting a private sale invitation. It is to be noted that the Checkout is an included use case, which is part of Making Purchase, and it is not available by itself.
Activity diagram is basically usedin UML to describe the dynamic aspects of the system.It is a flowchart to represent the flow from one activity to another activity. The activity can be described as an operation of the system.The control flow is drawn from one operation to another. This flow can be sequential, branched, or concurrent.
Activity diagrams deal with all type of flow control by using different elements such as fork, join, etc. shows different flows such as parallel, branched, concurrent, and single.
Use of Activity Diagrams
The basic purposes of activity diagrams is to captures the dynamic behaviour of the system. It is used to show message flow from one activity to another.
Before drawing an activity diagram we need to understand how activities are associated with constraints and conditions. The main element of an activity diagram is the activity itself. An activity is a function performed by the system. After identifying the activities, one should identify the following elements −
An example of order management systemas an activity diagram is shown. In the diagram, four activities are identified which are associated with conditions.
Following diagram is drawn with the four main activities −
After receiving the order request, condition checks are performed to check if it is normal or special order. After the type of order is identified, dispatch activity is performed and that is marked as the termination of the process.
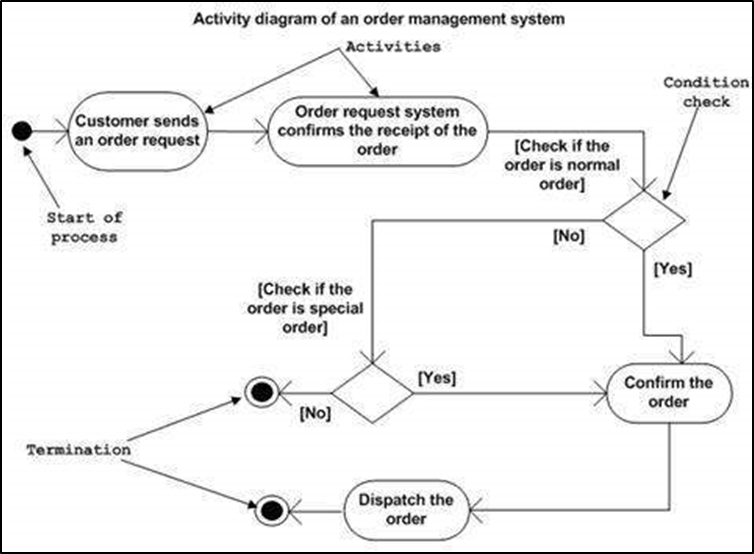
This diagram used for –
To have different views we use design views.
4.6.1 Class Diagrams
Class diagram is a static diagram. It represents the static view of an application. Class diagram is not only used for visualizing, describing, and documenting different aspects of a system but also for constructing executable code of the software application. It is widely used in the modeling of objectoriented systems because they are the only UML diagrams, which can be mapped directly with object-oriented languages.
Class diagram shows a collection of classes, interfaces, associations, collaborations, and constraints. It is also known as a structural diagram.
purpose of the class diagram can be summarized as −
Class diagram is basically a graphical representation of the static view of the system and represents different aspects of the application. A collection of class diagrams represent the whole system.
Points to consider while drawing a class diagram −
The following classdiagram is an example of an Order System of an application. It describes a particular aspect of the entire application.
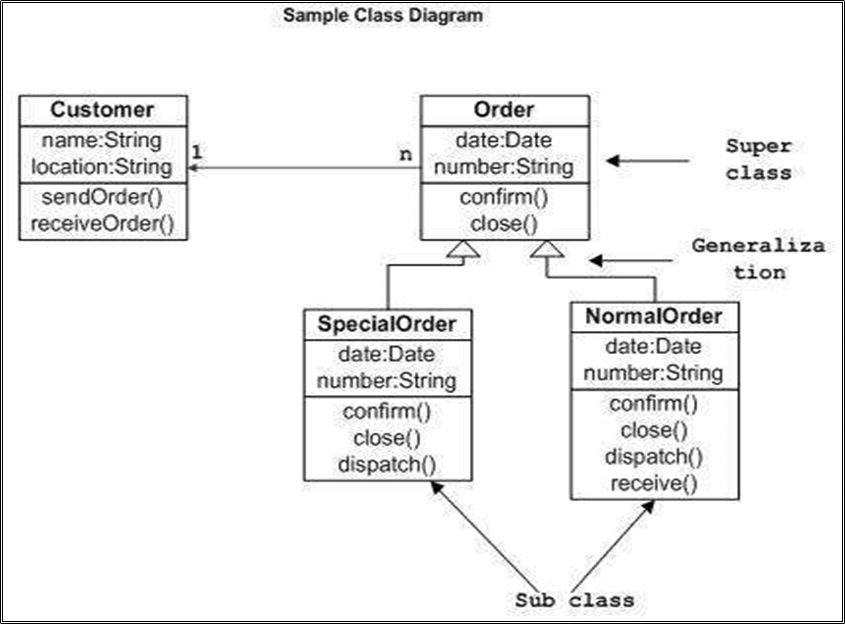
Class diagrams are used for −
4.6.2 Interaction Diagrams
This interactive behavior is represented in UML by two diagrams known as Sequence diagram and Collaboration diagram. The basic purpose of both the diagrams are similar.
Sequence diagram emphasizes on time sequence of messages and collaboration diagram emphasizes on the structural organization of the objects that send and receive messages.
The purpose of interaction diagram is −
We have two types of interaction diagrams in UML. One is the sequence diagram and the other is the collaboration diagram.
The sequence diagram captures the time sequence of the message flow from one object to another and the collaboration diagram describes the organization of objects in a system taking part in the message flow.
Following things are to be identified clearly before drawing the interaction diagram
Following are two interaction diagrams modeling the order management system. The first diagram is a sequence diagram and the second is a collaboration diagram
The Sequence Diagram
The sequence diagram has four objects (Customer, Order, SpecialOrder and NormalOrder).
The following diagram shows the message sequence for SpecialOrder object and the same can be used in case of NormalOrder object. It is important to understand the time sequence of message flows. The message flow is nothing but a method call of an object.
The first call is sendOrder () which is a method of Order object. The next call is confirm () which is a method of SpecialOrder object and the last call is Dispatch () which is a method of SpecialOrder object. The following diagram mainly describes the method calls from one object to another, and this is also the actual scenario when the system is running.
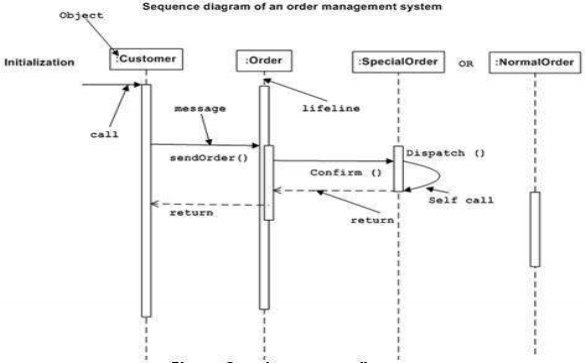
The Collaboration Diagram
The second interaction diagram is the collaboration diagram. It shows the object organization as seen in the following diagram. In the collaboration diagram, the method call sequence is indicated by some numbering technique. The number indicates how the methods are called one after another.
Method calls are similar to that of a sequence diagram. However, difference being the sequence diagram does not describe the object organization, whereas the collaboration diagram shows the object organization.
To choose between these two diagrams, emphasis is placed on the type of requirement. If the time sequence is important, then the sequence diagram is used. If organization is required, then collaboration diagram is used.
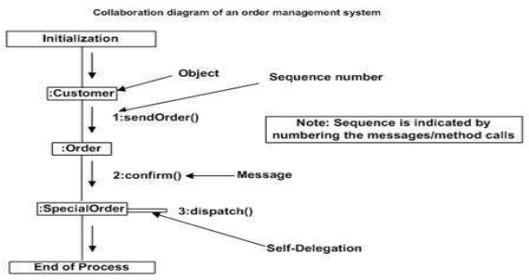
The main purpose of both the diagrams are similar as they are used to capture the dynamic behavior of a system. However, the specific purpose is more important to clarify and understand.
Sequence diagrams are used to capture the order of messages flowing from one object to another. Collaboration diagrams are used to describe the structural organization of the objects taking part in the interaction. A single diagram is not sufficient to describe the dynamic aspect of an entire system, so a set of diagrams are used to capture it as a whole.
Interaction diagrams are used when we want to understand the message flow and the structural organization. Message flow means the sequence of control flow from one object to another. Structural organization means the visual organization of the elements in a system.
Interaction diagrams can be used −
4.6.3 State Chart Diagrams
These diagrams clarifies and describes different states of a component in a system. The states are specific to a component/object of a system.
A Statechart diagram describes a state machine. State machine can be defined as a machine which defines different states of an object and these states are controlled by external or internal events.
Purpose of Statechart Diagrams
Statechart diagram is one of the five UML diagrams used to model the dynamic nature of a system. They define different states of an object during its lifetime and these states are changed by events. Statechart diagrams are useful to model the reactive systems. Reactive systems can be defined as a system that responds to external or internal events.
These diagram describes the flow of control from one state to another state. Statechart diagrams are also used for forward and reverse engineering of a system. However, the main purpose is to model the reactive system.
Objectives of Statechartdiagrams −
To Draw a State chart Diagram one should clarify the following points −
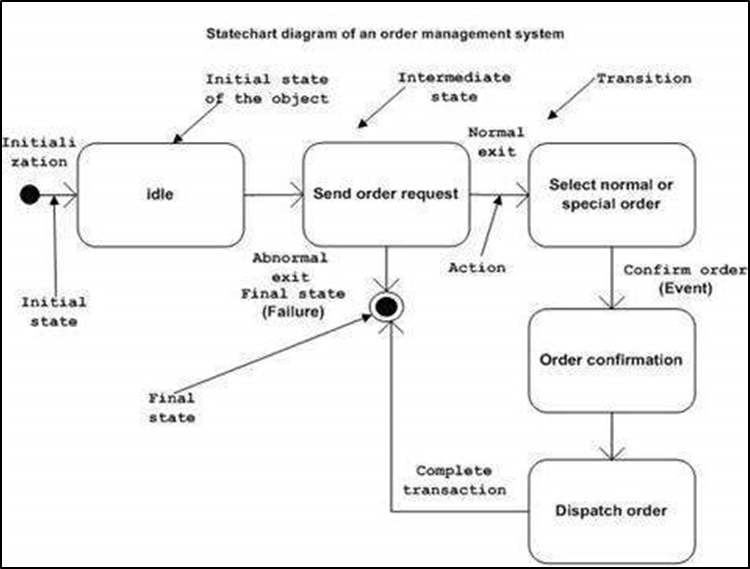
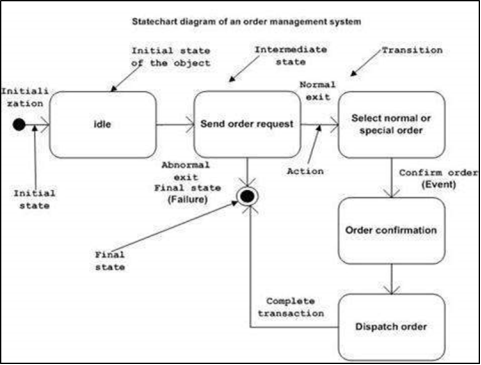
An example of a Statechart diagram where the state of Order object is analysed below.
The first state is an idle state from where the process starts. The next states are arrived for events like send request, confirm request, and dispatch order. These events are responsible for the state changes of order object.
During the life cycle of an object (here order object) it goes through the following states and there may be some abnormal exits. This abnormal exit may occur due to some problem in the system. When the entire life cycle is complete, it is considered as a complete transaction as shown in the following figure. The initial and final state of an object is also shown in the following figure.
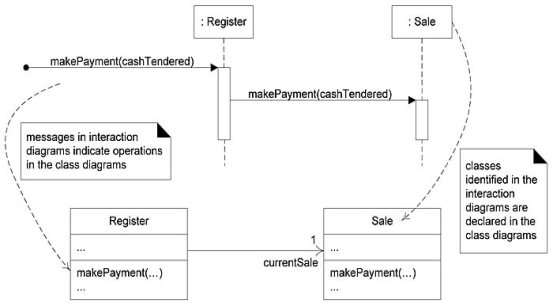
When we draw interaction diagrams, a set of classes and their methods emerge from the creative design process of dynamic object modeling. For example, if we started with the (trivial for explanation) makePayment sequence diagram in figure below, we see that a Register and Sale class definition in a class diagram can be obviously derived.
Thus, from interaction diagrams the definitions of class diagrams can be generated. This suggests a linear ordering of drawing interaction diagrams before class diagrams.
Note: A good UML tool should automatically support changes in one diagram being reflected in the other. If wall sketching, use one wall for interaction diagrams, and an adjacent wall for class diagrams.
Component diagrams are used to visualize the organization and relationships among components in a system. These diagrams are also used to make executable systems.
Purpose of Component Diagrams
Component diagram is a special kind of diagram in UML. It does not describe the functionality of the system but it describes the components used to make those functionalities.These components are libraries, packages, files, etc.
The purpose of the component diagram can be summarized as −
To Draw a Component Diagramfollowing artifacts are to be identified:
Component diagrams are used during the implementation phase of an application. Initially, the system is designed using different UML diagrams and then when the artifacts are ready, component diagrams are used to get an idea of the implementation
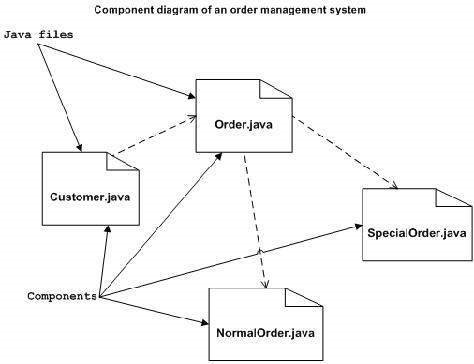
Following is a component diagram for order management system with four files identified and their relationships are produced.
Component diagrams can be used to −
• Model the components of a system.
• Model the database schema.
• Model the executable of an application.
• Model the system's source code.
Deployment diagrams are used to visualize the topology of the physical components of a system, where the software components are deployed.it consist of nodes and their relationships.
Purpose of Deployment Diagrams
Deployment diagrams are used for describing the hardware components, where software components are deployed. Component diagrams and deployment diagrams are closely related.
UML is mainly designed to focus on the software artifacts of a system. However, these two diagrams are special diagrams used to focus onsoftware and hardware components.
Use of deployment diagrams:
To Draw a Deployment Diagramfollowing artifacts should be identified −
An efficient deployment diagram is very important as it controls the following parameters −
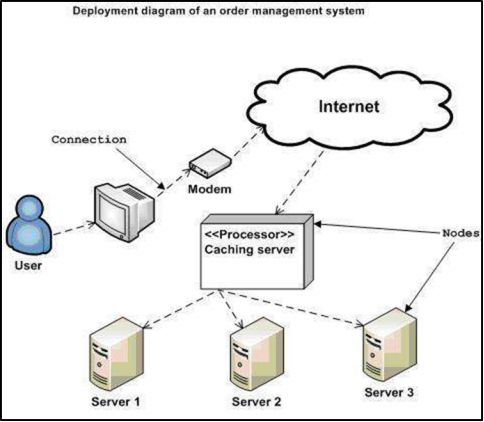
A sample deployment diagram to provide an idea of the deployment view of order management system is given below:
The application is assumed to be a web-based application, which is deployed in a clustered environment using server 1, server 2, and server 3. The user connects to the application using the Internet. The control flows from the caching server to the clustered environment.
Deployment diagrams can be used −
Bank ATM UML use case diagrams examples
Purpose: Describe use cases that an automated teller machine (ATM) or the automatic banking machine (ABM) provides to the bank customers.
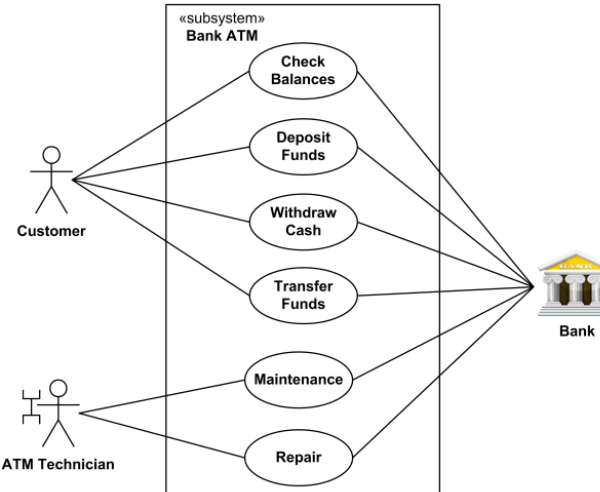
Solution:Customer uses a bank ATM to check balances of his/her bank accounts, deposit funds, withdraw cash and/or transfer funds (use cases). ATM Technician provides maintenance and repairs to the ATM.
An automated teller machine (ATM) or the automatic banking machine (ABM) is a banking subsystem (subject) that provides bank customers with access to financial transactions in a public space without the need for a cashier, clerk, or bank teller.
Customer (actor) uses bank ATM to Check Balances of his/her bank accounts, Deposit Funds, Withdraw Cash and/or Transfer Funds (use cases). ATM Technician provides Maintenance and Repairs. All these use cases also involve Bank actor whether it is related to customer transactions or to the ATM servicing.
On most bank ATMs, the customer is authenticated by inserting a plastic ATM card and entering a personal identification number (PIN). Customer Authentication use case is required for every ATM transaction so we show it as include relationship. Including this use case as well as transaction generalizations make the ATM Transaction an abstract use case.
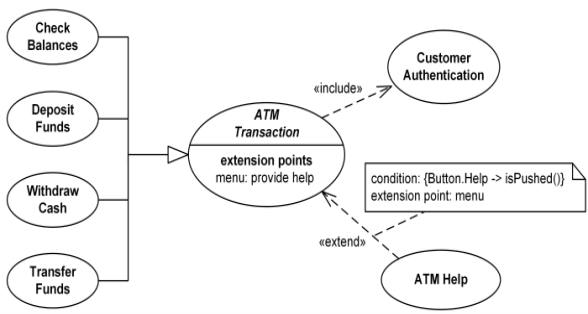
Customer may need some help from the ATM. ATM Transaction use case is extended via extension point called menu by the ATM Help use case whenever ATM Transaction is at the location specified by the menu and the bank customer requests help, e.g. by selecting Help menu item.
ATM Technician maintains or repairs Bank ATM. Maintenance use case includes Replenishing ATM with cash, ink or printer paper, Upgrades of hardware, firmware or software, and remote or on-site Diagnostics. Diagnostics is also included in (shared with) Repair use case.
