UNIT-5
Baseband Transmission & Optimum Detection
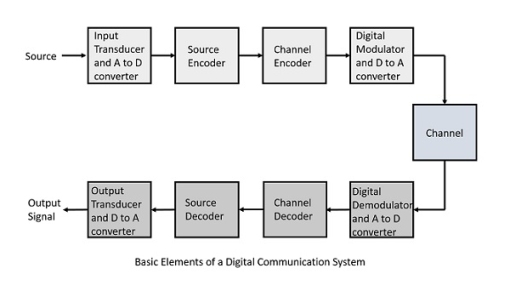
The elements which form a digital communication system is given by
|
Fig.1: Digital receivers
Following are the sections of the digital communication system.
The source can be an analog signal. Example: A Sound signal
Input Transducer
This is a transducer which takes a physical input and converts it to an electrical signal (Example: microphone). This block also consists of an analog to digital converter where a digital signal is needed for further processes.
A digital signal is generally represented by a binary sequence.
Source Encoder
The source encoder compresses the data into minimum number of bits. This process helps in effective utilization of the bandwidth. It removes the redundant bits unnecessary excess bits i.e. zeroes unnecessary excess bits, i.e. zeroes.
Channel Encoder
The channel encoder, does the coding for error correction. During the transmission of the signal, due to the noise in the channel, the signal may get altered and hence to avoid this, the channel encoder adds some redundant bits to the transmitted data. These are the error correcting bits.
Digital Modulator
The signal to be transmitted is modulated here by a carrier. The signal is also converted to analog from the digital sequence, in order to make it travel through the channel or medium.
Channel
The channel or a medium, allows the analog signal to transmit from the transmitter end to the receiver end.
Digital Demodulator
This is the first step at the receiver end. The received signal is demodulated as well as converted again from analog to digital. The signal gets reconstructed here.
Channel Decoder
The channel decoder, after detecting the sequence, does some error corrections. The distortions which might occur during the transmission, are corrected by adding some redundant bits. This addition of bits helps in the complete recovery of the original signal.
Source Decoder
The resultant signal is once again digitized by sampling and quantizing so that the pure digital output is obtained without the loss of information. The source decoder recreates the source output.
Output Transducer
This is the last block which converts the signal into the original physical form, which was at the input of the transmitter. It converts the electrical signal into physical output (Example: loud speaker).
Output Signal
This is the output which is produced after the whole process. Example − The sound signal received.
Key Takeaways:
A digital signal is generally represented by a binary sequence.
This is a form of distortion of a signal, in which one or more symbols interfere with subsequent signals, causing noise or delivering a poor output.
Causes of ISI
The main causes of ISI are −
- Multi-path Propagation
- Non-linear frequency in channels
The ISI is unwanted and should be completely eliminated to get a clean output. The causes of ISI should also be resolved in order to lessen its effect.
To view ISI in a mathematical form present in the receiver output, we can consider the receiver output.
The receiving filter output y(t)y(t) is sampled at time ti=iTb (with i taking on integer values), yielding –
y(ti)= μ∑akp(iTb−kTb)
= μai+μ∑akp(iTb−kTb)
In the above equation, the first term μai is produced by the ith transmitted bit.
The second term represents the residual effect of all other transmitted bits on the decoding of the ith bit. This residual effect is called as Inter Symbol Interference.
In the absence of ISI, the output will be −
y(ti)=μai
This equation shows that the ith bit transmitted is correctly reproduced. However, the presence of ISI introduces bit errors and distortions in the output.
While designing the transmitter or a receiver, it is important that you minimize the effects of ISI, so as to receive the output with the least possible error rate.
Nyquist proposed a condition for pulses p(t) to have zero–ISI when transmitted through a channel with sufficient bandwidth to allow the spectrum of all the transmitted signal to pass. Nyquist proposed that a zero–ISI pulse p(t) must satisfy the condition
|
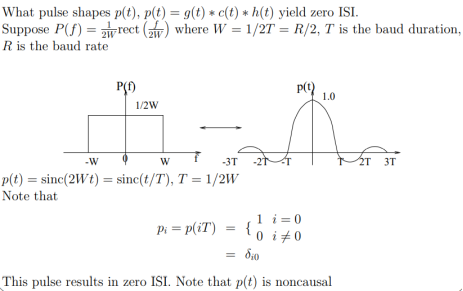
A pulse that satisfies the above condition at multiples of the bit period Tb will result in zero– ISI if the whole spectrum of that signal is received. The reason for which these zero–ISI pulses (also called Nyquist–criterion pulses) cause no ISI is that each of these pulses at the sampling periods is either equal to 1 at the center of pulse and zero the points other pulses are centered.
In fact, there are many pulses that satisfy these conditions. For example, any square pulse that occurs in the time period –Tb to Tb or any part of it (it must be zero at –Tb and Tb) will satisfy the above condition.
Also, any triangular waveform („Δ‟ function) with a width that is less than 2Tb will also satisfy the condition. A sinc function that has zeros at t = Tb, 2Tb, 3Tb, … will also satisfy this condition. The problem with the sinc function is that it extends over a very long period of time resulting in a lot of processing to generate it. The square pulse required a lot of bandwidth to be transmitted. The triangular pulse is restricted in time but has relatively large bandwidth.
There is a set of pulses known as raised–cosine pulses that satisfy the Nyquist criterion and require slightly larger bandwidth than what a sinc pulse (which requires the minimum bandwidth ever) requires.
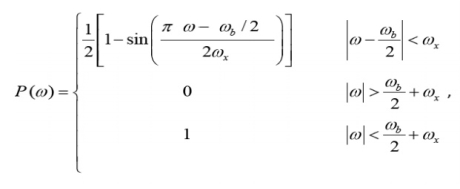
The spectrum of these pulses is given by
|
Where ω b is the frequency of bits in rad/s (ω b = 2 /Tb), and x is called the excess bandwidth and it defines how much bandwidth would be required above the minimum bandwidth that is required when using a sinc pulse. The excess bandwidth ω x for this type of pulses is restricted between
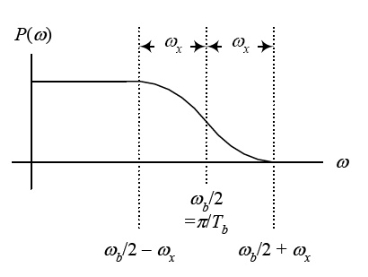
Sketching the spectrum of these pulses we get
Fig.2: Output pulses
|
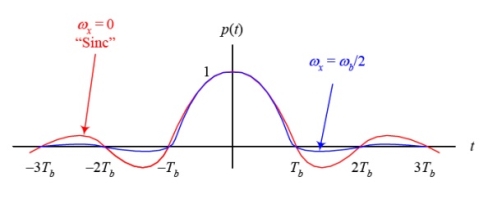
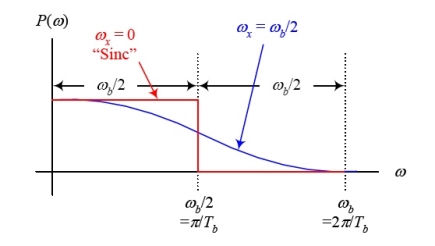
We can easily verify that when ωx = 0, the above spectrum becomes a rect function, and therefore the pulse p(t) becomes the usual sinc function. For ωx = b/2, the spectrum is similar to a sinc function but decays (drops to zero) much faster than the sinc (it extends over 2 or 3 bit periods on each side). The expense for having a pulse that is short in time is that it requires a larger bandwidth than the sinc function (twice as much for ωx =ω b/2). Sketch of the pulses and their spectrum for the two extreme cases of ω x =ωb/2 and ωx = 0 are shown below
Fig. 3: the pulses and their spectrum for the two extreme cases of ω x =ωb/2 and ωx = 0 We can define a factor r called the roll–off factor to be
The roll–off factor r specifies the ratio of extra bandwidth required for these pulses compared to the minimum bandwidth required by the sinc function.
Key Takeaways:
Roll–off factor to be
|
|
Pulse shaping is the process of changing the waveform of transmitted pulses. Its purpose is to make the transmitted signal better suited to its purpose or the communication channel, typically by limiting the effective bandwidth of the transmission.
In communications systems, two important requirements of a wireless communications channel demand the use of a pulse shaping filter. These requirements are:
1) generating bandlimited channels, and
2) reducing inter symbol interference (ISI) from multi-path signal reflections. Both requirements can be accomplished by a pulse shaping filter which is applied to each symbol.
In fact, the sinc pulse, shown below, meets both of these requirements because it efficiently utilizes the frequency domain to utilize a smaller portion of the frequency domain, and because of the windowing affect that it has on each symbol period of a modulated signal. A sinc pulse is shown below along with an FFT spectrum of the given signal.
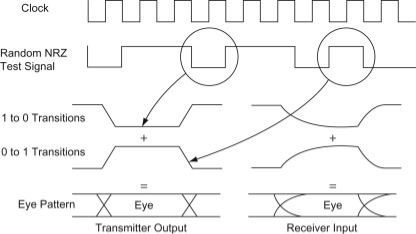
An eye diagram or eye pattern is simply a graphical display of a serial data signal with respect to time that shows a pattern that resembles an eye.
The signal at the receiving end of the serial link is connected to an oscilloscope and the sweep rate is set so that one- or two-bit time periods (unit intervals or UI) are displayed. This causes bit periods to overlap and the eye pattern to form around the upper and lower signal levels and the rise and fall times. The eye pattern readily shows the rise and fall time lengthening and rounding as well as the horizontal jitter variation.
|
Fig. 4: eye diagram
The word binary represents two bits. M represents a digit that corresponds to the number of conditions, levels, or combinations possible for a given number of binary variables.
This is the type of digital modulation technique used for data transmission in which instead of one bit, two or more bits are transmitted at a time. As a single signal is used for multiple bit transmission, the channel bandwidth is reduced.
If a digital signal is given under four conditions, such as voltage levels, frequencies, phases, and amplitude, then M = 4.
The number of bits necessary to produce a given number of conditions is expressed mathematically as
N=log2M
Where
N is the number of bits necessary
M is the number of conditions, levels, or combinations possible with N bits.
The above equation can be re-arranged as
2N=M
For example, with two bits, 22 = 4 conditions are possible.
In general, Multi-level M−ary modulation techniques are used in digital communications as the digital inputs with more than two modulation levels are allowed on the transmitter’s input. Hence, these techniques are bandwidth efficient.
There are many M-ary modulation techniques. Some of these techniques, modulate one parameter of the carrier signal, such as amplitude, phase, and frequency.
This is called M-ary Amplitude Shift Keying M−ASK or M-ary Pulse Amplitude Modulation PAM.
The amplitude of the carrier signal, takes on M different levels.
Sm(t)=Am cos(2πfct) Amϵ(2m−1−M) Δ, m=1, 2....M and0≤t≤Ts
Some prominent features of M-ary ASK are −
- This method is also used in PAM.
- Its implementation is simple.
- M-ary ASK is susceptible to noise and distortion.
This is called as M-ary Frequency Shift Keying M−ary FSK.
The frequency of the carrier signal, takes on M different levels.
Some prominent features of M-ary FSK are −
- Not susceptible to noise as much as ASK.
- The transmitted M number of signals are equal in energy and duration.
- The signals are separated by 12Ts12Ts Hz making the signals orthogonal to each other.
- Since M signals are orthogonal, there is no crowding in the signal space.
- The bandwidth efficiency of M-ary FSK decreases and the power efficiency increases with the increase in M.
This is called as M-ary Phase Shift Keying M−ary PSK.
The phase of the carrier signal, takes on M different levels.
ϕi(t)=2πiM where i=1,2,3......M
Some prominent features of M-ary PSK are −
- The envelope is constant with more phase possibilities.
- This method was used during the early days of space communication.
- Better performance than ASK and FSK.
- Minimal phase estimation error at the receiver.
- The bandwidth efficiency of M-ary PSK decreases and the power efficiency increases with the increase in M.
So far, we have discussed different modulation techniques. The output of all these techniques is a binary sequence, represented as 1s and 0s.
Key Takeaways:
Multi-level M−ary modulation techniques are used in digital communications as the digital inputs with more than two modulation levels are allowed on the transmitter’s input. Hence, these techniques are bandwidth efficient.
There are many M-ary modulation techniques. Some of these techniques, modulate one parameter of the carrier signal, such as amplitude, phase, and frequency.
An optimum filter is such a filter used for acquiring a best estimate of desired signal from noisy measurement. It is different from the classic filters. These filters are optimum because they are designed based on optimization theory to minimize the mean square error between a processed signal and a desired signal, or equivalently provides the best estimation of a desired signal from a measured noisy signal. It is pervasive that when we measure a (desired) signal d(n), noise v(n) interferes with the signal so that a measured signal becomes a noisy signal x(n) x(n)=d(n)+v(n)
It is also very common that a signal d(n) is distorted in its measurement (e.g., an electromagnetic signal distorts as it propagates over a radio channel). Assuming that the system causing distortion is characterized by an impulse response of h (n) s , the measurement of d(n) can be expressed by the sum of distorted signal s(n) and noise
v(n) x(n)=s(n)+v(n)= h (n)∗ s d(n)+v(n) where s(n)= h (n)∗ s d(n).
If both d(n) and v(n) are assumed to be wide-sense stationary (WSS) random processes, then x(n) is also a WSS process. The signals that we discuss in this chapter will be WSS if they are not specially specified. If signal d(n) and measurement noise v(n) are assumed to be uncorrelated (this is true in many practical cases), then r (k) = r (k) = 0.
In this case, the noisy signal, x(n)= h (n)∗ s d(n)+v(n), the relation of r (k) x with r (k ) d and r (k) v (the autocorrelations of x(n), d(n) and v(n), respectively) as follows,
For the noisy signal of the form x(n)= d(n)+v(n), a special case of where h (n) s =δ (n) and no distortion happens to d(n) in its measurement, we have
Optimum filtering is to acquire the best linear estimate of a desired signal from a measurement. The main issues in optimal filtering contain • filtering that deals with recovering a desired signal d(n) from a noisy signal (or measurement) x(n); • prediction that is concerned with predicting a signal d(n+m) for m>0 from observation x(n); • smoothing that is an a posteriori form of estimation, i.e., estimating d(n+m) for m
Fig.5: Optimum filter
|
If a filter produces an output in such a way that it maximizes the ratio of output peak power to mean noise power in its frequency response, then that filter is called Matched filter.
Fig.6: Matched filter
Frequency Response Function of Matched Filter
Impulse Response of Matched Filter
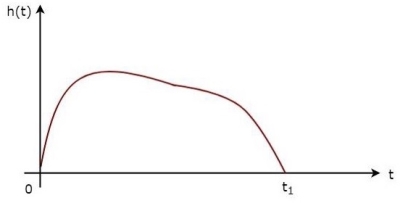
In time domain, we will get the output, h(t) of Matched filter receiver by applying the inverse Fourier transform of the frequency response function, H(f). h(t)= Substitute, Equation 1 in Equation 3. h(t)= ⇒h(t)= We know the following relation. S∗(f)=S(−f) ……..5 Substitute, Equation 5 in Equation 4. h(t)= ⇒h(t)= ⇒h(t)=Gas(t1−t)
In general, the value of Ga is considered as one. We will get the following equation by substituting Ga=1. h(t)=s(t1−t)
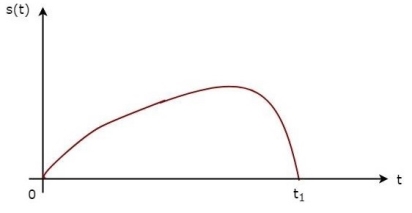
The above equation proves that the impulse response of Matched filter is the mirror image of the received signal about a time instant t1. The following figures illustrate this concept.
Fig.7: Impulse response of Matched filter
The received signal, s(t) and the impulse response, h(t) of the matched filter corresponding to the signal, s(t) are shown in the above figures.
|
Key Takeaways:
The frequency response function, H(f) of the Matched filter as −
H(f)=GaS∗(f)e−j2πft1 ………..1
Where,
Ga is the maximum gain of the Matched filter
S(f) is the Fourier transform of the input signal, s(t)
S∗(f) is the complex conjugate of S(f)
t1 is the time instant at which the signal observed to be maximum
Impulse response, h(t)=s(t1−t)
References:
1. B.P. Lathi, “Modern Digital and Analog communication Systems”, 4th Edition, Oxford University Press, 2010.
2. Rishabh Anand, Communication Systems, Khanna Publishing House, Delhi.
