UNIT - 6
Feedback control systems
The feedback systems are having many advantages over the non-feedback system as we have seen earlier. So, some performance parameters can be controlled through this feedback system such as sensitivity, noise etc. Sensitivity is a parameter which forecasts the effectiveness of feedback in reducing the influence of these variations on system performance. [Reference 4]
The output of the open loop system is given by
C(s) = G(s)R(s) Now due to variation in parameters G(s) changes to [G(s)+ C(s)+
For closed loop system the output is given as C(s) = Now due to variation in parameters it becomes C(s)+ |
The above equation shows that if there is variation in parameters then G(s) is reduced by factor of 1+G(s)H(s). The variation in overall transfer function T(s) due to change in G(s) is defined as sensitivity.
Sensitivity = When there is small change in G(s) then sensitivity becomes
For closed loop system the sensitivity will be For open loop system
As T=G The sensitivity of T w.r.t H is given as
|
The above equation shows that for large values of GH sensitivity of the feedback system w.r.t H approaches to unity.
Key takeaway
For closed loop system the sensitivity w.r.t G is reduced by a factor of (1+GH) as compared to the open loop system.
Control over system dynamics by use of feedback
The dynamics of the system can be controlled by the feedback by adjusting the location of poles. In this section we will see how the location of poles effect the dynamics of the system.
Let us consider a system which has open loop transfer function of G(s) defined as
G(s) = Let K =
The poles for the above system lie at s= - The dc gain of the system is given by G(0) = K = For closed loop system the transfer function is given by
The above equation shows that due to feedback the system pole shifts from - r(t) = And it can also be written as R(s) = 1 Taking inverse Laplace transform of equation 1 we get For open loop system c(t) = K’ Taking inverse Laplace transform of equation 2 we get For closed loop system c(t) = K’ |
The system dynamic response decays in both the open system as well as closed loop system. The closed loop system time constant is  =
=  /(1+K) so its response decays faster than open loop system by factor of (1+K).
Control of effect of disturbance signals by use of feedback
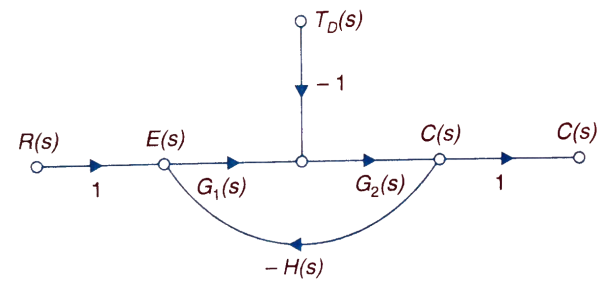
The feedback helps to control the disturbances as they generate an error signal. The sfg for closed loop system is given by
|
Fig 3 Closed loop system with disturbance signal
Where: TD(s) = Disturbance signal. For |G1G2H(s)|>>1 over the range of s |
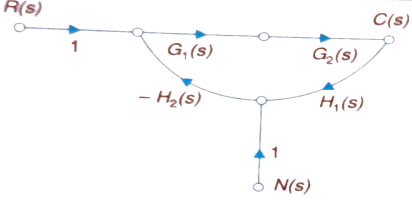
The signal flow graph of a system with noise signal N(s) in the feedback path. The gain is given by
|
Fig 4 SFG for noise feedback function
For Cn(s) = |
The feedback reduces sensitivity, improves transient response and minimises the effects of disturbance signal in control system.
Key takeaway
The dynamics of the system can be controlled by the feedback by adjusting the location of poles.
The closed loop system time constant is  =
=  /(1+K) so its response decays faster than open loop system by factor of (1+K).
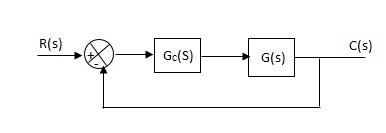
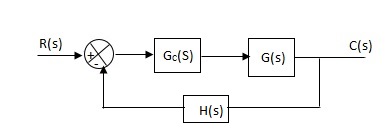
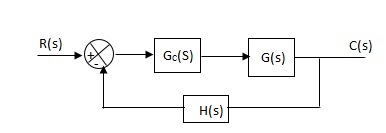
Effects of controller are viewed on time response and stability.
|
Fig 5 Controller with unity feedback system
Gc(S) = TF of the controller
G(S) = OLTF without controller
G’(S) = Gc(S).G(S)
= OLTF with controller
1. Proportional (P) Controller –
Proportional means scalar Multiplier.
Gc(S) = Kp Stability can be controlled Q. G(S) = 1/S(S + 8) CLTF = 1/S2 + 8S + 1 w2n = 1 wn = 1 2ξWn = 8 ξ = 4 ξ>/1 so, overdamped. Now introducing Gc(S) = K G’(S) = Kp/S(S + 8) CLTF = Kp/S2 + 8S + Kp wn = √Kp 2 ξwn = 8 ξ = 4/√Kp If, Kp = 16; ξ = 1; critically damped Kp> 16; ξ< 1; undamped Kp< 16; ξ> 1; overdamped |
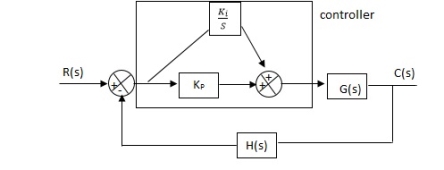
2. Integral (I) controller –
The transfer function of this controller is
Gc(S) = Ki/S
Integral controller is used to improve the steady state response or reduce the steady state error.
|
Fig 6 Integral Controller
G’(S) = Gc(S).G(S)
G(S) = 1/S + 5, Gc(S) = Ki/S
G’(S) = Ki/S(S + 5). After applying the Gc(S) the type of system is increasing and hence, the steady state error is decreasing (Refer Time Response).
Disadvantage -
By using integral controller, the stability of closed loop system decreases.
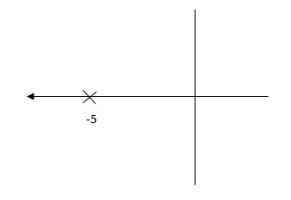
G(S) = 1/S + 5
|
Fig 7 Pole Locations For given system
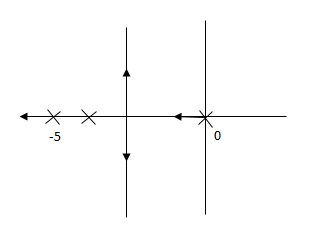
G’(S) = Ki/S(S + 5)
|
Fig 8 Pole Location after Integral controller
Fig(7), is more stable than (8) as more the away the pole from origin (imaginary axis) more is the stability.
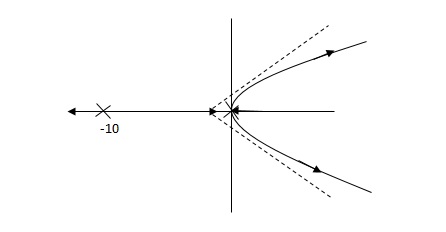
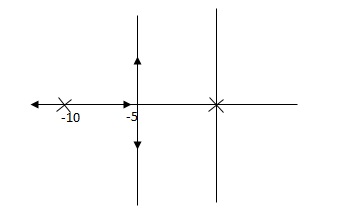
Q. G(S) = 1/(S + 5)(S + 10)
G’(S) = Kp/S(S + 5)(S + 10)
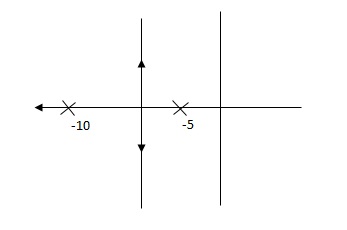
G(S) = 1/(S + 5)(S + 10)
|
Fig 9 Root Locus Without controller
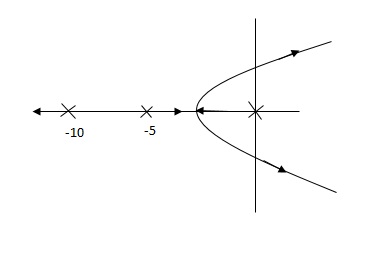
G’(S) = Ki/S(S + 5)(S + 10)
|
Fig 10 Root Locus Without controller
So, Fig 10 is less stable at root locus lies on the R.H.S,
3. Derivative (D) Controller -
They are used to improve the stability.
|
Fig 11 Derivative controller system
G’(S) = KdS/S2(S + 10)
|
Fig 12 Root Locus for system without controller
|
Fig 13 Root locus with controller
Fig 13 is stable i.e. more stable than the Fig 12.
Disadvantage –
It increases the steady state i.e. o/p will not track the input at steady state.
4. Proportional Plus Integral [PI] controller -
|
Fig 14 PI controller
Gc(S) = KpS + Ki/S
The steady state error will decrease and the stability will depend on Kp i.e. if Kp is increased/decreased than according to it stability will change (Kpα stability).
Used to reduce ess without much affecting the stability.
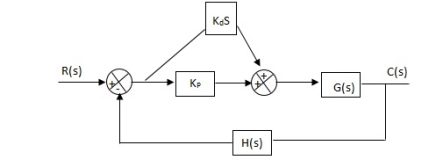
5. Proportional Plus Derivative (PD) Controller -
|
Fig 15 PD controller
Used to improve the stability without affecting much the steady state error.
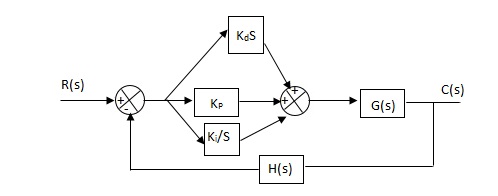
6. PID controller -
Gc(S) = Kp + Ki/S + KdS
|
Fig 16 PID Controller
It improves the stability. It decreases the steady state error and both are proportional to Kp.
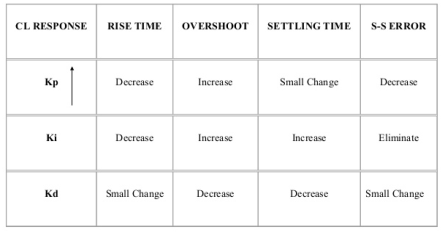
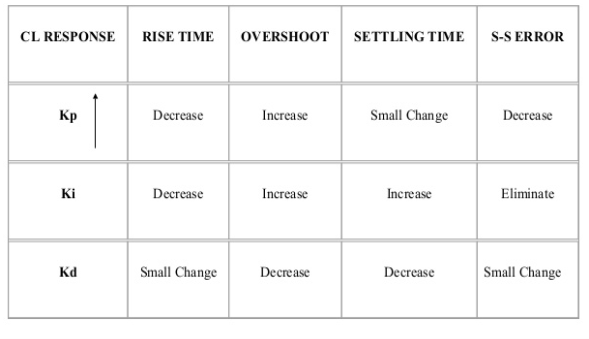
Key takeaway
|
Example-1 The block diagram of a system using PI controllers is shown in the figure below Calculate:
(a). The steady state without and with controller for unit step input?
(b). Determine TF of newly constructed sys. With controller so, that a CL Poles is located at -5?
|
Fig 17 Block diagram with PI controller
(a). Without: C(S)/R(S) = 0.2/(S + 1) C(S) = R(S) 0.2/(S + 1) + 0.2 For unit step ess = 1/1 + Kp Kp = lt G(S) S 0 = lt 0.2/(S + 1) S 0 Kp = 0.2 ess = 1/1.2 = 5/6 = 0.8 (b). With controller : Gc(S) = Kp + Ki/S G’(S) = Gc(S).G(S) = ( Kp + Ki/S )0.2/(S + 1) = (KpS + Ki)0.2/S(S + 1) ess = 1/1 + Kp = 0 So, the value of ess is decreased. (b). Given Kpi/Kp = 0.1 G’(S) = (Kp + Ki/S)(0.2/S + 1) = (KpS + Ki)0.2/S(S + 1) As a pole is to be added so, we have to examine the CE, 1 + G’(S) = 0 1 + (Kp + Ki)0.2/S(S + 1) = 0 S2 + S + 0.2KpS + 0.2Ki = 0 S2 + (0.2Kp + 1)S + 0.2Ki = 0 Given, Kpi = 0.1Ki Kp = 10Ki S2 + (2Ki + 1)S + 0.2Ki = 0 Pole at S = -5 25 + (2Ki + 1)(-5) + 0.2Ki = 0 -10Ki – 5 + 25 + 0.2Ki = 0 -9.8Ki = -20 Ki = 2.05 Kp = 10Ki = 20.5 Now, G’(S) = (KpS + Ki)(0.2)/S(S + 1) = (20.5S + 2.05)(0.2)/S(S + 1) G’(S) = 4.1S + 0.41/S(S + 1) |
Example-2 The block diagram of a system using Pd controller is shown, the PD is used to increase ξ to 0.8. Determine the T.F of controller?
|
Fig 18 Block diagram with PD controller
(1). Kp = 1 Without controller:- C(S)/R(S) = 16/S2 + 1.6S + 16 wn = 4 2 ξwn = 16 ξ = 1.6/2 x 4 = 0.2 (b). With derivative :- ξS = 0.2 to 0.8 undamped to critically damped, G’(S) = (1 + KdS)(16)/(S2 + 1.6S) CE: S2 + 1.6S + 16(1 + KdS) = 0 S2 + (1.6 + Kd)S + 16 = 0 2 ξwn = 1.6 + Kd1.6 wn = 4 ξS = 0.8 2 x 4 x 0.8 = 1.6 + Kd1.6 6.4 – 1.6 = Kd1.6 4.8/16 = Kd Kd = 0.3 TF = (1 + 0.3S)16/S(S + 16) |
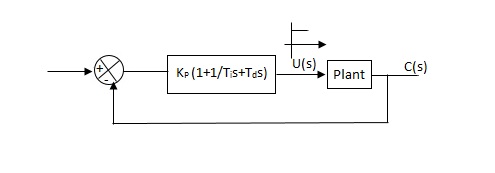
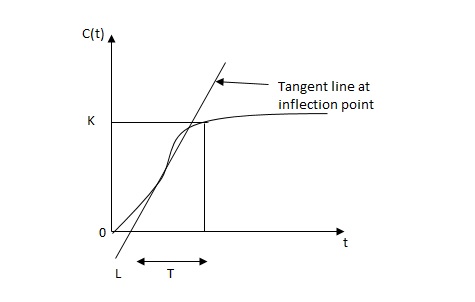
1) First Method: The basic PID controller is shown in figure below. in this method a unit step response of a plant. is obtained if the plant has neither integrator non dominant complex conjugal poles, then the output step curve is of shape s. as shown below. These curves are generated experimentally.
|
Fig 19 PID CONTROLLER
|
FIG 20 S-SHAPED RESPONSE CURVE
 delay time -L calculated by drawing
time constant -j tangent
c(s) / l(s) = ke-l1s / ts+1
The values of KP, Ti and td should be set according to the table suggested by Ziegler Nichols tuning rules shown below.
Type of controller
Types of controller | Kp | Ti | Td |
|
P | T/L | 00 | 0 |
|
PI | 0.9T/L | L/0.3 | 0 |
|
PID | 1.2T/L | 2L | 0.5L |
|
Controller gain Gc(s)= kp(1+1/Tis+Tds) = 1.2T / L(1+1 / 2LS+0.5 LS) = 1.2t/l+0.6t / L2S+0.6TS = 0.6T(2/L+1/L2S+S) Gc(s) = 0.6 T(S+1/L)2/S |
Thus , the PID controller has a pole at the origin and double zeros at S=-1/ L
- Second Method -
1) firstly set Ti= and Td=0
2) use proportional control action only, increase kp from 0 to Kcr (Critical value).
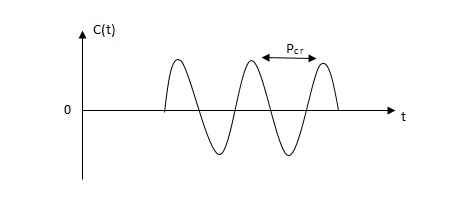
3)then Kcr and pcr (period) are determined experimentally.
|
Fig 21 closed loop with proportional controller
|
Fig 22 sustained oscillation with period pcr.
4)For this method Ziegler Nichols suggested new set of values for kp ,ti and td shown in table below.
Types of controller | KP | TI | Td |
P | 0.5Kcr |
| 0 |
PI | 0.45 KCR | 1/1.2PCR | 0 |
PID | 0.6KCR | 0.5PCR | 0.125PCR |
|
|
|
|
GC(S) = KP(1.1/Tis+Tds) =0.6 Kcr(1+1/0.5PcrS+ 0.125 PCRS) =0.075 KcrPcr(s+4/Pcr)2 / s |
Thus, the PID controller has a pole at the origin and double zeros at s= -4/Pcr
Key takeaway
It is a PID tuning method for controlling and improving parameters like Kp, Ti and Td. They provide good regulation.
References:
1. “Control System Engineering”, Norman S. Nise,John willey and Sons, 6th Edition, 2015.
2. “Control System Engineering”,I.J. Nagrath and M. Gopal,New age International publication, 5th Edition, 2014.
3. “Modern Control Engineering”, Katsuhiko Ogata,Prentice Hall of India Pvt
Ltd, 5th edition.
4. “Automatic Control System”, Benjamin C. Kuo, Prentice Hall of India Pvt Ltd, Wiley publication, 9th edition


