Unit II
Office Productivity Tools
Microsoft Office is a package that consists of a set of productivity application software’swhichare frequently used by Microsoft Windows users. The MS Windows is an OS which provides the platform for these office tools.
These are called office tools because they are very useful in disposing various day to day office works. There are many tools available in MS Office like Word, Excel, Power point, Access, Publisher etc. The office tools are integrated with the MS Windows to give the best performance on windows platform. All the documents created in one tool can easily be reused in the other one.
Features of MS Office:
- Great feasibility with MS Windows.
- Similar look and feel of all tools makes it easy to use package.
- Simultaneous Collaboration with all other tools.
- Simple Sharingof created files among tools.
- Smart Lookup of data.
- Easy sharing of created files among email.
- Tools to create Webpages, graphics, and other useful files.
- Multi language support.
- One-click Office Assistance.
- One-Click Reporting & Forecasting.
- Compatible across Multiple-Devices.
- Security & Privacy of Data.

MS Office Usage
MS office package is widely used in almost every area and it is the basic applications package which one has used at least once in his lifetime.Among its wide usage some of the major areas of this package are:
Usage in daily business: MS Office is used daily in a workplace to share information over email, creating organisation policies, making business reports and charts, managing inventory of the business, communicating with customers, creating invoices, managing financial data, accounting etc.
Used in Education: This package is widely used to make notes, learn topics through slideshows, make articles, passages, create project files etc.
Home-based usage:Not only in business and education sector this package is also used at home to create shopping lists, to manage monthly budget, take note of monthly expenses, typing and taking print outs of texts or graphics etc.
Individual Usage: With the help of MS package a person can communicate with the job listings, create attractive resumes and share them, with spelling check functionality a person can type typing error free documents, this tool helps a person to land a job.
Used in hospitals:This package can be used to maintain a record of patients, doctor visits, medicinerecords, visitor’s records, patient discharge schedules, etc.
Used in literature field:To create books, articles, and newspapers this suite is perfect as it contains a wide variety of tools to manipulate text data and images. It can further be used to create, edit, translate, and convert PDF documents for manipulations.
This tool of MS Office is used to create text-based documents and perform various operations on such text document. If a user wants to make aletter, memo, project report, sale invoice etc. on a computer you need MS Word. MS Word does what it says – process words or text.
Processing words meanswith the help of MS Word you can type your own text, edit this text, modify it, delete it or even can print it.The biggest advantage of MS Word is “cut, copy and paste” which means that once if you have typed the text you can move or copythattext around almost anywhere in the current document or to a new document.
With software like MS Word you can create just about any kind of document.In earlier version of MS Word the default file format of word files was .doc later in MS Word 2007 version this file format was changed to .docx format.
Microsoft Word can be used for the following purposes −
- Creating business documents with graphics and can also include pictures, charts, and diagrams in these documents.
- A user cansave, store and reuse the content and format the whole document as per his needs.
- One can easily createletterheads for business and letters for personal use.
- Designing documents such as invitation cards, a resume etc. becomes easy.
- From office memo to legal copies any kind of documents can be created with MS Word.
ApplicationWindow Contents:
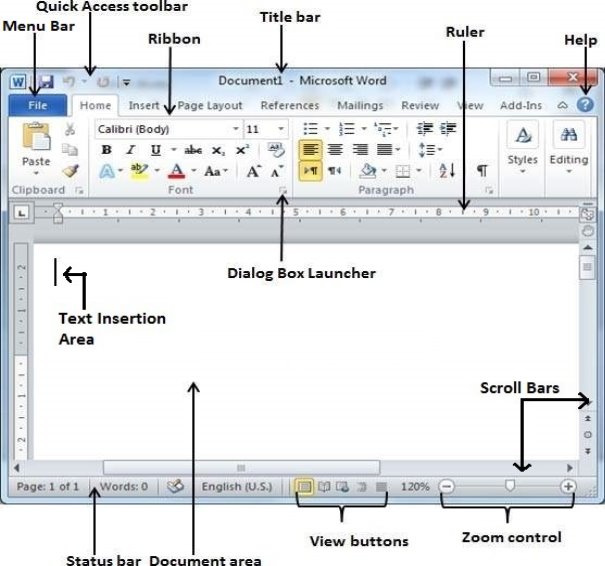
Quick Access Toolbar: This bar is situated just above the File tab and consists most of the frequently used commands. A user can also customize this toolbar as per his preference. By default you will see the following options in your quick access toolbar which includes, Application Logo, Save Option, Undo Typing Option, Repeat Typing Option and Customise Quick Access Toolbar Option as depicted in the below image.
Ribbon: Ribbon contains different tabs with numerous options to perform on your Word document such as Home, Insert, Page Layout, References, Mailings, Review, View, etc.
Title bar: This bar shows the name of the document and the program you are using to view the document. This bar also contains options to: Minimise, Maximize or Restore Down and Close the application.
Rulers: An option used to measure the distance of the words in the document. It shows the left and right margins and tab settings, if any. There are two rulers – horizontal (located below the ribbon) and vertical (located at left edge of the screen). A user can easily show or hide ruler from view tab.
Help: This option is used to get help related to MSWord from Microsoft whenever a user wants. It also includes tutorials which covers various topics in word.
Zoom Control: As the name suggest, this is a type of control bar which lets a user to zoom in or zoom out in the word document. It is used to have a closer look at what you have created or typing. It has a slider with + and – sign at the edges using which you can zoom in or zoom out of the document.
View Buttons: At the bottom of the application window you will find a group of buttons just on the left of Zoom control, which helps a user to switch through various ways a document can be viewed.
Print Layout view: Displays page exactly the way it will appear on printed paper.
Full Screen Reading view: A full screen view of the document can be viewed with this option.
Web Layout view: While using a browser how the document you created will appear is shown by Web Layout view.
Outline view: This option just shows the text of your document and ignores the styling or formatting.
Draft view: This shows a user how the text of their document will appear on a printed piece of paper. You can see how a line, text, line breaks will exactly look like on the paper.
Status Bar: This bar is situated at the bottom of the application window and shows certain information related to your document. It usually displays the page no. On which your cursor is currently out of the total no. Of pages in your document, the total no. Of words in your document and an option of proof reading which tells you whether your document has any grammatical or spelling error.
Scroll Bars: There are two sliders available in word window one is for horizontal slide and another one is for vertical slide. One can scroll through the document by either rolling the mouse wheel up and down or by clicking the up-arrow or down-arrow buttons in the scroll bars.
Document Area: It is the area where a user types his text or inserts an object to create a document. When you type anything in your document it will appear in this area of the screen.
Text Insertion Area: The flashing vertical bar in the document area is the text insertion area and it represents the location where the text will appear when you type.
Menu Bar: The Menu bar is directly below the Title bar and it displays severaltabs and each tab can be used to perform specified function within MS Word. Following are the tabs and their various options available within Menu bar:
 | File Tab: The File tab replaces the Office button from Word 2007. A user can use this menu to open, save, create, print, exit, and perform other document-related operations. |
Home Tab:Most of the frequently used commands are located in the Home Tab. Clipboard, Font, Paragraph, Styles, and Editing are common options available in this tab.

Insert Tab: The Insert Tab is used to insert different features into the document which the user is creating. Various groups and buttons available on this tab are Pages, Tables, Illustrations, Links, Header & Footer, Text and Symbols.

Page Layout Tab:This tab helps a user to change the whole look of his document. There are various themes and color options available to choose from and will be applicable to the whole document. Page Setup, Page Background, Paragraph, Arrange are options available in within this tab.

References Tab: This tab is used to create references in your document with options such as Table of Contents, Footnotes, Citation & Bibliography, Captions, Index and Table of Authorities Options.

Mailings Tab: All the options required for mail merge are available under mailing tab. The whole tab is divided into different groups and each group is used to perform different steps in the mail merge process. Create, Start Mail Merge, Write & Insert Fields, Preview Results and Finish are its options.

Review Tab: This tab contains options to check spelling errors and grammatical mistakes in your whole document, a user can also add comments, compare two or more versions of a document, protect the document, track the changes made by multiple users, etc. These options are helpful when you are working on a group project. This group is divided into, Proofing, Language, Comments, Tracking, Changes, Compare and Protect options.

View Tab: In order to check the looks of your finalized document or change the viewing perspectives in MS Word application this tab can be used. It gives you several options to change view of your documents from normal to Print Layout, Web Layout, Outline, Draft etc., to hide or unhide rulers, gridlines, navigation pages etc. zooming options, switching windows and much more.

Special Menu Tabs: These tabs appear for special operations to be performed on certain objects in your document. These are only visible after inserting the object and selecting it. For example, When you insert an image in your document and select it you will see the format menu which contains options to Adjust, Style, Arrange and Size the image likewise when you insert a table into your document and select it you will see design and layout menu with several other options for formatting your table and text it contains.

Features of MS Word:
MS Word is basically a word processor but it provides its users with such rich features which makes word processing more fun and exciting. Features of this powerful word processor include:
- Pre-loaded templates and themes for certain documents
- Automatic Saving and Re-Opening of documents
- Print Preview and Page Setup before Printing, to best suit your needs
- Spelling and Grammar check for your text files
- Text-level formatting such as bold, underline, italic and strike-through
- Page-level formatting such as indentation, paragraphing and justification
- Word Wrapping your text so that the text lies within the defined margins only
- Select, Cut, Copy and Paste feature
- Find and Replace Text with Advanced features
- Availability of Paragraph and Colum Settings
- Word is not only for typing text you can also use images, equations, symbols, charts, shapes, tables, hyperlinks etc. within your text file
- Availability of predefined SmartArt, WordArt, ClipArt, Watermark for your files
- Securing your files through Password locks and Encryption like features
Let us now discuss some of these features and learn how to perform them in-
Creating files
In MS Word there are basically six options available, solely dependent on the user’s preference of how he wants his new MS word file.
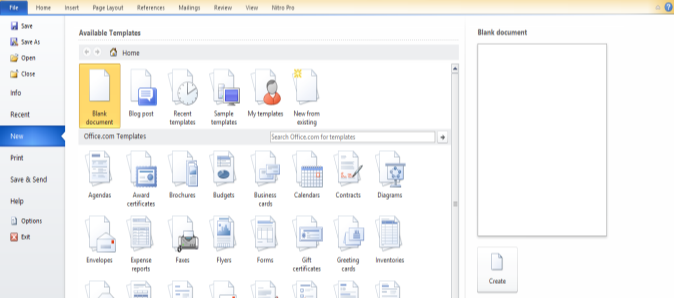
- A user can perform the following steps in order to create a new file in MS Word:
- Open MS Word and Click on the “New Option” from file tab of Menu bar.
- A long list of available options will appear in front of you as shown in the picture on the right hand you can easily see the preview of each type of options available.
- These options include:
Blank Document –It’s a simple blank document which can be used to simply type your text and customize the whole document as per your needs from the scratch. You can also create this type of document easily by simply pressing the Ctrl + N keys on your keyboard in MS Word Application anytime.
Blog Post – Blogging helps to publish one’s thoughts without relying on to some media outlet channels or printing publications. Although you can start creating content for your blog at any time in MS Word through this option but you must have to sign up with a blog publishing service before you can post contents online.
Open a recent template–If you have earlier been working on certain templates and now wishes to re-open on previous one’s then you can choose this option, it will lead you to a list of some recent templates you have been using so that you can choose them again.
Create using Sample Templates –There are a lot of pre customized templates option available to choose from. This makes your files more attractive and is a time savvy option. These templates have everything pre-defined within them as to which font to choose, which color to use, how much margin to take, etc. and are pretty customizable too.
Create your own customized templates – A user can however choose from available templates in MS Word or can also create its own new template, where all the options will be as per his choice and preferences. This newly created template can also be saved and can be reused whenever the user wants to.
New File from an existing file – This option simply gives user liberty to open an existing MS Word file and edit and create a new file with that old existing file.
- From these available options simply select whichever option best suits your need and after selecting click on create button available at the bottom of the right hand preview screen.
- A new window will open with the type of file option a user has selected.
Editing Text
This is the most important function of MS Word, as each individual is far from perfection and is bound to make some grammatical errors or spelling mistakes. With a typewriter, your only option would be to retype the entire document but with word you can make the changes in the document as many times as you want (before printing the document) without ever retyping the document.
Therefore to help you assist in this task MS Word has certain features which are as follows:
Select: Whenever a user types something in a document and wants to copy, move or format the text he first have to select the word or the whole sentence as per his requirement. For this he just have to push the shift button on the keyboard and press the left, right, up or down arrow to move the cursor and select the text he wants.
Alternatively, he can click the left button of the mouse and then drag it to the direction from where he wants his text to be selected. Just remember that one word at a time is selected always. To select the whole document at once Select All option is used or you can also press Ctrl + A from your keyboard.
Cut: A user can move the selected text from one place to another using this option. In this option the text is removed from its previous position and is pasted to the position defined by the user in the document. To do this just select the text you want to cut and go to home tab and click on cut option or simply select the text and press Ctrl + X on your keyboard.
Copy: This is similar to Cut but instead of moving the selected text this option creates a similar copy. When the user paste the selected text the whole text is replicated into the place user has selected. It means the text will be available in both its previous place and to the newer place where user has pasted the text. To do this just select the text you want to copy and go to home tab and click on copy option or simply select the text and press Ctrl + C on your keyboard.
Paste: When we perform cut and copy operations the text goes to the clipboard, (a place which temporarily stores the data which user cut and copies while performing operations in windows) from this clipboard the data is retrieved using paste option. To do this just select the place you want the cut or copied data and go to home tab and click on paste option or simply press Ctrl + V from your keyboard.
Note: There is a difference when we cut + paste the data and copy + paste the data. As with cut + paste the data is moved from clipboard to the selected place only once while with copy + paste a user can make a replica of the data a million times till it is stored in clipboard or till your next cut or copy operation.
Delete: When a user enters some data into the document and it is normal to make certain mistakes either grammatically or spelling error this can be easily corrected by removing the wrong data or word. There are two options to do so either by pressing the Delete key or the Backspace Key on the keyboard. The Delete key removes the text to the right side of the cursor while Backspace key removes the text to the left side of the cursor but both will only remove one character at a time.
Undo: Suppose a user has performed certain options on text in word, but later he wants the text back to its original form as he doesn’t liked the changes he has done so in order to undo the operations he has performed he can choose undo option from the home tab or can simply press Ctrl + Z key from the keyboard. This option reverses the changes done one by one from latest to last but do note not all changes can be reversed as this option has its limit.
Redo: While doing Undo it may happen that the user gets past the changes that he actually wanted in his document. So to redo the last changed thing he can use the redo option available from the home tab.
Find: When you have a very lengthy document (say 50 pages) and you want to search a particular text or other content from this document you can either scroll, read the whole document and search that particular text by yourself which is a very time consuming and hectic process or you can simply select the Find option from home tab and type the text you want to search and hit search. In result, MS Word will take you one by one to all those places where that particular text appeared.
Replace: This option is used with Find option and often termed as Find and Replace option. With this option you can find and replace the particular text or sentence with some other text or sentence appearing in the whole document at once or one by one, as per your needs. You can find this option in home tab and it includes spaces to enter the word you would like to find and the word to replace with the founded word.
Formatting Documents
Formatting refers to the way a document or text is presented on the page. It includes changing font face, font size, font styles (like bold or italics), spacing, margins, alignment, columns, indentation, and list.
It usually changes the way words appears on the page. A well formatted document is consistent, correct, and easy to read. There are numerous options for formatting documents in MS Word, these are:
Font Formatting: This option is used to present the font of the document in various styles, sizes, colors and visualization. You can change font formatting by simply selecting the font you want to change and right click from your mouse, from the list of options choose Font, which in return will give you the following menus to access various font formatting options:
Font Face: The actual look of the font is changed using font faces, as every person has different writing styles likewise there are numerous options available to change the font faces in MS Word just select the font face you want for your text. Sample
Font Style: In order to give styling or special emphasis to the text in your document you can select Bold (darker form of text), Italic(rightly leaned), Regular (normal), and Bold Italic(darker and rightly leaned)options the font menu.
Font Size: The actual size (big or small) of the font can be changed from this option so that it becomes easily readable. The size is measured in Points. Sample1, Sample2.
Font Color: The color of the font can be changed from this option so that you can differentiate the text from normal text.
Font Effects: Various effects can be used with text in a document. These effects includes: Strikethrough (Text Crossed out with single line), Double Strikethrough (Text Crossed out with double line), Superscript (creates letter above the line of text), Subscript (creates letters below the line of text), Hidden (Text will be hidden in the document).
Change Case: A user can change selected text to UPPERCASE(ALL TEXT IN CAPITALIZED LETTERS), lowercase(no capitalization), Sentence case (Only First letter of the sentence is in capitalized form), Capitalize Each Word(First Letter Of Each Word Is Capitalized) and tOGGLEcASE(lEAVINGfIRSTlETTERiNsMALLcASErEMAININGlETTERSiNeACHwORDiScAPITALIZED) through change case option in font menu.
Text Effects: You can apply a visual effect to the selected text such as a shadow, glow or reflection with this option. It is available in Home tab and can be easily used by just selecting the text you want to change and click on one of the options available in Text Effect menu as per your preference.
Text Highlight Color: This option is used to highlight a text in the entire document. It makes the text look like it was marked with a highlighter pen so that important information is never missed out. You can access this option by selecting the text and going to Home tab from where Text Highlight Color can be selected.
WordArt: There are certain special effects for selected text available in MS Word that can change the full appearance of text. This can be used to add color, outlines and shadows to regular text and can be accessed from Insert Tab from Menu Bar.


Paragraph Formatting
A paragraph in Word is a group of sentences on a particular topic,at the end of which Enter Key is pressed and new line is used to enter new text. Paragraph formatting is used to change the visual appearance ofa paragraph. Paragraph formatting is applied to an entire paragraph and not on to a single word or line.
After selecting a paragraph if you right click with your mouse you will get certain options from which if you select paragraph option the following menu will appear. This menu includes the following options:
Alignment: This is a paragraph formatting tool that determines the appearance of the text in a whole paragraph. Left Alignment is the default alignment for text. You can select the paragraph that you want to Align and then go to Home tab; from there you can select from the four available options i.e. Left Align, Center Align, Right Align or Justify.
For example, in a paragraph that is center-aligned, text is aligned within the center margins and in a paragraph that is justified, text is aligned with both margins.
Outline Level: It is the Heading level, the level of heading at which the paragraph appears in Outline View.
Indentation: The distance or number of blank spaces which separates a paragraph from the left or right margin can be set using indentation. It tells a paragraph from where to start writing from the left side and where to switch to a new line from right side. You can set both left and right margins as seen in above picture.
Spacing: The distance between lines in a Word document can be controlled with the help of spacing options. With this option a user can also customize the space added before and after the paragraphs.
Bullets and Numbering: In order to make list easier to read, we can always add a number or bullet points before each item. These options can be easily accessed by selecting the list on which you want to add bullets or numbers then right click with your mouse and take your mouse to the Bullets or Numbering option you’ll get various options of bullets or numbers for you to select for your list, just click on your choice after which it will be applied. You can also access the same from home tab.
|
|
BULLETS OPTIONS | NUMBERING OPTIONS |
Printing Documents
After user has finalized his document with all the formatting, he can take the print of his finalized document through a printer so that the soft screen document can be converted to hard physical copy for further usage. In order to take print the user has to attach a printer to his computer and after configuring it he can take printouts through MS Word directly. To do so the user has to follow these steps:
- The foremost step before printing a document is to save the document so that it won’t get lost if user accidentally closes the window. In order to do so either click on File tab and from there select save option or simply press Ctrl + S on your keyboard.
There is a difference between Sava and Save As, since save is used to save changes in an already saved file or document while save as is used to save a new document in the user defined format and place in your hard drive.
- After saving your document a user has to ensure how the document will appear on the print before giving the final print command, for that Print Preview Option is used.

Print Preview: This option can be used by a user to check how the document will actually appear on the hard print copy of the file he has made on the computer screen. As you can see from above picture there are multiple options available when we enter into print menu. These are Print Preview Options. These can be understood as follows:
Print Copies: This shows a user that how many copies of the present document will be printed through the printer. With this option one can take multiple copies of the same document in one command from a printer.
Printer: The next option displays the printer you are using with your PC to print the documents. Users with multiple printers can select the appropriate printer from here to print their documents.
Print Settings: In this a user will be provided with multiple options for the pages they want to print. It includes:
Print All Pages: To print the entire document.
Print Selection: To print only the selected text from the document.
Print Current Page: To print the current displayed page.
Print Custom Range: To print the selected pages by entering the page numbers in the space provided.
Print one sided &Print both sided: First option is to print the document only on the front sides of a page and the next one is to print the document on both front and back sides of a page
Collated & Uncollated: Suppose you have 3 page file and you would like to print 5 copies of each. Collated, file will print 5 times in the order of the file (1,2,3,1,2,3,1,2,3)while, uncollated file will print all 5 sets of each page together (1,1,1,2,2,2,3,3,3). Collated is needed to print in the exact order of the file while uncollated is used to print the file pages separately.
Portrait or Landscape Orientation: To print the entire document in horizontal or vertical form.
Paper Sizes: To print on different paper sizes and is dependent on the printer. A4 is the default paper size.
Margins: In a document the text will start after leaving how much space from top, bottom, left and right is adjusted using margins.
Scaling: This option is used to stretch or shrink the pages to fit the specified area, only the size of the printed page changes i.e. you can print many pages on a single sheet of paper but the size of text and graphics will be reduced depending on the amount of document pages adjusted in one single piece of paper.
Print Preview Screen: A screen on the right side shows the print preview of the options and their effects that you are selecting before finalizing the print.
Current Page No.: This displays information regarding the current page no. You are print previewing from the total no. Of pages of this document.
Zoom Sliders: This is a slide bar used to zoom in or out on the print preview screen.
- Once the user has selected the desired settings and is satisfied he can give the print command from the same menu. The print command can be given by simply pressing the PRINT button available on top of this menu after which the document will be processed automatically by the printer depending upon your settings and you can finally take your hard copy prints for future reference.
Using Tools
Word has many tools to help the user with editing process and make it as easy as possible. A good understanding of Word's tools gives advantage to the user and is acts as a major time saver in preparation of documents. Some of the commonly used tools are as follows:
Spelling & Grammar: This option helps a user to check the spelling mistakes and grammatical error in whole document, a user can accept or ignore changes in the document one by one based on suggestions of this tool. It also allows user to add words to the dictionary, as well as changing the dictionary language (if available). To use this tool just click on the spelling & grammar tool in Review tab which in result will open a box to point out the mistakes and replace them with correct one.
Research: This option opens up a research task pane so that user can search through reference materials, such as dictionaries, encyclopedias, and translation services to make documents more accurate. Thesaurus is one of the great options available in this section used to suggest some other similar meaning word based on the text you have selected. To use this feature simply click on the Research option from Review Tab.
WordCount:This option is used to count the amount of words in the whole document, or the currently selected text. It is also automatically displayed at the left corner of bottom bar in MS Word. Just click on the WordCount option in Review Tab.
Translate: This option translates a word or paragraphs into a diffrerent language of your choice using bilinngual dictionary or machine translation. It is available in Review tab and on clicking it gives you three options i.e., Translate whole document, Translate Selected Text and Mini translator (to translate the text automatically on selecting).
Language: This tool contains options, toset the default language of the entireMS Wordincluding the document tools, translators, thesauruse, hyphenation, spelling and grammar etc. In short this tool can change the language of the entire word menus, tools and other dialogue boxes so that it can be easily understood by the user. This tool is also available under the Review tab of the Menu bar.
Restrict Editing: This tool allows its user to control the protection of his document, including tracked changes, comments and forms. It won’t letothersto edit or format specific parts of the document.A user can prevent formatting changes, force all changes to be tracked, or only enable commenting. This option is also available under Review Tab.
Macro:It is anaction or a set of actions that a user can record andrun as many timesas he wants. If a user has certain task which he performs repeatedly, then he can record it to a macro in order to automate those tasks. When a user creates a macro, he is recording all his mouse clicks and keystrokes.
One can find Macros in View Tab, on clicking Macros you will be presented with two options the first one is to View Macros to perform view, add, edit, delete operations on macros and the second one is Record macro in order to record a new one.
Track Changes:One can use this option to track any subsequent changes made to the document by some other users. This option is very useful while working on a group project with your teammates. To use this option it has to be enabled first by clicking on Track changes under Review Tab after which all the changes will be recorded by MS Word.
New Comment: A user has the facility to add a comment into the document by using this feature. To do so the user has to go to the Review tab and click on New Comment from where he can add his comments easily. After adding the comments few other options will be available to the user to goto the Previous Comment or Next Comment or Delete the comment from the documents.
Page Setup
The page setup is the limits defined by the user through which he can control how a printed page will appear. It includes size, margins, page orientation, and quality of print. A user might have certain requirements keeping in mind which he wants to create the document for this he might want to change the default page settings this can be achieved easily through page setup options available in MS Word.
Following are some of the mostly used Page Setup options:
Margins: In a document the text will start after leaving how much space from top, bottom, left and right is adjusted using margins. A user can select these options from Page Layout tab. There are multiple options available under Margins with some pre-defined spacings such as, Last used custom setting, Normal, Narrow, Moderate, Wide, Mirrored, Custom Margins.
Orientation: This option defines how the entire document will look and print as per his preference and usage. This look can either be horizontal (Landscape) or vertical (Portrait) form. One can select this option from Page Layout Tab.
Size: A user can create different documents for different purpose and these different types of documents have different print or paper size formats, in order to print the correct document with correct form of paper size a user can choose this option. There are different paper size options available for different documents such as, Letter, Legal, A3, Statement etc. but the default paper size is A4 format.
Columns: Sometimes a user wants to split a paragraph into two or more columns so that he can arrange his data in more readable and conclusive format for that a user he can choose columns option. This option is also available under Page Layout Tab and contains One, Two, Three, Left, Right etc. options.
Breaks: This option is used to separate contents between a Page, Section or Column within the document. After the break the next text will start from new Page, Section or Column as per the chosen Option.
This option is also available under Page layout tab and contains various options such as, Page Break (text starts from new Page), Column Break ( text starts from new column), Text Wrapping (text separated from objects) etc.
Line Numbers: This option is used to add Line numbers in the margin alongside of each line of the document. There are various options available under this also such as Continuous, Restart at each page, Restart each section etc. A user can select this from Page Layout tab and select the options according to his usage.
Watermark:It is an image or text that appears at the back ofyour document. These documents will normally display the status of the document as "confidential", ‘Draft" etc. These can be in the form of texts or even images like logo, pictures etc. and are normally used to prevent counterfeiting. It prevents people to use watermarked documents of others and present them as their own.
Page Colour: A user can set the background color or can fill effects in the background of his documentto make it morecreative and attractive to the readers. A user can change the background color by clicking on Page Layout and selecting Page colour option.
Page Borders:Borders are lines that surrounds the whole document. Adding a border gives the document a boundary within which all the text will lie. There are many customization options available with Page Borders such as style, thickness, and number of pages for a border to apply etc. A user can select the Page Border option from Page Layout tabs.
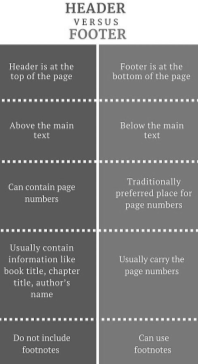
Header& Footer:A header is the space within the top margin of each page, and a footer is the space at the bottom margin of each page. Headersand footers are used to include that informationwhich a user wants to appear on each and every page of the documentsuch as your name, title of the document, page numbers, company logo etc. A user can insert the Header and Footer from Insert Tab and can select from various pre defined formats or can make a format of their own.
Paragraph Indent:Indents are used to give a certain amount of blank spaces before and after awhole paragraph. This option is used to position the starting of the selected text fromleft margin and ending of the text from right margin. The option to set the margins of a document is a paragraph indent. It can be changed either from the ruler lines or from the PageLayout tab, these can be inserted for both left and right sides.
Line Spacing:This option is used toinsert gaps between the lines of a document so that newer lines and paragraphs have enough spacing from up and down side and they doesn’t mix with the older text or paragraph and thus, becomes easire to read. You can find Spacing Option in Page Layout tab and can be used only for up and down size space adding.
Wrap Text:This option helps the text or line to surround itself with the selected object (Picture, clipart, graph, charts etc.) so that when you move the text or the object to some other place the whole thing moves with the other so as to ensure data validation among the document.
Mail Merge in MS Word
Every day, we come across documents containing similar information to be sent to a number of people. For example, interview call letters have to be sent to fifty candidates. Therefore, the address has to be changed of the recipients. The effort and time of typing 50 letters is a very cumbersome task and can be shortened by using the mail merge feature of MS Word.
This feature lets you quickly create personalized letters and mailing labels for each person separately by changing the address automatically.
The three main components of the merging process are: the document, the data source and the merged document.
To start mail merge, the following points have to be done:
- Opening or creating a main document, which contains the information you want to repeat in each mail.
- Opening or creating a data source, which contains the data that has to be unique in merged documents – for example, the name and address of each recipient here, data source can be an Excel file, a Table in Word, a Text file, or a Database.
- Inserting the merged fields in main document which tells MS Word where to insert data from the data source.
- Merging data of data source and main document after which each row in the data source will produce an individual mailing label. The merged documents can be sent directly to an e-mail address or can be saved in a file for future references.
Customizing a Mail Merge
To customize a mail merge, you can specify which data to merge, preview the merged documents, and fine-tune the results For example; you can target specific customers, such as those in specific postal code areas. Or you can have MS Word prompt you to enter a client’s appointment date and time.
Steps to perform Mail Merge
Steps | Actions | Pictorial Representation | |||
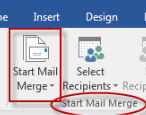
I. | In a blank MS Word document, click on the Mailings tab, and go to Start Mail Merge group, click Start Mail Merge.
|  | |||
II. | Now, click on Step-by-Step Mail Merge Wizard. | 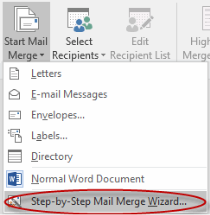
| |||
III. | Select your document type. In this example we will select Letters. Click Next: Starting document. | 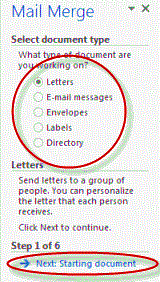
| |||
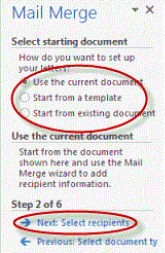
IV. | From the given options choose “Use the current document”(We are using the current (blank) document as an example)Click Next: Select recipients.
Note: Selecting “Start from existing document” changes the view and gives you the option to choose your document. On choosing the document, the Wizard will revert back to “Use the current document” option.
|  | |||
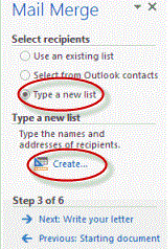
V. | Select the recipients. In this example we will create a new list, so select Type a new list and then click Create.
| 
| |||
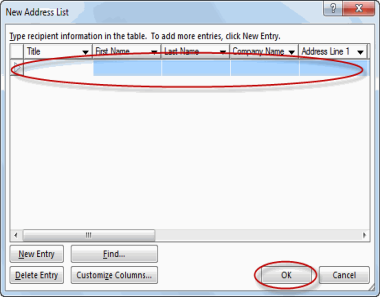
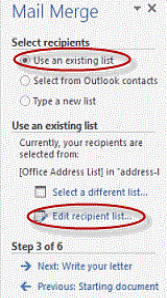
VI. | Here, create a list by adding data in “New Address List” box and choose OK to Save the list. Note: Since the list has been created, the Mail Merge Wizard will revert back to “Use an existing list” and here a new option to “edit the recipient list” will appear.
| ||||
| |||||
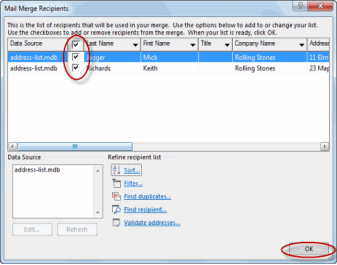
VII. | The “Edit recipient list” option will open the Mail Merge Recipients box, where you can edit the previously created recipient list and select or unselect records from this list. Once you are satisfied with the data Click OK to accept the list. Click on Next and choose “Write your letter” option from the menu. Here you can write your letter and can add custom fields. | ||||
| |||||
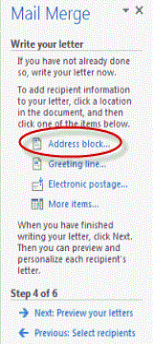
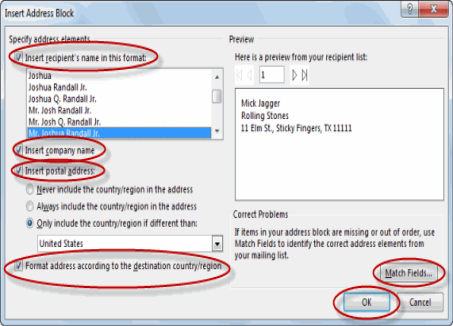
VIII. | Click on “Address block” option to add the recipients' addresses at the top of the document. From “Insert Address Block”, tick or un-tick the boxes and select the options from left side till the correct address appear and click on Ok once done.
Note: A user can also use “Match Fields” option to correctly match the address and correct any problems appearing in address field.
| ||||
  | |||||
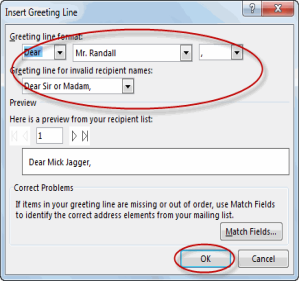
IX. | From “Write your letter” options simply select “Greeting line” option to enter the greetings in your letter.
From“Insert Greeting Line”, select the greeting line format from the drop-down menu and select the options of your choice. Once done Click on OK button
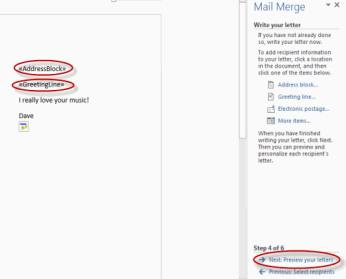
Note: The address block and greeting line both will be surrounded by « ». At the below lines write a short letter of your choice and click on “Next: Preview your letters” option | 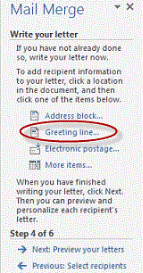
| |||
| |||||
X. | Here you can finally preview the letter you are about to send. Once you are satisfied with the information displayed
Click “Next: Complete the merge”
This completes your mail merge you can Click Print from here to print your letters or Edit individual letters to further personalize some or all of the letters | 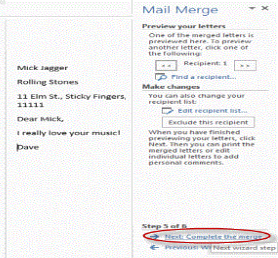 | |||
MS Excel is a spread sheet program which is a very indispensible tool to help its users to monitor and analyse numerical data, create graphs, pie chart and histograms. An electronic spread sheet programs like MS Excel accepts the data in the form of rows and columns (tabular) and allows its user to manipulate, calculate or analyse data in a desired form.MS Excel was using the default file format of .xls for excel files which was later replaced by .xlsx format in MS Word 2007 version.
MS Excel Application Contents:
The main advantage of using a Microsoft product is that it is fully compatible with the Operating System of Microsoft i.e., Windows 7, 8.1, 10 etc. Also, the program window and options of every Microsoft product is somewhat similar to each other. In here, MS Excel also has almost the same application window as that of MS Word with many similar options such as, quick access toolbar, ribbon, scroll bars, zoom control etc. Thus, we will only cover the unique features and options of MS Excel in this part.
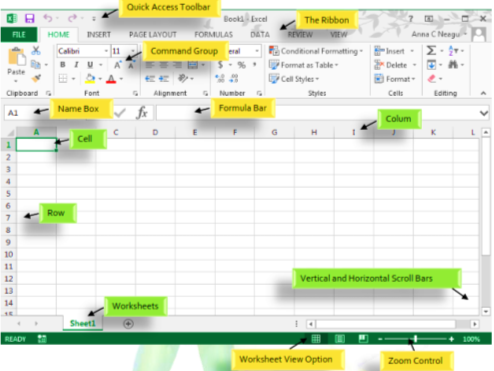
Formula Bar: The Formula Bar is where user inputs its command or functions or formula for the computer to perform operations based on the sheet data. The Highlighter cell in a worksheet appears is the active cell. This Bar can also be used for data or formula editing in current cell. The differentiation factor between data and formula for this bar is “=” sign i.e. if a user wants to enter formula in this bar he first have to enter = sign then enter the formula else MS Excel will treat it as normal data.
Workbook: The collection of worksheets is a workbook. When we start MS Excel the first thing we see is a workbook containing three Sheets naming Sheet1, Sheet2 and Sheet3. This combination of three sheets is a workbook and allows user to manipulate and store data.
Worksheets: These are the main sheets where user enters his data and perform numerous operations on it. We can say that Worksheet is a combination of rows and columns. MS Excel is like a book where the worksheets are like pages of a book and workbooks are the whole book of these pages.
Sheet Tabs: The name of the sheets, appear on the tab at the bottom of the workbook window. To move from one sheet to another, a user can click on the sheet tabs.
Column: Columns are the squares or rectangle placed on top of each other vertically like a pile of textbooks. Columns are labelled from left to right with letters. The first column is letter A and the last column is letters XFD and is the 16384th column in MS Excel 2010.
Row: Rows are the square or rectangular boxes placed adjacent to each other in a horizontal position. They are numbered from top to bottom along the left edge of the worksheet. There are 1048576 rows in MS Excel 2010.
Cell: The convergence of a row and a column is known as a cell. A range of cells is a group of consecutive cells that forms a rectangular area in shape.
Cell Address (Name Box): Each cell has a unique address which is used to identify the location. A cell address starts with the column number followed by row number. For example, B20 is the intersection of column B and row number 20. The area where it is displayed is termed as name box.
Menu Bar: The Menu bar is directly below the Title bar and displays several tabs just like it was in MS Word and we can use each tab to perform specified functions in MS Excel too. Some tabs (Home, Insert, Page Layout, Review and View)mostly have the common features as that of MS Word so we will discuss only about the two uncommon tabs:
Formula Tab: This tab contains numerous amount of formula or operation which a user can perform within MS Excel. The most common formula available here includes add, subtract, average, multiply, sum, auto sum, etc.

Data Tab: Main usage of MS Excel is that we can work on a large set of data. Whenever there is a large data involved, there is a need for sorting, filtering, exporting and consolidating the data all of which can be performed through this tab in MS Excel. It includes options for getting external data, sorting & filtering the data, grouping and ungrouping the data etc.

Features:
- Large spreadsheets can be stored on the computer.
- It is possible to maintain multiple copies of a worksheet.
- Creating Worksheets
- Entering and creating various Formulas is quick and easy.
- Useful for scientific calculations and automatic recalculation facility.
- Analyses of data can be easily done with Charts, Histograms, Tables etc.
- Sorting of data is easy.
- Pivot Tables, VLook up, Freeze Panes and other useful tools
- Page Setup and Print Preview options before taking printouts
- Importing files from other packages is easy
Let us now discuss some of these features and learn how to perform them in detail-
Creating Worksheet
In MS Excel there are also six options available, which user can select as per his preference and usage just as MS word.
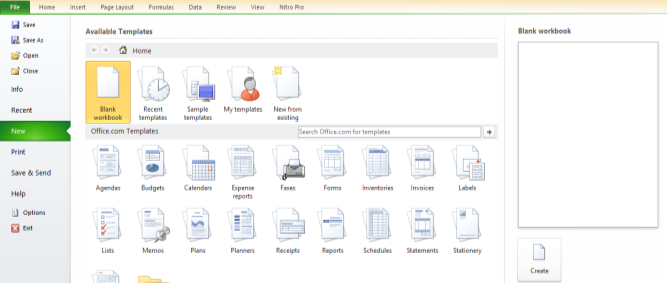
A user can perform the following steps in order to create a new worksheet in MS Excel:
- Open MS Excel and Click on the “New Option” from file tab of Menu bar.
- A long list of available options will appear in front of you as shown in the picture; on the right hand you can easily see the preview of each type of options available.
- These options include:
Blank Workbook – It’s a simple blank workbook which can be used to simply type your data and customize the whole workbook as per your needs from the scratch. You can also create this type of workbook by simply pressing the Ctrl + N keys on your keyboard in MS Excel Application anytime.
Open a recent template – If you have earlier been working on certain templates and now wishes to re-open on previous one’s then you can choose this option, it will lead you to a list of some recent templates you have been using so that you can choose them again.
Create using Sample Templates – There are a lot of pre customized templates option available to choose from. This makes your data more sorted and is a time savvy option. These templates have everything pre-defined within them as to which font to choose, which color to use, how much cell margin to set, etc. and are pretty customizable too.
Create your own customized templates – A user can however choose from available templates in MS Excel or can also create its own new template, where all the options will be as per his choice and preferences. This newly created template can also be saved and can be reused whenever the user wants to.
New File from an existing file – This option simply gives user liberty to open an existing MS Excel file and edit and create a new file with that old existing file.
- From these available options simply select whichever option best suits your need and after selecting click on create button available at the bottom of the right hand preview screen.
- A new window will open with the type of file option a user has selected.
Creating and Using Formulas
A formula establishes a relationship between two or more cells; it can contain functions and values for calculation, operators and cell addresses.
Formulas in MS Excel start with (=) equal to sign e.g. =A5-C2. Formula are used to perform all kinds of manipulations like addition, subtraction etc. Formula can refer to other cells on the same worksheet, cells or other sheets in the same workbook or cells on sheets in other workbooks.
If you combine several operations in a single function –Excel operates in precedence from left to right. However, you can use parenthesis to change the order of precedence. If two operators of the same precedence occur together, then they are executed from left to right.
Formula can also refer to a range of cells to represent range of cells from B5 to B10, you have to type as follows - A5:A10.
If you want to add the value of A1 and B1 and display the result in C1, then move to C1 and type =A1+B1 and press Enter.
This formula can easily be copied from this cell to some other cell.
Excel has many mathematical functions for finding out the sum, average, minimum or maximum value within a specified range of cells.
MS Excel not only performs the function of a calculator but it also stores the formula in the formula bar and the answer appears in the current cell. There are a number of ways to create formulas. Another interesting feature is that you can apply the same formula to other set of numbers by applying the drag and drop method.
A formula is a sequence of numbers and symbols that informs the spreadsheet, the range of cells to calculate and the result is to be displayed in the selected cells.
A range is a group of adjacent cells that forms a rectangular block.
To enter the formula in a cell:
- First, type your data on which you want to perform calculation. Say we have to calculate sum of numbers between 1 and5. Just enter the numbers in A1 to A5 cells.
- Then, select an empty cell where you want the result to appear.
- Type “=” symbol in the formula bar and type =A1+A2+A3+A4+A5 and press the Enter Key.
- The result will be the sum of these numbers.
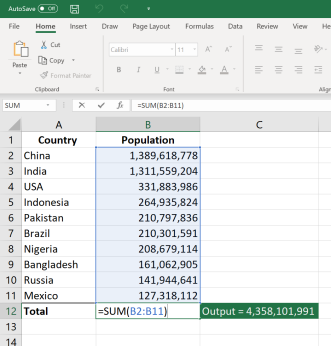
Now, suppose there is a larger set of numbers where typing the cell address and putting the operation again and again is not possible in this case there is another method to perform the operation:
- First, type your data on which you want to perform calculation. Say we have to calculate sum of numbers between 1 and 20. Just enter the numbers in A1 to A20 cells.
- Then, select an empty cell where you want the result to appear.
- Type “=” symbol in the formula bar and type =Sum (A1:A20) and press Enter Key.
- The result will be the sum of these numbers.
This is the inbuilt function in the formula bar which has a predefined meaning for the computer and it carries out that specific function on its own as soon as he gets the instructions.
Functions are built-in formulas to perform calculations through some specific values, seeded in a particular order.
Arguments: Numbers, text, logical values such as True or False, error values such as #N/A, or cell references all are arguments.
Structure: The layout of a function is a structure which contains function name, an opening bracket, the argument for the function separated by commas, and a closing bracket.
In MS Excel, you can perform various functions which are divided into several categories according to the purpose they serve e.g. Mathematical, Logical, Data and Time, Database String, Statistical Functions etc. You can find them all in the formula tab. Common functions includes:
- Mathematical Function
SUM – Adds all the numbers in a range of cells.
=SUM (Number1, Number2 ...)
MOD – When a number is divided by a divisor this function returns the remainder as a result.
=MOD (Number, Divisor)
ROUND – Rounds a number to a specified number of digits.
=ROUND (Number, Num-digits)
SQRT – Returns a positive Square root of a number.
=SQRT (Number)
FACT – Returns the factorial of a number.
=FACT (Number)
II. Logical Function
AND– Returns TRUE if all its arguments are true and returns FALSE if any argument is false.
=AND (Logical1, Logical2…)
FALSE – Returns the Logical value FALSE.
=FALSE ( )
TRUE – Returns TRUE as the Logical Value.
=TRUE ( )
IF – If the condition you specify is TRUE it returns one value and if the condition is FALSE it returns another value.
=IF (Logical-Test, Value-if-True, Value-if-False)
NOT – Reverses the logic of its argument; returns FALSE for a TRUE argument and TRUE for a FALSE argument.
= NOT (Logical)
OR – Returns TRUE if an argument is TRUE; returns FALSE if all arguments are FALSE.
=OR (Logical1, Logical2…)
III. Date and Time Function
DATE – Returns the number that represents the date.
=DATE (Year, Month, Day)
DAY – Returns the day of the month corresponding to a number that represents date.
=DAY (Serial-number)
TIME – A particular time is displayed.
=TIME (Hours, Minutes, Seconds)
YEAR – Returns the year and integer in the range 1900-9999 corresponding to a number that represents a date.
=YEAR (Serial-number)
IV. String Function
LOWER – Converts all upper case letters in a text string to lowercase.
=LOWER (Text)
UPPER – Converts text to Upper case.
=UPPER (Text)
REPLACE – Changes the part of a text string with some other text string.
=REPLACE (Old-text, Start-num, num-chars, new-text)
RIGHT – Returns the right most characters from a text string.
=RIGHT (Text, Num-chars)
LEFT – Returns the left most characters from a text string.
=LEFT (Text, Num-chars)
LEN – Finds the length of a string.
=LEN (Text)
TRIM – Removes all spaces from a text string except for single spaces between words.
=TRIM (Text)
V. Statistical Function
MAX – Returns the maximum value in a list of arguments.
=MAX (number1, number2…)
MIN – Returns the smallest value in a list of arguments.
=MIN (number1, number2…)
AVERAGE – Returns the average of a number of arguments.
=AVERAGE (number1, number2…)
COUNT – Counts how many numbers are there in the list.
=COUNT (Val1, Val2…)
VI. Database Function
DAVERAGE – Returns the average of selected database entries that matches conditions you specify.
=DAVERAGE (database, field, criteria)
DMAX – Returns the maximum value from the selected database entries that match the conditions you specify.
=DMAX (database, field, criteria)
DMIN – Returns the smallest number from the selected database entries that match the conditions you specify.
=DMIN (database, field, criteria)
DSUM – Adds the number in field (column) of records in the database that match the criteria.
=DSUM (database, field, criteria)
Creating Charts
Charts are visually appealing and make it easy for users to make comparisons, patterns and trends in data. Instead of analyzing several columns of numbers, you can simply look at a chart or figure and can tell whether your quarterly sales are increasing or decreasing or how the actual sales are performing in comparison to the projected sales.
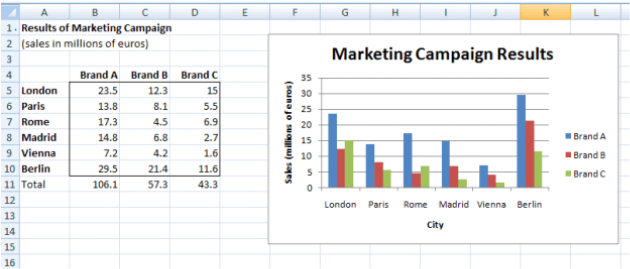
Creating Chart
The steps to create a chart in MS Excel are-
- Select the cells that contain the data that you want to appear in the chart.
- Go to Insert Menu click on the chart options. A long list of charts will appear in front of you with several sub-types, select the most appropriate chart that suits the best for your data type and click on it.
- The chart you selected will appear on your screen with values and legends that you can fully customize as per your needs.
- There would be various options available to change the size, color, design, switch data, change chart type, change fonts etc. for the chart you have created and you can thus choose among them which suits best for you.
Chart types
There are multiple types and shapes of charts available in MS Excel and it’s solely up to the user as to how he wants to represent his data in facts and figures. Column, Line, Pie, Bar, Area, XY (Scatter), Stock, Surface, Doughnut, Bubble, and Radar are various types of charts available in MS Excel. It is however also possible to change the type of chart any time after it has been created.
SN. | Chart Type | Pictorial Representation |
1. | Column Chart: In order to displaythe categories along the horizontal axis and values along the vertical axis this chart is used. | 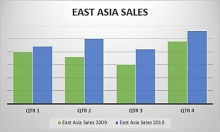 |
2. | Line Chart: In this chart data is distributed evenly along the horizontal axis and vertical axis. These are ideal to show trends in a data at certain equal intervals, like months or quarters. | 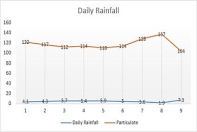 |
3. | Pie Chart: It proportionally divides individual data within total of data set and helps to understand the weightage of each data in the data set. The data in a pie chart are presented as percentage of whole pie(360 degree). | 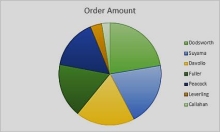 |
4. | Doughnut Chart: Just as pie chart, doughnut chart also presents the relation of a particular data to whole data, but it contains more than one series of data. | 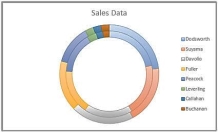 |
5. | Bar Chart: This chart presents a comparative view of individual data. In a bar chart, categories are available on vertical axis, and values on horizontal axis. | 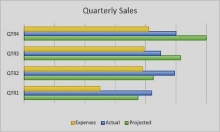 |
6. | Area Chart: These charts shows changes in the total data value within a particular period of time. It represents the relationship between data by also presenting the sum of all the plotted values. | 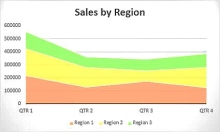
|
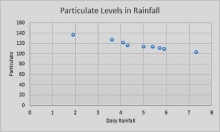
7. | Scatter X Y Chart: This chart marks the values of x on horizontal axis and the values of y on vertical axis (or vice versa).The values of x and y is combined within single data points and are plotted at irregular intervals. These charts are mostly used for presenting and comparing scientific, statistical, and engineering data. |
 |
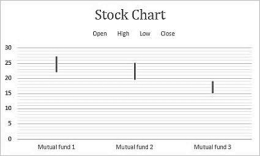
8. | Stock Chart: These charts are mostly used to represent fluctuations in stock prices but can also be used to present fluctuations in data like daily rainfall etc.
|  |
9. | Surface Chart: In order to find the optimum combinations between two series of data this chart is used. Colors and patterns are used to indicate the areas with same range of values. | 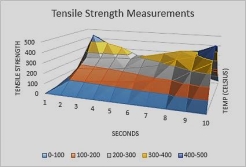 |
10. | Radar Chart: These charts are used to compare the aggregate values of multiple data. | 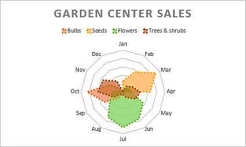 |
Renaming and copying Worksheets
As we already know that the worksheet is the collection of rows and columns which appears in front of us as we load MS Excel. We can perform the following operations on worksheet tabs also a user just have to right click over the worksheet name located at the left bottom to get the following operations menu.
Insert: To Insert new worksheets in the same workbook. Delete: To delete the current selected workbook. Rename: To give the workbook some other name than the default Sheet1 name. Move or copy: To move i.e. remove permanently from this workbook and take it to some other workbook and copy i.e. make a carbon copy of this worksheet either in the same workbook or to some other workbook. Protect Sheet: To protect the sheet from unauthorized data access. Tab Color: To show a different color on the name tab. Hide: To Hide the tab from the workbook which can only be seen after selecting the unhide option. Select All: To select all the worksheets in the workbook at once for performing various operations. | 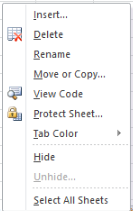 |
Steps to Rename a Worksheet
- In order to rename the worksheet, user has to go to the left bottom of the MS Excel window where name of the worksheets are written also known as sheet tab.
- Right click on the sheet of whose name you want to change.
- From the list of options that appeared on right click select the Rename option.
- This option will give you access to type the name of your choice, the sheet names are limited to 31 characters, it cannot be left blank and has to be unique than any other sheet names in the same workbook.
- Just type the name and click Enter and your sheet name will be changed.
Steps to Copy or Move a Worksheet
|  |
| |
|
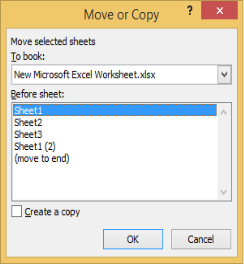
- This option will show you the above action box. You can either move or copy.
- To move the sheet select the sheet you want to move and from the “To Book” option select the workbook into which you want to move this sheet. It is necessary that the workbook where you want this sheet to move must be opened in the background then only it will appear in the To book options.
- To copy the sheet repeat the same step as move but before clicking the OK button also check the Create a copy checkbox.
- On clicking OK button your worksheet will be moved or copied to the desired workbook you have selected.
Using Tools
Most of the tools such as Spelling & Grammar, Reserch, Thesaurus, WordCount, Translate, Language, Restrict Editing, Macro, Track Changes are similar to that of MS Word. There are certain tools which are only available in MS Excel which includes:
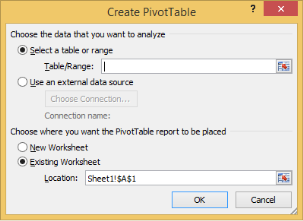
- Pivot Table: A pivot table is a summary of your data, which lets you group your data together in different ways so you can draw helpful conclusions and explore trends based on your information. You can easily compare the data that have long rows or columns using Pivot table."Pivot" means that you can reorganize the data in the table in order to view it from a different perspective.
You can access pivot table from Insert menu, just click on Pivot table a dialogue box will appear asking for the source of data and the path to show the calculated result as shown in the below image.
- Vlookup:It stands for 'Vertical Lookup' because the formula takes a value and searches for it vertically down a specific column. It is a function that makes Excel search for certain data that you specified based on a commoncolumnavailable in both sheets.There are four parts that you will need in order to build the VLOOKUP formula:
- The value you want to look up, also called the lookup value.
- The range within which the lookup value will be located. In order to make VLOOKUP work correctly always keep the lookup value in the first column of the range.
- The column number in the range that contains the return value.
- You can put“TRUE”for an approximate match or “FALSE” for an exact match with the return value. In absence of this information, the default value taken will always be TRUE.
Now if we put all of the above together we get:
=VLOOKUP(lookup value, range containing the lookup value, the column number in the range containing the return value, Approximate match (TRUE) or Exact match (FALSE))
- Freeze/Unfreeze Panes: The Excel Freeze Panes tool helps a user to lock the column and/or row headings so that, if you scroll down or over to see the rest of your sheet, the first column and/or top row will always remain on the screen. You can achieve this by selecting one line below the heading you want to freeze and then go to View option and select Freeze Panes.
You can either select Freeze Top row, Freeze First Column or Freeze Pane of your choice.
- Sort and Filter: While working on a large data set tables a user wants to sort or filter its data based on various criteria. To achieve this Filter and Sort optionsare used. The filter tool gives you the ability to filter a column of data within a table on placing some logical conditions on this data and the sorting tool allows you to sort by date, number, alphabetic order, lowest to smallest, vice versa and more. You can find this tool in Data Tab of MS Excel.
- Conditional Formatting: It is a feature that allows you to apply specific formatting to cells that meet certain criteria. This is a color-based tool used tohighlight or differentiate the data ofyour spreadsheet. You can apply rules and conditions to highlight the data this may include greate than, less than, equal to, duplicate values, less than certain percentage etc. This feature is readily available at the home tab. Just select your data and apply one of these formatting.
- Remove Duplicates:This feature, permanently removes the duplicate data in your selection. Just select the range of cells that has duplicate values you want to remove and go to data tab to select this option.
Page Setup and Print Preview
The page setup and print preview options in MS Excel is almost similar to that of MS Word you can find all the options in MS Word topic.
Communication is the most effective means of establishing a rapport or a conversation with the target audience. MS PowerPoint is a highly productive tool used to present information in an eye catching slide show format. A slide is an electronic way of presenting your content while slideshow is an electronic presentation, which presents these slides in a beautiful synchronised manner on a computer screen or a projection device.
In starting the default file formats of PowerPoint Presentation was .ppt and for PowerPoint Slide Show was .pps later in MS PowerPoint 2007 version these file formats were changed to .pptx for PowerPoint Presentation and .ppsx for PowerPoint Slide Show.
Delivering a presentation effectively involves a four-step process:
- Plan: Identify your target audience and define the purpose of your presentation.
- Prepare: Prepare the structure and timing of your presentation as per your needs.
- Practice: Review, rehearse and take feedback on your presentation. This builds an enthusiasm and confidence to present your content.
- Present: Build a link with the audience in order to keep their undivided attention and push your message in their mind.
Microsoft PowerPoint can be used for a wide variety of purpose some to these are−
- For teachers usage a PowerPoint can make the boring lectures interesting and attractive and a teacher can easily pitch the key learning’s of a lesson to its students with the help of PowerPoint Presentations.
- In business meetings a user can use PowerPoint to create and show his plans, structure, marketing strategies and can even present facts and figures in a more comparative and understandable manner to others using images, circle, diagram or even charts.
- Children and Students can use PowerPoint to present their school projects and assignments and share it with other students so that everyone learns in a more unique way.
- To make long tutorials or orientations and other long listed things more easy and understandable.
- To prepare a digital slideshow of your favourite photos and present them to someone on special occasions or keep one for your memories.
MS PowerPoint Application Contents:
MS PowerPoint also shares almost the same application window as that of MS Word and MS Excel with many similar options such as, quick access toolbar, ribbon, scroll bars, zoom control etc. Thus, we will only cover the unique features and options of MS PowerPoint in this part.
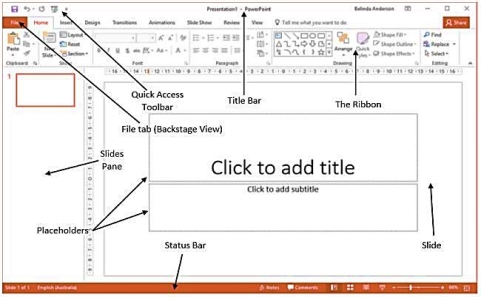
Slide: Each individual screen in a slide show is termed as a slide. It is a single page of the presentation which we see when we load a presentation.
Slides Pane: This lays at the left most part of the screen and is a small thumbnail preview of all the slides you have in your slideshow. A user can perform multiple options on a single slide from this side pane only.
Slide Show: The display of all the slides in a sequence is termed as a slide show. You can operate the slide show manually or change the settings for the slides to be displayed automatically.
Placeholders: These components are displayed as dotted lines and helps use to identify where he can add text, and insert elements such as images or tables.
Transition: The effects used at the starting and ending of a slide during a slide show.
Object: These are components such as images, clip art, text, charts, sound, video clips etc. used in slides to make your slide show more appealing and attractive.
Slide Layout: Placeholders are available on a slide to help you position your objects and layout defines the positioning of these placeholders. The layout is a way of how the objects will be arranged in a slide.
Menu Bar: The Menu bar is directly below the Title bar and displays several tabs just like it was in MS Word and we can use each tab to perform specified functions in MS PowerPoint too. Some tabs (Home, Insert, Review and View) mostly have the common features as that of MS Word so we will discuss only about the uncommon tabs here:
Design Tab: In order to apply a design or to make changes to the slide size, slide background, and other design attributes in a PowerPoint presentation this design tab is used. It includes options for Page Setup, Themes, Colors, Fonts, Background Styles and graphics etc.

Transitions Tab:Transitions are basically effects occurring in a Slide Show when you move from one slide to the other. A user can easily control the speed, add sound, and can customize the transition effects with this tab.

Animations Tab:This tab contains certain tools to animate text and object such as clip art, shapes and pictures. You can even create transitions between slides. These movements are used to draw the audience's attention to a specific content or to make the slide easier to read.

Slideshow Tab: Once your slideshow is made you need tools to control your slide show to present it in front of others this tab provides such options so that you can present the Slide Show to the audience. Narration for the show can be recorded. Decisions can be made as to where to start the presentation. In addition, custom shows can be created using this tab.

Features of MS PowerPoint:
- Creating Project Reports with PowerPoint
- Create Custom Slides
- Formatting and editing slide text
- Customize Color Schemes
- Add Animation effects
- Designing the page
- Use the Slide, Notes and Handout Masters
- Create, Edit and Import Charts
- Usage of Objects such as (Images, ClipArt’s, Shapes, Screenshots etc.)
- Create and Edit Tables
- Manage Hyperlinks
- Viewing Slide Page
- Page Setup features for better Prints
- Print Preview before printing the pages
- Export Outlines & Presentation Slides to Word
Let us now discuss some of these features and learn how to perform them in detail-
Creating Project Report
Project report is an essential tool available with management for proper monitoring of operations and problem recognition. Through project reports one is able to estimate the cost of operations, make projections for estimated profits, can take decisions whether to accept or reject a project.
There are many templates available in MS PowerPoint to help you create a project report in a much easier and faster manner. But the most important task is to answer the basic questions such as the purpose of the report you want to create, the audience you want to target with this report, the contents of the report etc.
Thus, we can break these questions into two basic parts i.e. Planning, and Preparing.
Planning: A well layout planning will not only help you achieve the desired outcomes but will also keep you on the right track of creating the report. One must not deviate from the main theme of the report and that is ensured through a proper planning.
.Thus, we can say that planning a project report involves:
- Determining the objectives
- Collecting the required materials ( facts)
- Studying and examining the facts gathered
- Planning the facts for the report
- Preparing a draft outline for the report
- Editing and finalizing the draft report
Once you have a proper plan you are ready to enter your report into MS PowerPoint.
Preparing: This step involves entering your finalized draft report into MS PowerPoint slides and preparing it for the audience. This step is also important as you are going to create the finalized digital form of report which will be presented to others. There are basically two options to enter your data in MS PowerPoint:
- Start with a blank slide
- Use default template for such reports.
Suppose the user takes the templates option, it becomes easier and time saving for him as it has the entire formatting and color scheme by default which makes the report more attractive, otherwise the user has to set all these options by himself which is a very tiring process. A project report has the following contents and data must be entered into the following similar format:
- Title: Denotes the title of the project and the author’s name. It also mentions the name and detail of industry for which the project is undertaken.
- Abstract: A brief summary giving details about the contents of a project report. Abstract is not very long it is a short summary usually ends in a half page.
- Acknowledgements: Denotes the individuals who assisted you during your project work.
- Contents Page: It tells about the main chapters and sub-sections included in the report along with the page numbers telling where the particular chapter/section begins and end.
- Introduction: This part summarizes what the author set out to attain, gives a clear description regarding the background of the project, main contributions, and relevance.
- Background: It describes the plans to achieve the projected goals and present different options that can be evaluated in order to choose the most efficient one.
- Body of Report: The central part of project report which contains three to four chapters which describes all technical work undertaken for the completion of project.
- Conclusions: This part of report concludes the success and failures of a project. It also provides suggestions for future work of project.
- Bibliography: It includes information (usually creator and publishers name) regarding those books, articles, journals, manuals etc. that has been taken as references in order to complete this particular project report.
- Appendix: Things included here are program listings, graphs, proofs, tables or any other thing that has been used as a context in your report.
You can also add some animations to your slides through Transitions and Animations Tab so that your project report becomes visually appealing to the audience.
Creating Slides
When a person open MS PowerPoint there are no slides in it but you can easily add slides to the presentation by going to New Slide option available under Home tab. There are multiple methods available to create new slides, and each one is best suited for a particular situation. The most straightforward way to create a new slide is with the New Slide command available at home tab or Ctrl + N command.
Here we will discuss the other options available to create a new slide, depending on personal preference and usage.
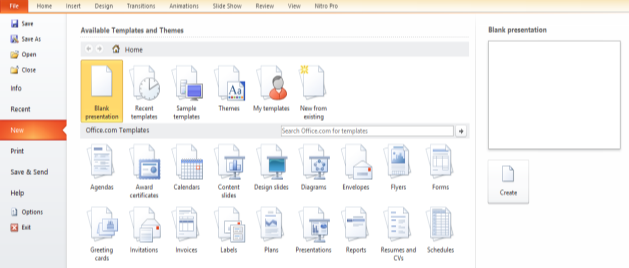
A user can perform the following steps in order to create a new slideshow in MS PowerPoint:
- Open MS PowerPoint and Click on the “New Option” from file tab of Menu bar.
- A long list of available options will appear in front of you as shown in the picture; on the right hand you can easily see the preview of each type of options available.
- These options include:
Blank Presentation – It’s a simple blank workbook which can be used to simply type your data and customize the whole workbook as per your needs from the scratch. You can also create this type of workbook by simply pressing the Ctrl + N keys on your keyboard in MS Excel Application anytime.
Recent templates – If you have earlier been working on certain templates and now wishes to re-open on previous ones then you can choose this option, it will lead you to a list of some recent templates you have been using so that you can choose them again.
Sample Templates – There are a lot of pre customized templates option available to choose from. This makes your data more sorted and is a time savvy option. These templates have everything pre-defined within them as to which font to choose, which color to use, how much cell margin to set, etc. and are pretty customizable too.
Themes – There are a lot of pre customized templates option available to choose from. This makes your data more sorted and is a time savvy option. These templates have everything pre-defined within them as to which font to choose, which color to use, how much cell margin to set, etc. and are pretty customizable too.
My templates – A user can however choose from available templates in MS Excel or can also create its own new template, where all the options will be as per his choice and preferences. This newly created template can also be saved and can be reused whenever the user wants to.
New File from an existing file – This option simply gives user liberty to open an existing MS Excel file and edit and create a new file with that old existing file.
- From these available options simply select whichever option best suits your need and after selecting click on create button available at the bottom of the right hand preview screen.
- A new window will open with the type of file option a user has selected.
- If a user wants to insert a new slide he can do so by selecting New Slide option available under home tab.
- You can also change the Slide Layout i.e., how information is presented on the slide by going to the Home Tab and clicking on Layout option and select the design which best suit your needs.
- A user can then enter text into the slides by clicking and typing in the box titled “Click to Add Text” or “Click to Add Title.”
- One can also add Tables, Smart Art, Pictures, Charts, ClipArt’s and other media content by clicking on the box that says “Click to add content” and selecting from one of the options available.
Animations
Animations are used to make your presentation more dynamic and memorable, but too much animation can distract your viewers from the main point that you are expressing. One can also use sound effects with your animation so that your presentation becomes more visually appealing.
There are basically two options to achieve this task first is Transition Tab and another is Animation Tab. Transitions are motion effects basically used in slides while switching from one slide to the other while animations are effects used for objects (text, images etc.) placed within your current slide.
One can easily apply and see the preview of the animation or transition you have used in the slides and objects. You can use the same animation effects for all the slides or give each slide its own animation effect by choosing the desired options available.
Common steps to apply Transition Effects on your slides are:
- Select the slide on which you want to apply transition effect.
- From the Transitions tab, click on transition effects available. You can also click the Preview option to see how the effect is appearing on the screen.
- There are other options available within Transition tab, such as effects option to change direction or color of transition, Sound option to insert sound while changing slides, Duration option to change duration for which the transition is played, Transition on mouse click to play transition on click of the mouse only etc.
- The user can select these options as per his preference and once these options are selected they will be applied to your slide show. You can also select the option “Apply to All” in order to apply the same selected effects in all the slides.
Common steps to apply Animation effects on Selected Objects are:
- Insert an object from the insert tab say picture to the slide.
- Select the picture on which you want to apply animation.
- From the Animations tab, click an animation effects available. You can also click the Preview option to see how the effect is appearing on the screen.
- There are other options available within Animation tab, such as effects option to change direction or color of transition, Animation Pane to show the sequence of when and how animations are executed, Sound option to insert sound while playing animations, Duration option to change duration for which the animation is played, Animation on mouse click to play transition on click of the mouse only etc.
- The user can select these options as per his preference and once these options are selected they will be applied to the objects you have selected in your slide show. You can also select the option “Apply to All” in order to apply the same selected effects to all the objects within the slides.
Page Designing
The Design Tab in MS PowerPoint offers its users with a variety of slide designing options to choose from. One can change the appearance of his slides and make it more attractive by choosing multiple designing options available under design tab.
These options includes:
Page Setup: This option is used to provide better viewing and printing options for your slides. Whenever a user creates a slide it is by default created in Landscape mode with default margins so that it can be easily created and played on computer screen but a user has options to change the slide size (width and height) and screen orientation option for slides, notes, handouts and outlines.
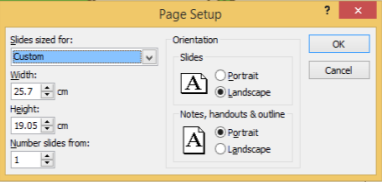
Themes: These are predefined templates to change the overall design, look and feel of the presentations. In themes, there is a predefined set of colors, fonts, and visual effects that you can apply to your slides to create faster and professional looking presentations. You can easily apply, choose or switch to different themes from design tab of MS PowerPoint. These themes are fully customizable you can choose the option to change the overall color, font or effects for the slides as per your choice within themes also.
A user can also import someone else’s theme to their presentation by selecting the browse for themes option and can also save his current customised theme for later usage.

Background Styles: A user also has access to the background colour of their whole presentation slides. You can change the colour, add gradients, give artistic effects, add any picture to the background, take background from default available graphics or customize the available one’s all upto your choice.
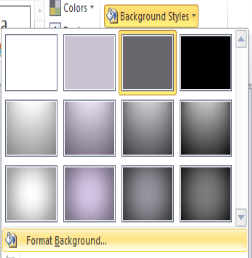
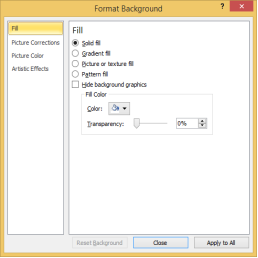
Inserting Objects in Slides
Adding objects (table, images, cliparts, smartarts, charts etc.) to your presentation makes the information more valuable and a lot more interesting for an audience. These objects not only add visual information to your presentation, they also give your audience a necessary break from looking at big blocks of text. They make a presentation appealing to an eye.
A user can add objects into its slide with the following steps:
- Select the slide where you want your object.
- Click on Insert tab and Select the object that you want to insert. There are multiple choices available such as, Tables, Pictures, ClipArts, Screenshots, Photo Album, Shapes, SmartArt, Charts, Hyperlink, Text Box, Header, Footer, WordArt, Slide Number, Object, Equation, Symbols, Video and Audio.
- Say a user selected Picture option to insert an image into its Presentation, an Insert Picture box will appear that will ask the user for the location of the image, just select your desired image and click on ok. The image will be inserted in your slide.
- After inserting the image a new tab to format picture will appear when you click on the image you inserted. In this tab multiple options to format your picture and make it more compelling can be found such as, color correction, brightness, compress picture, change picture, reset picture, picture styles, borders, layout, cropping, resizing etc.
- The user can choose the options he want to perform on the picture and make it more suitable for his slides.

View Page
This tab helps a user to view the created slides in many different ways; one can also view more than one PowerPoint window at the same time. There are multiple options to customize the contents displayed on the screen such as, one can hide or unhide the ruler, gridlines, navigation pane from the current window. Some of the common options in view page includes:
Outline View:Click this button to view the presentation as an outline. It will replace the slides pane with a full flashed view of only text from your slides.
Slide Sorter: To view the slides as thumbnails, click this button. The slides will appear in columns and rows. This format makes it easy to rearrange the slides.
Notes Page: The slides appear at the top of the page and the notes that have been entered for the presentation will show at the bottom of the page.
Reading View: This option is used to view your slides as a slide show in full screenwindow so that it becomes easier to read.
Slide Master: Click this button to change the design and layout of the slide masters. These masters are the ones that each slide in the presentation is based on. The changes affect what is displayed on all the slides with that layout in the presentation.
Slide Show: This starts the slide show of your prepared slides.
Handout Master: To change the design and layout of the printed handouts for a presentation, click this button.
Notes Master: This optiondisplays your slides asa notes page which can easily be printed.
Ruler:There is a checkbox next to this option which lets a user to hide or unhide the ruler from the application window of MS PowerPoint. There are two rulers one is horizontal ruler on top and another is a vertical ruler on the left.
Gridlines: Click the check box for this option to display gridlines in a presentation. The gridlines helps in the alignment of objects ontoyour slides.
Notes:This button is used to add notes to your presentation whichhelps youin quick references while presenting your slide show.
Fit to Windows:This button is used to zoom the presentation so that the slide fills the window.
Color/Grayscale: To view the presentation in color, choose color option.Grayscale button displays the presentation in black and white mode with some gray tones. Black and White option shows presentation in black and white mode without any gray tones.
Page Setup and Print Preview
The page setup and print preview options in MS PowerPoint is almost similar to that of MS Word you can find all the options in MS Word topic.
We can define “Accounting” as a process to record, summarize, analyse and report the financial transactions done to carry out business activities. The above described MS Office tools (MS Word, MS Excel and MS PowerPoint) can be of utmost importance to carry out these Accounting activities in a much more smoother and accurate manner. We will discuss certain examples to perform various accounting tasks using MS Office Tools:
Preparation of Invoices and Vouchers:
Invoice is basically a complete bill that you receive when you purchase goods and/or services from an outside seller or vendor and includes a list of each item purchased with its description, quantity, price, tax details, and a contact address for payment.
Voucher is a document used by the company’s accounts payable department for internal processing of payments to the vendors or sellers on the basis of their Invoices. It is prepared after the confirmation of match in goods received with vendor’s invoice. A voucher may include the supplier name and unique internal number for identification, due amount, last date for payment, payment details, any discounts received, approver’s signature or stamp etc.
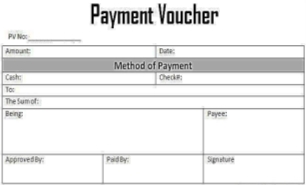
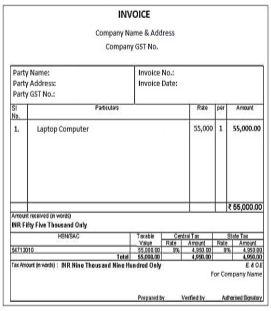
These vouchers and invoices can easily be prepared and stored in either MS Excel or MS Word and can be edited and reused whenever a user wants to. We are here using MS Word to create these with the following steps:
Step I: First make an outline of where and what details you want in your voucher or an invoice on a piece of paper or in your mind so that you can easily move step by step in shaping these as the way you want.
Step II: On a blank word document you can insert custom Table as per your requirement from Insert tab.
Step III: The size of rows and columns in a table can also be modified either by using rulers available on top and left side of MS Word application window or through the resize option which appears when you slide your mouse on edges of the table. Just drag the mouse to change the size of rows and columns.
Step IV: You can insert text by a single click within the table; there are options available to align your text as per your choice such as Left, Centre, Right and Justify.
Step V: You can enter the important information such as company name, final amount payable etc. in Bold, Italics or Underline font format.
Step VI: In order to combine two or more rows or columns together in a table you can use Merge Cells option after selecting the cells you want to merge.
Step VII: Once your voucher is prepared don’t forget to save it as a word file using the save as option available under file tab; you can give whatever name to your file you want. You can also print this document whenever you want to.
Preparation of Reports:
Report is an essential tool available with management for proper monitoring of operations and problem recognition. Through reports one is able to estimate the cost of operations, make projections for estimated profits, can take decisions whether to accept or reject a project. A report has the following basic contents and data must be entered into the following similar sequence:
- Title
- Abstract
- Acknowledgements
- Contents Page
- Introduction
- Background
- Body of Report
- Conclusions
- Bibliography
- Appendix
There are many templates available in MS PowerPoint to help you create your report in a much easier and faster manner. But the most important task is to plan the report structure, collect and examine the facts and draft a rough outline for the report.
Once you have prepared a draft outline you can easily prepare your report in either MS Word or MS PowerPoint which can be easily edited and reused whenever a user wants to. In order to create report we are using MS PowerPoint here the steps to do so are:
Step I:In MS PowerPoint, go to File tab and open a new blank slide. On this new slide select an appropriate theme of your choice from themes option available under Design Tab.
Step II: Once the design of your report is selected you can now move forward and enter the text and images for your report in appropriate sequence. In order to enter text and objects you can use Layouts option and Insert tab options. In order to add text you can also use text boxes and can resize and move them too.
Step III: Always remember that a presentation should be in summarized form avoid inserting too much text and keep it short to maintain the audience attention.
Step IV: One can also use animations and transitions effects to add to their slides and objects so that users remain entertained during the entire presentation and your main objective of the report is easily conveyed to them.
Step V: At the end of your report’s presentation never forget to ask feedbacks and questions regarding your report so that if someone has any doubts it can be cleared and you can also get fresh new ideas regarding your task for which report was created.
Calculation of Interest, Depreciation, TDS, Salary, Taxes and Inventory
Interest: Interest is a fee charged/levied by the lenderon the principle amount from the amount borrower. The borrower takes a certain amount of money from the lender and promises to pay back the whole amount within a fixed tenure (say 2 yrs.) on the terms of paying a fixed annual interest (say 10% of actual amount).
Interest Formula: Principle Amount x Loan Tenure (Total Loan Months/Months in a year) x Rate%
Depreciation: When an asset (say machinery or equipment) is used on a regular basis its monetary value decreases over time due to normal wear and tear thus a fixed percentage is charged from its actual value over its useful life.
Depreciation Formula: Total Cost of Asset x Depreciation %
TDS: Tax Deducted at Source is a tax system where if a person makes a specific type of payment to other person or business then it is mandatory for him to deduct tax from this payment at some prescribed rates (notified by Income Tax Department) and deposit in the government's account.
TDS Formula: Total Value x TDS Rate% (as per TDS rate slab)
Salary: Payment made to the employee by an employer for specified task performed by the employee stated in the employment terms or contract. The employment contract includes the rate of the work, the time of the work and the work description on the basis of which payment is made. Salary is dependent on days or hours worked by the employee.
Salary Formula: (Monthly Salary/Days in particular month) x No. Of Present Days
Taxes: In order to run the country and perform specific tasks for the benefit of its residents the government needs certain amount which is collected by the source of taxes. These taxes are collected from eligible citizens or businesses only. There are basically two categories of taxes direct (tax on direct income) and indirect taxes (tax on indirect income).
Income Tax Formula: Gross Taxable Income x Tax Rate (as per income tax slab)
Inventory: All those goods and materials that a company keep with itself in order to produce or to sell to its customers. These inventories require a place such as storage unit to store them and safeguard them from thefts, fire, weather conditions, spoilage and breakage.
Inventory Formula: Individual Item x Quantity x Rate per Item
Any person who has basic knowledge of such concepts can easily use these formulas in MS Excel and can perform such difficult calculations very easily. In order to use these formulas the following steps can be performed:
Step I: In MS Excel, go to File tab and open a new blank workbook. On this new workbook create different worksheet with the name of above operations.
Step II: Now go to individual sheets and enter the operation name, their data and the respective formula to calculate them as shown in pictures below. One can also use the Font Styles (such as bold), Merge Cell option, Alignment option and Table Border options so as to make the look of these formulas more readable and presentable.
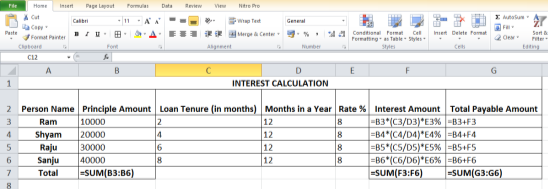
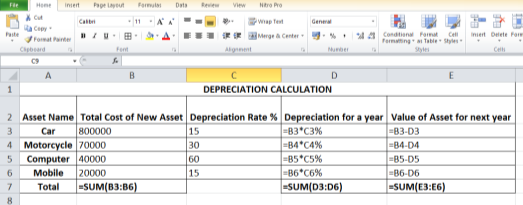
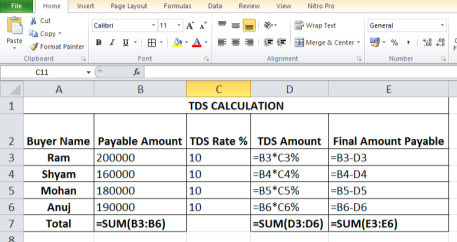
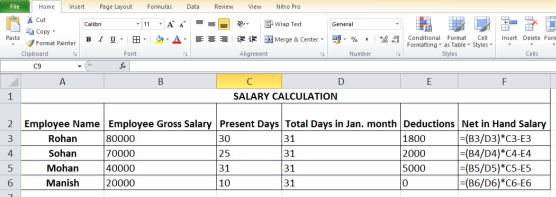
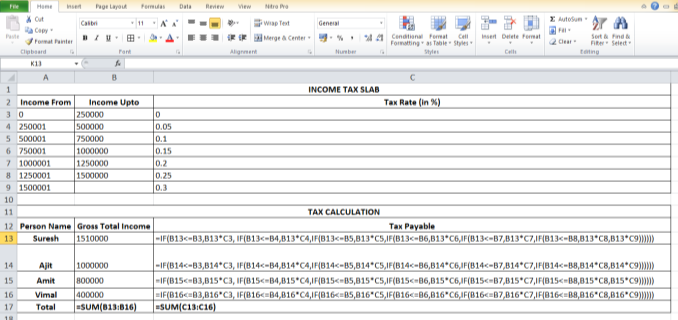
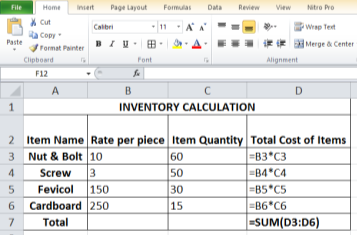
Step III: These calculations are easy to perform and can be saved for future references in a file. You can always change the data of these files and can use them as you want.
Reconciliation
When a company enters into business with other company on a regular basis then both the companies maintains record of transactions in their own books. Reconciliation is the process of matching the books of one company with the books of the other so that in case of any discrepancy it can be reported and sorted in timely manner.
To reconcile the data one can use MS Excel and import the both the statements into two worksheets and then they can easily reconcile this data using VLook up option one has to match the Debit and Credit sides in both the books.
To use VLook up first check which one is the common data in both the sheets, here we can take the Invoice No. As common data in both sheets. Then we can use the VLook up formula which is:
=VLook up(Select common data Row, Select rows which you want to retrieve from other sheet including common data row, Number of the row which you want to show here, return value true or false if not found)
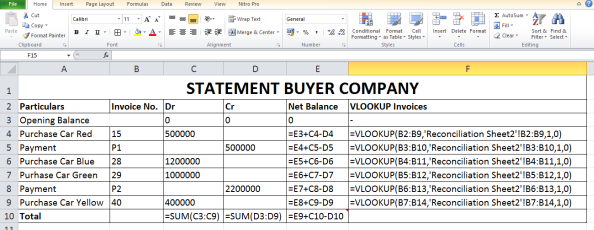
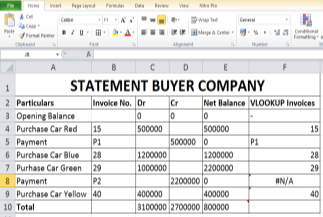
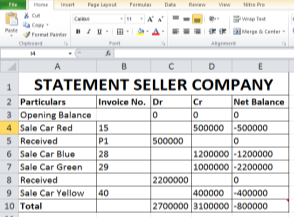
In above example, we have statements of buyer and seller and in these statements we have used VLookup formula on the basis of common invoices in Row – B. Here we want to match that whether all the buyer invoices have been booked by the Seller company or not.
So, we will use VLookup formula in buyer’s statement by first selecting the common Row B2 to B9 (Invoice No.), then selecting all the data from seller’s statement by using cell reference and selecting the same rows B2 to B9. After which we will give the command to let Excel know which row it has to retrieve, we have taken 1 (Row – B) i.e. the first row of our selection which itself is invoice no. And then we will give command to return true - 1 (approximate match) or false – 0 (exact match).
In return we will get all the invoices which are matching with buyers and sellers recorded invoices. Here, we can note that the Seller missed to include the “P2” named invoice no. Due to which error (N/A) appeared in the cell which means this invoice has not been matched with the seller’s statement.
Thus, using VLookup it becomes easy to track such differences/mistakes and do the reconciliation of two or more statements with much ease.
Reference Books:
- Bittu Kumar― “Mastering MS Office”, V & S Publishers.
- Pradeep K. Sinha, PritiSinha― “Computer Fundamentals”―BPB Publications Sixth Edition.
- Prof. Satish Jain, M. Geetha, Kratika―”Microsoft Office 2010” BPB Publications
- Joan Lambert, Curtis Frye― “Microsoft Office 2016 Step by Step”, Microsoft Press
- Ken Bluttman – “Microsoft Excel Formulas & Functions”, For Dummies; 5th Edition