UNIT III
Managerial Decision Making
Managerial Decision Making
Overview
Decision making is a cognitive process that results in choosing a course of action from several alternative scenarios.
Decision making may be a daily activity for any person . There are no exceptions to that. When it comes to business organizations, decision making is both a habit and a process.
Effective and successful decisions bring benefits, and unsuccessful decisions cause losses. Therefore, corporate decision making is the most important process in any organization.
The decision-making process chooses one course of action from several possible options. In the process of deciding, we may use many tools, techniques, and perceptions.
In addition, we may make our own personal decisions, or we may prefer collective decisions.
Decision making is usually difficult. Most corporate decisions involve some dissatisfaction and conflict with other parties.
Let's take a better check out the decision-making process.
Decision process
The following are important steps within the decision-making process. Each step may be supported by a variety of tools and techniques.
Step 1-Identify the purpose of the decision
In this step, you will thoroughly analyze the problem. There are some questions to ask when identifying the purpose of a decision.
- What exactly is the problem?
- Why do you need to solve the problem?
- Who is the affected party of the problem?
- Does the matter have a deadline or a selected timeline?
Step 2-Gather information
There are many stakeholders in organizational issues. In addition, there are dozens of factors that are relevant and affected.
In the process of resolving a problem, you need to collect as much information as possible about the factors involved in the problem and the stakeholders. Tools such as "check sheets" can be effectively used in the information gathering process.
Step 3-Principles for determining alternatives
In this step, you need to set a baseline criterion to determine the alternative. Organizational goals and corporate culture must be taken into account when defining the criteria.
As an example, profit is one of the main concerns in all decision-making processes. Except in exceptional cases, companies usually do not make decisions to reduce profits. Similarly, you need to identify baseline principles in relation to the issue at hand.
Step 4-Brainstorm and analyze your choices
Brainstorming is the best option for this step to list all your ideas. Before you come up with an idea, it's important to understand the cause of the problem and prioritize the cause.
For this, you can use the causality chart and Pareto chart tools. The cause and effect diagram helps identify all possible causes of the problem, and the Pareto chart helps you prioritize and identify the most influential causes.
You can then move on to generating all possible solutions (alternatives) to your problem.
Step 5-Evaluate alternatives
Evaluate each option using judgment principles and decision-making criteria. Experience and effectiveness of judgment principles work in this step. You need to compare the advantages and limits of each option.
Step 6-Choose the best option
This procedure is easy if you go from step 1 to step 5.
Step 7-Perform the decision
Transform your decision into a plan or series of activities. Execute the plan yourself or with the help of your subordinates.
Step 8-Evaluate the results
Evaluate the outcome of the decision. Learn to see if there are any future decisions that need to be corrected. This is one of the best practices to improve your decision-making skills.
Process and modeling in decision making
There are two basic models for decision-making-
Reasonable model
Normative model
A rational model is based on cognitive judgment and helps you choose the most logical and wise alternative. Examples of such models include decision matrix analysis, pew matrix analysis, SWOT analysis, Pareto analysis and decision tree, selection matrix, and so on.
A rational decision model performs the following steps-
- Identify the problem and
- Identify key criteria for processes and results
- Considering all possible solutions
- Calculate the results of all solutions; compare the probabilities of meeting the criteria,
- Choosing the best option.
The normative model of decision-making considers the constraints that may arise when making a decision, such as time, complexity, uncertainty, and lack of resources.
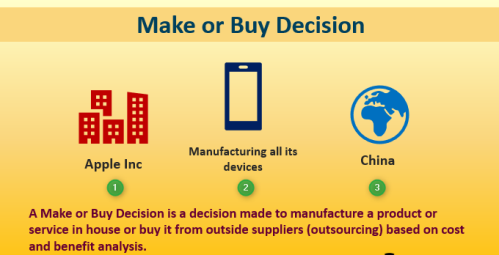
Manufacturing or purchasing decisions include whether the product is manufactured in-house or purchased from a third party. The results of this analysis should be the decision to maximize the long-term financial outcome of the enterprise.
Following are the components of above:
- Item cost
Which alternative has the lowest total out-of-pocket cost? Companies tend to include fixed costs when summing internal costs, which is incorrect. Editing internal costs for manufacturing a product in-house should include only direct costs. This amount should be compared to the supplier's quoted price.
2. Required capacity
Is the company capable enough to produce the product in-house? Or is the supplier reliable enough to produce the goods in sufficient quantity and in a timely manner?
3. Required expertise
Does the company have enough expertise to manufacture the goods in-house? In some cases, companies have a very high failure rate of their products, forcing them to outsource their work to suppliers.
4. Required funds
Does the company have enough cash to buy the equipment needed for in-house production? If the equipment is already in the field, can I outsource the work to sell the equipment and make the cash available elsewhere? This is a major concern for start-ups with little surplus funds available to invest in facilities.
5. Impact on company bottlenecks
Will shifting production to suppliers reduce the burden on the company's bottleneck operations? If so, this can be a good reason to buy the item.
6. Drop shipping availability
The supplier may offer to store the goods at the facility and ship them directly to the company's customers at the time of ordering. This approach can shift the burden of investing in inventory to the supplier and represent a significant reduction in working capital.
7. Strategic importance
How important is the product to your corporate strategy? If it is very important, it may make more sense to manufacture the product in order to remain in full control of it. This option is most likely to be adopted if the company has its own production technology that it does not want to share with its suppliers. Conversely, less important ones can be transferred to suppliers more easily.
8. Thoughts of farewell
At first, the manufacturing or purchasing analysis may appear to be a quantitative analysis that involves a simple comparison between the internal production cost and the supplier's quoted price. However, from the points mentioned above, it becomes clear that the manufacturing or purchasing decision actually involves a number of qualitative issues that could completely invalidate the numerical analysis of production costs.
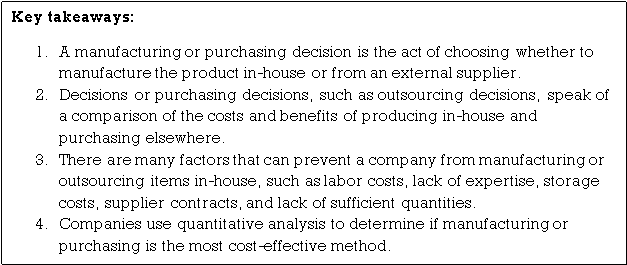

What is a sales mix?
A sales mix is a collection of all the products and services that a company offers. It takes into account the individual items that the company sells and the profit margin that each product earns. Each product may have a different rate of return, but the sales structure considers the combined rate of return for all items. By analyzing the sales composition, companies can determine which products they need to focus on and prioritize based on their earning power, demand, and resources needed to produce them.
Imagine you own a food truck. The menu includes four basic items: burgers, hot dogs, grilled cheese and French fries. Last month, he sold $ 10,000 from a food truck and earned $ 5,000. Overall, we are making a 50% profit. While excited about its rate of return, I think you can improve it by looking at each item separately and determining the product cost of each menu item.
Sales mix formula
To analyze your sales structure, you need to understand the cost and contribution of each item. For example, you need to know the cost of making a hamburger and compare it to the selling price of the hamburger. To evaluate this, let's look at two equations.
Selling price-Material cost = Profit
Profit / Sales Price = Profit Margin
Applying sales mix calculations
The hamburger example sells hamburgers for $ 6. Each of them costs $ 4 to create.
Selling price-Material cost = Profit
Selling price = $ 6
Material cost = $ 4
$ 6- $ 4 = $ 2
Profit / Sales Price = Profit Margin
Profit = $ 2
Selling price = $ 6
Profit margin = 33.3%
Analyzing the hamburger, we find that the rate of return is less than 50%. This is the profit margin of the sales composition of all the items sold. Therefore, it produces less from hamburgers than other items.
Let's take a look at another item, the grilled cheese sandwich.
We sell grilled cheese for $ 5. It costs $ 1 to create. Using the same formula as before, we find that:
Selling price-Material cost = Profit
Selling price = $ 5
Material cost = $ 1
$ 5- $ 1 = $ 4
Profit / Sales Price = Profit Margin
Profit = $ 4
Selling price = $ 5
Profit margin = 80%
Grilled cheese sandwiches have a combined profit margin of over 50%.
Sales mix variance analysis
We sell about 10 burgers and 2 grilled cheeses every day. Each grilled cheese sandwich you sell will make more money, but the quantity sold will be significantly less than the number of burgers you sell. Therefore, changing the hamburger profit margin will have a greater impact on your business than improving the grilled cheese profit margin by the same percentage.
From the two examples, we can see that hamburgers make less money than grilled cheese. You'll get $ 2 for each burger you sell and $ 4 for each grilled cheese. However, the demand for hamburgers is high, and we sell five times as many hamburgers as grilled cheese. Revenue per sale of grilled cheese may increase, but due to the high volume of sales, hamburgers will increase overall revenue.
To perform a complete analysis, complete the steps for all items available on the food truck. You can then determine how each item affects your bottom line.

Resource-rich countries like Africa are more aware of the value of dealing with international organizations. In some parts of the world, labor relations are tense and public opinion is often hostile to oil and gas companies, even where they depend on natural resources for their livelihoods. In recent industries, there have been incidents in Africa that everyone is facing, although the companies doing business in the region are out of control. How do companies manage risk to better mitigate such incidents?
While executives are undoubtedly aware of the need to manage risk, comprehensive risk programs in many organizations in the oil and gas industry have not kept pace with operational complexity. In many cases, risk is prioritized only when there is a significant incident or event that affects risk within the sector. Given the rapidly changing environment, keep management and board up-to-date to identify new exposures, monitor known risks, make risk-informed decisions, and take advantage of market opportunities. Incorporating risk management into your business is essential to staying in shape.
Common industry mistakes: Many oil and gas companies have been implementing risk management or corporate risk management processes for several years. However, risk management is often misplaced as a compliance function or governance obligation and is seen as a mechanism solely for explaining risks and communicating them to the board of directors. This is not considered a strategic function and is not part of the business planning cycle. Risks are often left in silos and are not organized so that all categories of risk can be viewed in one view.
Risks and threats: Corporate-wide risks, especially emerging threats in new markets, are on the board agenda to understand and manage, but bottom-up assessments are also important. Historically, companies have always invested in risk management activities to address function-specific risks such as exploration risk, production risk, and financial risk, but the current challenge is to bring all these initiatives into a common framework to integrate with and strengthen decision making.
Geopolitical instability: Significant threats to the industry are geopolitical instability and potential risks. In addition to the potential nationalization of assets as recently seen in Argentina, there are also predatory fines by governments in urgent need of money. Reducing geopolitical risk means not only working on the legal and contractual frameworks that underlie a transaction or business, but also understanding the political situation in the region. Predicting changes in political conditions may not be enough to control its impact. Recognizing future political risk factors is one thing, but managing these risks in time to protect assets and people is another issue, especially when: Like Algeria in January 2013, risk is primarily security related.
Cyber security: Recent attacks on the industry show the actual impact that cyber threats can have on the sector through the leakage of commercially sensitive information such as exploration data and malicious interference with industrial control systems. -A tanker course with its proper equipment. Managing cybersecurity as strategic risk rather than operational risk is an important step change needed across the industry to drive long-term risk reduction with quantifiable benefits.
Cyber risks often perform scenario analysis to provide a detailed assessment of their impact on real risk, their greatest vulnerabilities, their exposure quantification, and how companies monitor and address potential cyber-attacks. Is not enough to analyze. That is the biggest risk. Collaboration with the UK Government on FTSE350 Cyber Risk Management indicates that we need to rethink how cyber is reported upwards to the Board of Directors using more open and non-technical indicators.
Third party risk: Every company needs to interact with third parties that pose a variety of potential integrity and reputational risks, from customers and suppliers to agents to local or global strategic partners. In particular, increasing attention to regulatory compliance with anti-corruption laws and anti-corruption laws, such as the UK Foreign Corrupt Practices Act and the US Foreign Corrupt Practices Act, is due to a proper understanding of trading partners, their ownership and methods. It means that you can prevent illegal activities. The business may ultimately be responsible. This reduces the risk of public accusations, fines and even imprisonment. Flexible and responsive third-party risk management programs based on the right level of due diligence are essential for managing the widely talked about risk areas.
Operate with risk in mind: You should incorporate risk thinking from the first step to the end of the planning process, such as oilfield life cycle, labor relations, and entry into new markets. Companies often do not fully analyze the practical impact of risk. For example, leave risk described as geopolitical risk or cyber without careful consideration of the true exposure and readiness to prevent or respond in a way that minimizes adverse consequences and optimizes opportunities. I will. Such exposures allow companies to fully assess the scope of their potential, measure their impact from a financial perspective in those scenarios, and incorporate accountability to monitor specific events using defined metrics. We rarely evaluate and report on the effectiveness of our mitigation plans. With this kind of data, you can determine if your company is at sufficient risk or too much. Are competitors of the same size more valued in the equity market because they are making better risk-based decisions? The difference may be due to a cautious and prudent approach to investing in uncertainty.
Required skills: Control functions and risk management need to be coordinated appropriately. Lack of skills and lack of knowledge and experience on how to achieve this form of integration are major obstacles to the convergence or integration of risk and management functions in oil and gas companies. Compliance, corporate governance, assurance, risk finance, etc. need to converge, but managers of these silos are often willing to give up their budget and perceived influence and power within their organization. You need one executive who understands a wide range of governance, risk management, and compliance issues. KPMG recently helped utilities consolidate six risk-related departments into one, standardizing risk-related functions for superior synergies, driving cost savings, and overall risk programs increased effectiveness.
Conclusion
If risk management is viewed by business leaders as a proforma exercise solely for the consumption of board members, it remains forever isolated from operational reality. The CEO needs to take the lead in helping the board make risk-aware decisions at the corporate level. At the same time, help managers at the bottom of the hierarchy understand how choices affect a company's risk profile. Oil and gas companies often manage their health and safety and environmental risks well, but these challenges tend to mask other risks that may be equally dangerous to the company's health. There is. Only by developing a more strategic approach and integrating risk management processes into everyday business thinking can executives build a risk-aware culture.
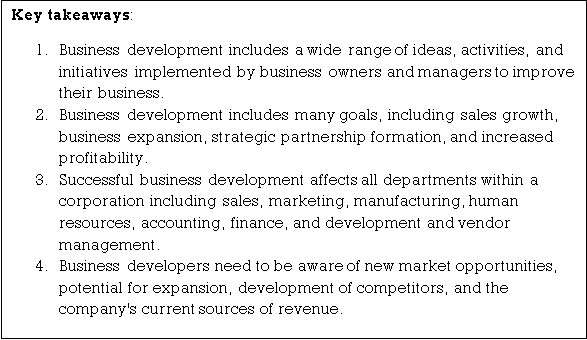

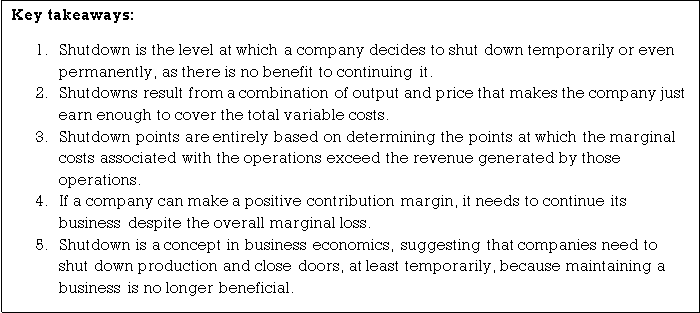
A company chooses to implement a production suspension if the revenue received from the sale of the goods or services produced cannot even cover the variable costs of production. In such situations, the company experiences significant losses in production compared to no production at all.
Technically, a shutdown occurs when the average revenue is below the average variable cost with a positive level of output that maximizes profits. Producing something doesn't generate enough income to offset the associated variable costs. Producing a certain amount of production adds additional costs that exceed profits to the inevitable costs (fixed costs). By not producing, the company loses only fixed costs.
Explanation
A company's goal is to maximize profits or minimize losses. Companies can achieve this goal by following two rules. First, an entity should operate at a production level where marginal revenue is equal to marginal cost. Second, if doing so can reduce losses, the company should shut down rather than shut down.
Shutdown rule
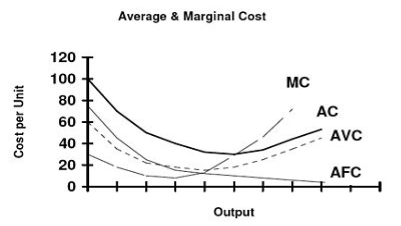
Average variable cost (AVC), average total (fixed and variable cost) cost (AC), and average fixed cost (AFC), marginal cost (MC). Optimal production in the short term occurs when marginal costs intersect marginal revenues (not shown; horizontal for perfect competitors, otherwise downward slopes. At this output level, if the height of the average revenue curve (not shown; horizontal for perfect competitors, otherwise slopes downward) is lower than the height of the average variable cost curve. The company will stop producing goods in a short period of time. Do it to avoid negative profits.
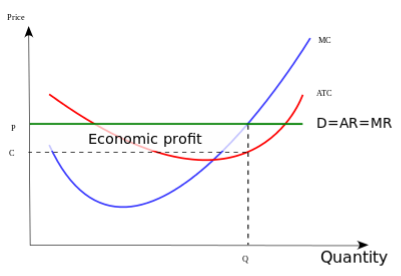
The best production for a perfect competitor is when the marginal cost (MC) is equal to the marginal revenue (MR). In the case shown, this situation is due to the average revenue (AR) above the average variable cost (not shown in the figure, but below the average total cost (ATC)) at this output. Companies will not shut down.
In general, an enterprise should have revenue {\ display style R \ geq TC} {\ display style R \ geq TC}, total cost to avoid losses. However, in the short term, all fixed costs are sunk costs. After deducting fixed costs, companies face the requirement of {\ display style R \ geq VC} {\ display style R \ geq VC} (total revenue greater than or equal to variable costs) in order to continue their business. Therefore, companies find it beneficial to operate in the short term as long as the market price is above the average variable cost (p ≥ AVC).
Conventionally, the rules for suspension of operations are as follows. if the value is above the average variable cost, the firm needs to carry on its business in the short term
In other words, for short-term production, the company needs to be profitable enough to cover the variable costs.
The rationale for the rule is simple. By shutting down, the enterprise avoids all variable costs.
However, the company still has to pay fixed costs.
Fixed costs must be paid regardless of whether the company operates, so they should not be considered when deciding whether to produce or close
Therefore, when deciding whether to close a company, you need to compare your total revenue to your total variable cost (VC) rather than your total cost (FC (fixed cost) + VC). If the revenue the company receives is greater than the variable costs (R> VC), the company has additional revenue that covers all variable costs and also partially or completely offsets the fixed costs.
(Fixed costs are sunk costs, so size doesn't matter.
The same considerations apply whether fixed costs are $ 1 or $ 1 million.) On the other hand, if VC> R, the company Not even. It should cover short-term production costs and shut down immediately. The rules are usually stated in terms of price (average revenue) and average variable cost. The rules are equivalent. Dividing both sides of the inequality TR> VC (total revenue exceeds variable cost) by the output quantity Q yields P> AVC (price exceeds average variable cost).
If the company decides to do business, these conditions guarantee maximization of profit (or equivalent, minimization of loss if profit is negative), so production is performed where marginal revenue is equal to marginal cost will be done.
Another way to state the rules is that companies need to choose options that generate greater profits (plus or minus) compared to the profits that would be realized if the profits from the business were closed.
The closed company has zero revenue and no variable costs. However, the company still bears fixed costs.
Therefore, the profit of the company is equal to the minus of the fixed cost or (–FC).
The operating company generates revenue, bears variable costs, and pays fixed costs. The operating company's profit is R-VC-FC. If the simplified R – VC – FC ≥ – FC is R ≥ VC, the company must continue to operate.
The difference between Revenue R and Variable Cost VC is the contribution to offset fixed costs and the positive contribution.
The difference between revenue R and variable cost VC is a contribution to offset fixed costs, which is better than no positive contribution. Therefore, if R ≥ VC, the company must operate. If R <VC, the company must shut down.
Exclusive shutdown rules
If the price (average revenue) is lower than the average variable cost of all output levels, the monopoly will need to shut down.
In other words, if the demand curve is well below the average variable cost curve, the monopoly needs to shut down.
Under these circumstances, even at profit maximization level production (MR = MC, marginal revenue equals marginal cost), average revenue is lower than average variable cost, and monopolies are closed in the short term. It would be better.

Sunk cost
The implicit premise of the above rule is that all fixed costs are sunk costs. However, although the costs in production are fixed, there may be physical assets with a salvage value that can be acquired in the event of a shutdown. If some costs are buried and some are not, the total fixed cost (TFC) is the buried fixed cost (SFC) plus the non-buried fixed cost (NSFC), or TFC = SFC + NSFC. Become. If some fixed costs are not suppressed, you may need to change the shutdown rules. To explain the new rule, you need to define a new cost curve, average non-sunk cost curve, or ANSC. ANSC is the mean variable cost plus the mean non-buried fixed cost, or is equal to ANSC = AVC + ANFC. In that case, the new rule looks like this: If the price is higher than the minimum average cost, we will produce it. If the price is between the minimum average cost and the minimum ANSC, produce. If the price is less than the minimum ANSC at all production levels, shut down.
If all fixed costs are not buried, or if prices fall below average total costs, the (competitive) company will be shut down.
Short-term shutdown compared to long-term exit
- The decision to shut down the firm means that the company is temporarily out of production.
- It does not mean that the company will go out of business (withdraw from the industry). If market conditions improve due to higher prices or lower production costs, the company can resume production. Shutdown is a short-term decision.
- The closed company does not produce, but still holds capital assets. However, companies cannot leave the industry or avoid fixed costs in the short term.
- However, the company does not choose to suffer indefinite losses. In the long run, companies need to decide whether to continue their business or to leave the industry and pursue profits elsewhere. The end is a long-term decision. Companies withdrawing from the industry have evaded all commitments and released all capital for use by more profitable companies.
- Companies withdrawing from the industry do not make money, but they do not incur any costs, whether fixed or variable.
- The long-term decision is based on the relationship between price P and long-term average cost LRAC.
- If P ≥ LRAC, the company will not withdraw from the industry. If P <LRAC, the company will withdraw from the industry. These comparisons are made after the company has made the necessary and feasible long-term adjustments.
- In the long run, a company operates when its marginal revenue is equal to its long-term marginal cost, but only if it decides to stay in the industry.
- Therefore, the long-term supply curve of a perfect competitor is a long-term marginal cost curve that exceeds the minimum point of the long-term average cost curve.
Calculation of shutdown point
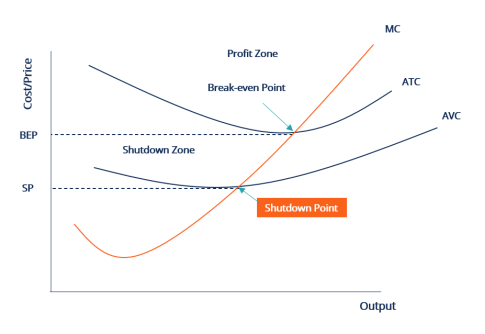
The short-term shutdown point for a competitive company is the output level at the minimum of the average variable cost curve. Suppose the total cost function of an enterprise is TC = Q3 -5Q2 + 60Q + 125. In that case, the variable cost function is Q3 –5Q2 + 60Q, and the average variable cost function is (Q3 –5Q2 + 60Q) / Q = Q2 –5Q + 60. The slope of the average variable cost curve is the derivative of the latter. That is, 2Q-5. Equalizing this to zero and finding the minimum gives Q = 2.5 and the average variable cost level of the output is 53.75. Therefore, if the market price of a product falls below 53.75, the company chooses to stop production.
The long-term shutdown point for a competitive company is the output level at the minimum of the average total cost curve. Suppose the total cost function of an enterprise is the same as in the example above. To find the shutdown point in the long run, first get the derivative of ATC, then set it to zero and solve Q. After getting the Q, connect to the MC and get the price.
Shut down Diagram
Where:
MC – Marginal Cost
ATC – Average Total Cost
AVC – Average variable cost
SP – Shutdown Price
BEP = Break Even Point
Practical Questions:
Problem 1:
The following information is provided regarding product A manufactured by the company:
Rs.
Sales 10,000
Direct material 4,000
Direct labor 2,000
Variable overhead 1,000
Fixed overhead 2,000
The new product, Product B, is proposed to be introduced to increase sales from Rs.
2,000. The estimated cost is as follows:
Solution:
Direct material Rs. 1,000
Direct labor 400
Variable overhead 300
The fixed costs of the company do not change. Advise management.
Product B profitability
Sales Rs. 2,000
Low: Marginal cost:
Direct material 1,000
Direct labor 400
Prime cost 1, 4000
Variable overhead 3001,700
Contribution 300
Therefore, adding product B increases the company's profit position by Rs. 300.
Problem 2:
Ever Green Ltd manufactures product "A". The production volume in 2004 was 120,000.
The cost sheet based on this product is as follows.
Selling price 100
Direct material 21
Component "X" 9
Direct wages (@Rs. 4 per hour) 20
Factory overhead (fixed 50%) 24
Sale & distance Overhead (75% variation) 12
Management overhead (fixed) 490 Profit 10
Currently, the company manufactures component X, one for each unit of product A. The cost details for 10,000 units of component X are as follows:
Rs.
Direct material 24,000
Direct labor 30,000
Variable overhead 18,000
Fixed overhead 18,000
90,000 in total
The fixed overhead inherent in component X is fixed for any volume manufacture. However, Component X can be purchased on the Rs 8 each market.
The company is currently considering a proposal to discontinue component X and purchase it from the market instead.
Does the company manufacture or purchase components? When:
(A) There is no alternative use of spare capacity.
(B) Spare capacity can be borrowed with Re once an hour.
Solution
a) When there is no alternative use of reserve capacity
1. Purchase cost of component X: Rs. (1, 20,000 units @ Rs. 8) 9, 60,000
2. Cost of creating component X:
Variable cost
(1, 20,000 units @ Rs. 7.20) 8, 64,000
Fixed cost 18,000
8, 82,000
The purchase cost is higher than the cost of making it in rupees. (9,60,000 – 8,82,000) or Rs. 78,000. Therefore, we recommend that you make the parts at your own factory.
b) If you can borrow spare capacity
1. Related purchase cost: Rs.
Purchase cost of component X (as above) 9, 60,000
Less savings on certain fixed costs 18,000
9, 42,000
Low income from reserve rent [released working hours x hourly wage
= 90,000 hours @Re. Once an hour] 90,000
8, 52,000
2. The net or effective cost of Component X (as described above) 8,82,000 The associated purchase cost is lower than the effective cost by Rs. 30,000.
Therefore, it is advisable to purchase Component X from the market.
Note: Working hours freed from reserve capacity: Working hours to produce 10,000 units of X = (Rs .30, 000 / Rs .4 / hour) = 7,500
Therefore, the working hours for not manufacturing 120,000 Xs are released.
= (7,500 hours / 10,000 units) x 1, 20,000 units = 90,000 hours.
Problem 3:
Super Quality Ltd. Seeks advice on determining the most profitable products. Please combine the three products of Good, Better and Best. The following information is provided:
1. Unit price data: |
| ||
Direct material (Rs.) | 320 | 240 | 160 |
Variable overhead (Rs.) | 16 | 40 | 24 |
2. Information on direct labour : |
|
|
|
Dept. A (@ Rs. 8 per hour) 6 hrs. | 10 hrs. | 5 hrs. | |
Dept. B (@ Rs. 16 per hour) 6 hrs. | 15 hrs. | 11 hrs. | |
3. Annual budget data : |
|
| |
Annual production (units) 5,000 | 6,000 | 10,000 | |
Selling price per unit (Rs.) 624 | 800 | 525 | |
Fixed overheads Rs. 16,00,000 |
|
| |
4. Sales Department’s estimate of the maximum possible sales in the Coming year (units) 6,000 |
8,000 |
10,000 | |
Sector A's workforce supply is constrained and its workforce cannot be increased beyond current levels.
i) We propose the most profitable combination of production and sales.
Ii) Make a statement of profitability based on the proposed product mix.
Solution 3
(i) Determination of the most profitable product |
Mix |
| |
Products Good | Better | Best | Total |
1. Labour hours available at present in Dept. A (Production units x Hours p.U.) 30 |
60 |
50 |
140 |
2. Contribution as above (Rs. ’000) 720 | 1,200 | 1,250 | 3,170 |
3. Contribution per labour hour (Rs.) 24 | 20 | 25 | --- |
4. Rank on the basis of Contribution Per labour hour (Key factor) II |
III |
I |
--- |
To optimise the use of labour hours, available | Labour hours | Would | Be distributed |
Available working hours are distributed to optimize the use of working hours
Of course, based on the above ranks, we are subject to the overall constraints of market demand. This is shown in the following statement.
Products (Rank wise) | Maximum Possible Sales (Units) | Labour Hours in Dept. A | Maximum Production Suggested (Units) | ||
Balance Available | Required | ||||
Per Unit | For units in Col. (2) | ||||
(1) | 2 | (3) | 4 | (5) | 6 |
Best | 10,000 | 1,40,000 | 5 | 50,000 | 10,000 |
Good | 6,000 | 90,0001 | 6 | 36,000 | 6,000 |
Better | 8,000 | 54,0001 | 10 | 80,000 | 5,4002 |
The most profitable combination of production and sales:
Good 6,000 units
Better 5,400 units
Best 10,000 units

(ii) Profitability Statement for suggested production and sales mix
Products Good Better Best Total
| Production / Sales (units) | 6,000 | 5,400 | 10,000 | 21,400 |
Contribution for present production-mix as computed above (Rs. ’000) |
720 |
1,200 |
1,200 |
3,170 | |
Present Production-mix (Rs. ’000) | 5 | 6 | 10 | 21 | |
Contribution per unit (Rs.) | 144 | 200 | 125 | --- | |
Contribution for suggested Production-mix (Rs. ’000) |
864 |
1,080 |
1,250 |
3,194 | |
Fixed Overheads (Rs. ’000) |
|
|
| 1,600 | |
| Profit (Rs. ’000) |
|
|
| 1,594 |

Problem 4:
Below is a budget estimate for the company in 2004-05.
Products | A | B |
Sales | 6,000 | 16,000 |
| Rs./Unit | Rs./Unit |
Selling price | 30 | 64 |
Direct materials | 12 | 18 |
Direct wages @ Re. 1 per hour | 8 | 16 |
Variable overheads | 4 | 6 |
Fixed overheads : Attributable to the product |
2 |
6 |
Apportioned General fixed cost | 6 | 6 |
Total Cost | 32 | 52 |
Profit/Loss | (–) 2 | 12 |
Would you recommend dropping product A? Justify your answer.
| Rs. | Rs. 30 |
Selling Price |
|
|
Less : Managerial costs : |
|
|
Direct materials | 12 |
|
Direct wages | 8 |
|
Variable overheads | 4 | 24 |
Contribution per unit |
| 6 |
Loss of contribution if product |
|
|
A is dropped (Rs. 6 × 6,000) | = Rs. 36,000 |
|
There will be a savings of specific fixed | Cost of Rs. 12,000 | (6,000 @ Rs. 2). But |
There are certain fixed cost savings for Rs. 12,000 (6,000 @ Rs .2)
If product A is dropped, the product will have to bear the entire general fixed cost
B. Therefore, discontinuing Product A reduces overall prostitution by Rs. 24,000 (ie Rs. 36,000 – 12,000). That is, the location looks like this:
Current prostitution:
Product B: 16,000 x Rs. 12 = 1, 92,000 Product A: 6,000 × (–) 2 = (–) 12,000
1, 80,000
Low: net loss 24,000 if product A is dropped
Position from product B 1, 56,000
The above statement can be found below.
Contribution from product B
(Rs. 64–40) × 16,000 = 3, 84,000
Low: Specific fixed costs: 16,000 @Rs. 6 = 96,000 General fixed costs:
6,000 @ Rupee 6 = 36,000
16,000 @ Rupee 6 = 96,000 1, 32,000 2, 28,000
Profit Rs. 1, 56,000
Problem 5:
Suppose your company decides to manufacture $ 26 parts per unit in-house, including direct, fixed, and variable overhead, as shown in the following table.
Cost Head | Cost per Unit ($) |
Direct Cost | 15 |
Fixed Overhead | 4 |
Variable Overhead | 7 |
Total Cost | 26 |
The same parts are available on the market for $ 23 per unit, as shown in the following table. This includes purchase, shipping, and warehousing costs.
Cost Head | Cost per Unit ($) |
Cost of Part | 20 |
Shipping and Warehousing Cost | 3 |
Total Cost | 23 |
Does the company need to manufacture or buy parts?
Analysis
If you purchase a component and the available surplus remains idle, the out-of-pocket cost will be $ 23 per unit, which is the variable and direct cost of creating the component of $ 22 ($ 15 + 7). (One dollar more than the dollar). Therefore, it is economical to make it. However, if we utilize or have the capacity to manufacture other parts, we will contribute a profit of $ 4 per unit. The effective cost of purchasing a component is $ 19 ($ 23 minus $ 4 contributions from other products). In that case, it is economical to purchase the component from the outside for $ 23 per unit.
The calculations related to decision making are:
Particulars | Make ($) | Per Unit Cost Buy & Leabe Capacity Idle ($) | Buy and Use Capacity for Other Products ($) |
Cost of Making/Buying | 22 | 23 | 23 |
Contribution from other Product | - | - | 4 |
Net Relevant Cost | 22 | 23 | 19 |
References:
- Https://courses.lumenlearning.com/wm-accountingformanagers/chapter/data-for-making-or-buying-decisions/
- Https://opentextbc.ca/organizationalbehavioropenstax/chapter/overview-of-managerial-decision-making/#:~:text=Managers%20are%20constantly%20making%20decisions,is%20rarely%20one%20right%20answer.
- Https://www.economicsdiscussion.net/decision-making/managerial-decision-making-process-5-steps/6099
- Https://theintactone.com/2019/06/08/ma-u4-topic-10-decisions-regarding-determination-of-sales-mix/
- Https://en.wikipedia.org/wiki/Break-even_(economics)
- Http://www.sciedu.ca/journal/index.php/afr/article/view/5488
- Https://accounting-simplified.com/management/relevant-costing/shutdown-decisions/
- Https://www.jstor.org/stable/2601021?seq=1