Unit III
NETWORK ANALYSIS
3.1.1 Concepts: Activity, Event, Network Diagram, Merge Event, Burst Event, Concurrent and Burst Activity,
Critical Path Method
The critical path method (CPM), also known as critical path analysis (CPA), is a scheduling procedure that uses a network diagram to depict a project and the sequences of tasks required to complete it, which are known as paths.
The essential technique for using CPM is to construct a model of the project that includes the following:
- A list of all tasks required to complete the project
- The dependencies between the tasks
- The estimate of time (duration) that each activity will take to complete.
Activity
Every project consists of several job operations or tasks which are called activities. An activity is shown by an arrow and it begins and ends with an event. Activity consumes time and resources. An activity may be performed by an individual or a group of individuals.
Event
An event represents a point in time signifying the completion of some activities and the beginning of new ones. This is usually represented by a circle in a network which is also called a node or connector.
|
Network diagram
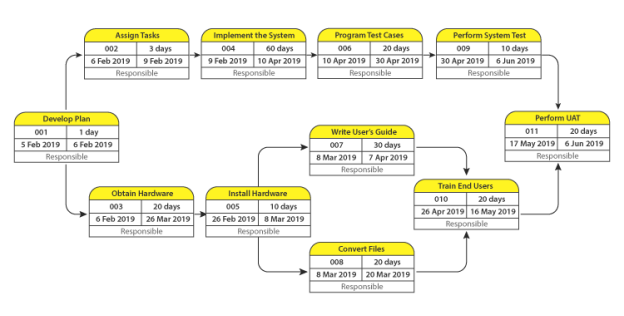
A project schedule network diagram visualizes the sequential and logical relationship between tasks in a project setting. This visualization relies on the clear expression of the chronology as it pertains to these tasks and events.
Most often, a project network diagram is depicted as a chart with a series of boxes and arrows. This network diagram tool is used to map out the schedule and work sequence for the project, as well as track its progress through each stage — up to and including completion. Because it encompasses the large tasks that need to occur over the project’s duration, a network diagram is also useful in illustrating the scope of the project.
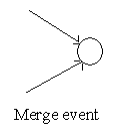
Merge event
When more than one activity comes and joins an event such an event is known as a merge event.
|
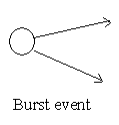
Burst event
When more than one activity leaves an event such an event is known as a burst event.
|
Concurrent activity
Activities that can be accomplished concurrently are known as concurrent activities. It may be noted that an activity can be a predecessor or a successor to an event or it may be concurrent with one or more of other activities.
Burst Activity:
An activity that has more than one activity immediately following it (more than one dependency arrow flowing from it).
3.1.2 Construction of a Network Diagram. Node Relationship and Precedence Relationship.
How to create a network diagram
To organize the working project, you need to determine the most logical order to complete the project activity. A tool that helps you document your workflow is called a network diagram. Network diagrams use logical relationships between activities to identify the order in which work is completed.
Depending on the level of decomposition and the complexity of the project, the network diagram may show work packages that are completed in a small project or only the milestones or major activities of a large project. , Or may be split into several workflows that display different levels of detail for complex projects.
Network diagrams can help you understand how your work actually works together and create a reliable and realistic schedule for your project. Network diagrams reveal workflows as well as tasks. When properly constructed, the network diagrams:
Explain how the work in the project is combined
- A powerful way to tell what's going on in your project and what's left
- Show project path
- List start and end dates
- Specify the person responsible for each activity
The project manager leads the team in defining the most effective and efficient path to complete all the required work. Network diagrams are an effective tool when:
- Planning a series of work
- Continuous performance measurement
- Reflection of proposed and approved changes
To create a network diagram, the team needs to analyze project activity and identify the relationships and constraints that exist between them. If it is properly synchronized the network diagram does the following:
- Shows the sequence and relationships between activities required to complete the project
- Identify the relationship between project milestones that can be used to monitor progress and completion
- Shows the interrelationship of activities in different parts of a work breakdown (WBS)
- Establish a means to schedule tasks
- It helps reduce project uncertainty by dividing the project into many smaller phases that are analyzed and ordered before you start working on it.
|
When creating a network diagram, you need to understand dependencies, precedents, leads, and lags.
Dependencies
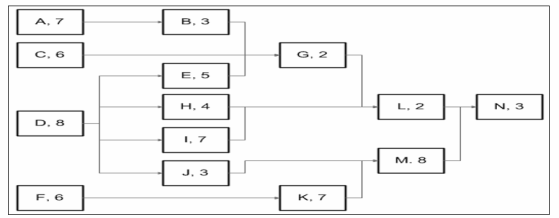
The network diagram above shows the activity as a box called a node. The relationship between each activity and subsequent activities is indicated by an arrow. For simplicity, letters are used rather than the complete activity name. The estimated duration of each activity is also displayed on the node. The network is read from left to right.
To draw the network, the team needed to know the relationships between each activity. Some activities depend on other activities. That is, you cannot run them unless other activities occur.
There are three sorts of dependencies that will exist:
- Mandatory
- Unique to the work itself
- Usually, there are physical constraints
- For example, when building a house, you need to build the frame before adding the roof.
2. Discretion
- Defined by the project tea
- Depends on the project
- Example: Paint the wall before laying the carpet.
3. External
- Subject to input from outside the project activity
- Project teams usually have little control over these events
- Example: Wait for a building permit before starting construction.
The project team first determines the required external dependencies and then works to define any relationships. It is important to note that the latter is subject to change at a later date if necessary. When first built, any dependencies reflect the team's opinion on the most logical or preferred sequence to complete the project work.
Precedent
In addition to identifying the various dependencies, the team needs to analyze the precedent relationships between activities. That is, what should the state of the preceding activity be before the subsequent activity reaches a certain state? Image of network diagram above:
- Activities A, C, D, and F are unprecedented and can be performed as quickly as possible. Nothing else needs to happen before you can complete those tasks.
- However, Activity B must wait for Activity A to complete before the team can start working.
- Activities B, C, and E must be completed before you can start working on Activity G.
- Activities B, C, and E set a precedent for activity G.
Several types of pre-relationships can exist between activities in your network.
- Finish and start
- Activity A must end before starting Activity B.
- The most common type of precedent relationship.
- Example: Before you can create a frame, you need to complete the foundation of your house.
2. End to end
- Activity A must finish before Activity B finishes.
- You may see that both activities end at the same time.
- For example, you need to finish the wiring before you finish the electrical inspection.
3. Start from start
- Activity A must start before starting Activity B.
- It may appear as both activities start at the same time.
- For example, you should start coding new software before you start testing.
4. Start finishing
- Activity A must start before Activity B ends
- The rarest type of precedent.
- For example, operations teams need to start production support before finishing a project.
Keep in mind that each activity in your network has both dependencies and predecessors, except for those that you can start right away. Keep in mind that putting a roof on a house has both the essential dependencies and finishes to start a predecessor with building a frame.
Reeds and rugs
The relationship between activities is not always immediate. In some cases, successors may start a little earlier or may require a delay before they start. Leads and lags can be applied to enhance network diagrams and schedules. These are most often used in the Finish to Start relationship.
Lag is the delay in starting a successor activity. For example, there may be a Finish to start a relationship between painting the walls of the living room and laying the carpet. However, it may be wise to add a one-day delay between these activities to dry the paint. This can extend the project schedule, but otherwise, it can cause additional work if you need to clean the wet paint from the carpet.
Leads are typically implemented when the successor's activities need to be accelerated to shorten the overall project schedule.
For example, you usually wait for the blueprints to complete before you start construction, but to complete the project on time, you may start construction a week before the final drawings are completed. In doing so, the project team generally takes on more risk and needs to take that into account. In this example, if a blueprint is significantly changed, the team may have to discard or change the work that has already been completed.
3.1.3 Principles of Constructing Network Diagram.
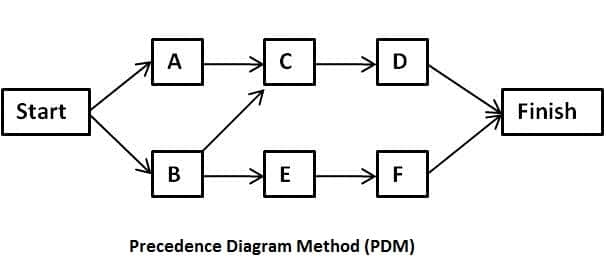
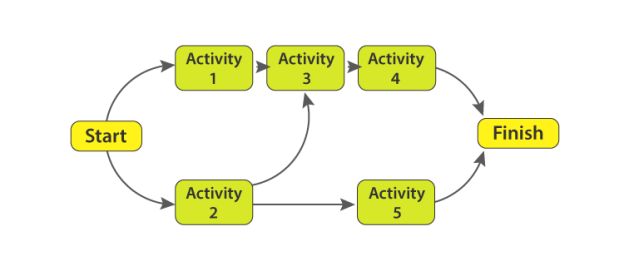
Precedence Diagramming Method (PDM) maybe a graphic representation method. Shows activity interdependencies and is employed to make schedules. Another name for this system is Activity on Node (AON).
Use this method to make a network diagram of your project schedule. For instance, a critical path network, a critical chain network diagram, and so on.
|
The priority projection is formed from rectangles called nodes. These boxes show the activity of the project. The arrow connects the 2 boxes and shows the connection. Therefore, these diagrams also are called activity (AON) diagrams on the node.
PDM dependency type
PDM uses four dependencies.
- Mandatory dependencies
- Discretionary
- External dependencies
- Internal dependency
Mandatory dependencies
This dependency is additionally referred to as hard logic. You cannot avoid it. The beginning of subsequent activity depends thereon.
For example, you can’t install a ceiling until you’ve got built all the walls.
Discretionary
- This dependency also referred to as preferred logic or soft logic, is liable for optimizing resources.
- For example, you’ll create four walls in any order. However, if it’s beneficial to create them during a particular order, build them therein order.
- Here you’ll change the sequence of activities consistent with your favorite logic.
External dependencies
The project management team has no control over external dependencies.
For example, government approval could also be required before subsequent activity can begin.
Internal dependency
These dependencies are under the control of the project or organization.
For example, you can’t get a resource until you’re released from another project.
Dependency
The Precedence Diagramming Method uses four relationships:
- End to start (FS)
- Finish to end (FF)
- Start to Start (SS)
- From start to finish (SF)
- End to start (FS)
Here you can't start subsequent activity until the primary activity is complete. This is often the foremost common relationship in PDM.
End and begin (FS) relationship
For example, to color a wall, you initially got to create the wall. During this case, the primary activity is building the wall, and therefore the second activity is painting. You can't start painting the wall until the wall is prepared.
|
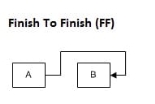
Finish ending (FF)
Here, you can't complete subsequent activity until the primary activity is completed. Simply put, you would like to end both activities at an equivalent time.
|
Relationship from end to finish (FF)
For example, for instance, you're coding a program for a client. The client will provide the functionality after completing the milestone. you can't complete the coding until you've got the complete requirements of the client. Here you would like to end both activities at an equivalent time.
|
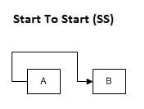
Start to Start (SS)
Here, subsequent activity can't be started until the primary activity is started. Both activities must start at an equivalent time.
|
Start-to-start (SS) relationship
Suppose you would like to use a coating to the wall, but you would like to wash the wall to use it.
Therefore, one team cleans the wall, and therefore the second team coats the wall. You’ll start both activities at an equivalent time.
From start to finish (SF)
Here, you can't finish the subsequent activity until the primary activity has started.
Start-to-end (SF) relationship
- For example, you're moving to a replacement house and you've got to demolish your old house. During this case, you'll not be ready to move to your new home until you're ready. Therefore, the second activity (building a replacement home) must be completed before the primary activity (moving to a replacement home) begins.
- Simply put, you're moving to your new home. You can't leave an old house until the new one is prepared.
- This relationship is rare, but you would like to know all the dependencies. Helps you draw a network diagram and schedule your project.
- This is the top of the priority diagram method.
- The AOA method may be a special case of priority projection.
- The AOA diagram uses only the Finish to start relationship. This shows the amount above the arrow. For this reason, many experts ask this charting method as an "arrow activity" diagram. PERT is an example of this system.
- There is a difference between the AON diagram and therefore the AOA diagram. The AOA diagram emphasizes milestones (events) and therefore the AON diagram emphasizes tasks.
How to draw a priority diagram
- To draw a PDM, break the working exploded view into activity levels.
- Then create a table to list all the activities and type the activities so as.
- The next step is to feature a relationship to every activity. Add a subsequent activity.
- Finally, draw a diagram.
Advantages of priority projection
- This method offers many benefits for project management.
- It helps find relationships and dependencies between activities. This helps you plan and avoid risk. If you have a missing task, you can easily identify it.
- You can find important activities and focus on them. If important activities are delayed, the schedule will be delayed.
- The project schedule network diagram is a great communication tool. Stakeholders can visualize activities and understand schedules.
- Without a priority diagram, you can't schedule a project.
Overview
Priority diagram techniques play an important role in project management. Your project schedule depends on it and it's a good communication tool. This is commonly referred to as AON and the node represents the activity. The other PDM is AOA, where nodes represent milestones and durations are indicated by arrows.
3.1.4 Use of Dummy Activity
This term is defined in the 3rd edition of PMBOK, but not in the 4th edition.
If two paths in your network have common events but are otherwise independent, you may get a logical error as shown in fig 1
Suppose you need to specify specific hardware for a particular project before ordering and coding the software. You also need to specify the appropriate data structures before coding the software, but you don't have to wait for this to complete before ordering the hardware.
|
Fig 1
Figure 1 is an attempt to model the above situation but is incorrect in that both the hardware specification and the data structure design must be completed before you can start ordering or software coding.
Design data code software>
Figure 2 T dummy activity is linked by two paths
|
Fig 2
The dummy activity shown by the dotted line in the network diagram has zero duration and does not use resources. These are often used to assist in the layout of network drawings, as shown in Figure 6.15. Dummy activities, where two activities share the same start and end nodes, make it easy to distinguish between activity endpoints.
Another use of dummy activity:
3.1.5 Numerical Consisting of Maximum Ten (10) Activities.
Example
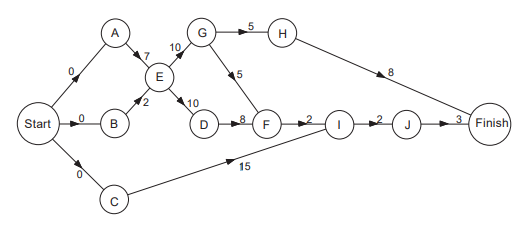
Consider the activities shown below for the construction of a garage. Draw a network diagram.
| Activity | Duration (in days) |
A | prepare foundations | 7 |
B | make and position door frame | 2 |
C | lay drains, floor base, and screed | 15 |
D | install services and fittings | 8 |
E | erect walls | 10 |
F | plaster ceiling | 2 |
G | erect roof | 5 |
H | install door and windows | 8 |
I | fit gutters and pipes | 2 |
J | paint outside | 3 |
Solution:
Some of these activities cannot be started until other activities have been completed. For example
activity G – erect roof cannot begin until
activity E - erect walls
has been completed. The following table shows which activities must precede which.
D must follow E
E must follow A and B
F must follow D and G
G must follow E
H must follow G
I must follow C and F J must follow I.
All this information can be represented by the network shown below.
|
The critical path is the longest sequence of activities in a project plan which must be completed on time for the project to complete on the due date. Activity on the critical path cannot be started until its predecessor activity is complete; if it is delayed for a day, the entire project will be delayed for a day unless the activity following the delayed activity is completed a day earlier.
Sub-critical path
The sub-critical path means the second-longest path in the network. It is shorter than the critical path but longer than all other paths in the network. All activities on the sub-critical path are not critical. Some of the activities may be critical.
Critical activities
Critical activities are the project tasks that must start and finish on time to ensure that the project ends on schedule. A delay in any critical activity will delay the completion of the project unless the project plan can be adjusted so that successor tasks finish more quickly than planned.
Non-critical activities
Activities that can be pushed beyond their allotted deadline (up to the slack time) without affecting the project due date are called non-critical activities.
Project completion time
When you have calculated the duration of the critical path, you can determine what the expected time of project completion is. Adding the time it takes to complete the tasks on the critical path to the starting date gives you the completion date according to the time estimation definition. You can maintain this date as long as you complete every critical activity within its projected duration. At the same time, you have to monitor the other activities of the project for delays.
3.1.7 Forward Pass and Backward Pass Methods.
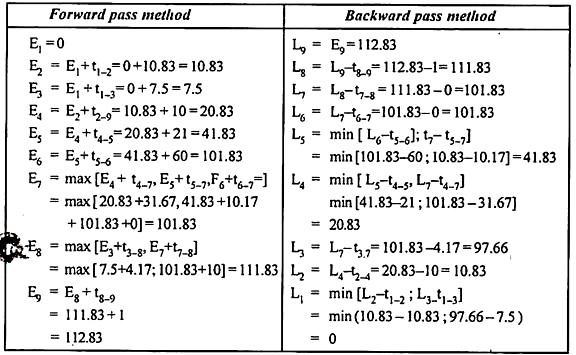
Forward pass method (For Earliest event time):
Based on the fixed occurrence time of the initial network event, the forward pass computation yields the earliest start and earliest finish times for each activity and indirectly the earliest expected occurrence time for each event.
This consists of the following steps:
1. The computation begins from the start node and move to the ‘end’ node. To accomplish this, the forward pass computations start with an assumed earliest occurrence time of zero for the initial project event.
i.e. E1 = ; i = 1
2. Calculate the earliest start time for each activity that begins at the event i. This is equal to the earliest occurrence time of event i (Tail event) i.e., ESij = Ei for all activity (i, j) starting from the event i.
3. Calculate the earliest finish time of each activity (I, j) which is the earliest start time of the activity plus the duration of the activity, i.e.
EFij = ESij + tij
= Ei + tij
4. Calculate the earliest occurrence time for event j (J > i) which is the maximum of the earliest finish times of all activities ending into that event, i.e.
Ej = Maximum (ESij + tij)
= Max [Ei + tij]
The computed values are put into the lower-left portion of each event.
Backward pass method (For latest allowable time):
In this method, the calculation begins from the last event L.
The various steps are as follows:
1. Set the latest occurrence time of the last event L which is equal to the earliest occurrence time of that event obtained from the forward pass method.
i.e., Assume L = E for ending event.
2. Latest finish time for activity (i,j) equal to the latest event time of event j, i.e., LFij = Li
3. Latest starting time of activity (i,j) is the latest completion time of (i,j) minus the activity time i.e.
LSij = LFij – tij
= Li – tij
4. Latest event time for the event i is the minimum of the latest start time of all activities originating from that event.
Thus
Li = Minimum (LSij)
= Min (LFij – tij)
= Min (Lj – Lij)
The computed values are put into the lower right portion of each event.
3.1.8 Calculation of EST, EFT, LST, LFT, Head Event Slack, Tail Event Slack, Total Float,
The earliest possible time at which the event can occur. The EST also denotes the Earliest Start Time (EST) of activity as activities emanate from events. The EST of an activity is the time before which it cannot commence without affecting the immediately preceding activity.
EST of tasks with no predecessors = First logical starting point.
EST of tasks with predecessors = Predecessor EFT (Earliest Finish Time).
The earliest point in time when the scheduled activity can complete (based on preceding logic and constraints).
EFT of tasks with no predecessors = Estimated task duration.
EFT of tasks with predecessors = (Task EST + Estimated task duration).
The latest time at which the event can take place. Also referred to as the Latest Start Time (LST) indicating the latest time at which an activity can begin without delaying the project completion time.
Task LST = (LFT – Task duration).
The latest point in time when the scheduled activity can finish so as not to delay the project completion date or any constraint.
Task LFT = EST of the first dependent task.
3.1.9 Free Float, Independent Float, and Interfering Float.
What is Free Float?
Free floats, also known as public floats, are shares of a company that is open-tradeable and unrestricted (that is, insider-owned). In other words, the term is used to describe the number of stocks commonly available for trading in the secondary market.
Free float formula
|
Where:
- The number of issued shares is the number of shares held by all shareholders of the company.
- Restricted shares are shares that cannot be transferred until certain conditions are met. Restricted shares are usually held by business owners such as executives and directors.
- Private stock usually refers to stock that is held for a very long time. Examples include major long-term shareholders and insiders.
Free float example
Company A is a listed company and 1,000,000 shares have been approved. Currently, as shown on the company's balance sheet, the total number of issued common shares is 500,000 (of which 50,000 are owned by the company's CEO and CFO), with 80,000 owned by the Ministry of Finance. I am. Determine the free float of company A.
The above information is shown as follows:
Approved shares: 1,000,000
Issued common stock: 500,000 shares
Limited / Private Stock: 50,000
Treasury stock: 80,000 shares
Company A's free float is 450,000 shares (500,000 – 50,000).
Determining the percentage of free float
The Free Float Percentage, also known as the Float Percentage of Total Issued Shares, represents the percentage of freely traded issued shares.
In the previous example, the free float percentage would be 90% (450,000 / 500,000).
How to increase or decrease the amount of free float
The issued shares of the company may increase or decrease at the discretion of management. For example, a company can increase its free float by selling shares in a secondary offer or conducting a stock split.
In addition, when restricted stocks are unrestricted, unrestricted stocks increase free float. Conversely, companies can reduce free floats by buying back shares or consolidating shares.
Importance of Free Float for Investors
Free floats in stocks are carefully watched by investors and are an important indicator when choosing stocks. In general, stocks with small free floats are rarely invested by institutional investors. This is because such stocks are usually more volatile than stocks with large floats.
Also, stocks with small floats generally have wide bids and limited liquidity due to the limited availability of stocks on the market.
Example: Tilray – Highly volatile stocks
Tilray (TLRY) is a cannabis company based in Nanaimo, Canada, which hosted an initial public offering (IPO) in 2018 and became the first cannabis company to do this on NASDAQ. As of January 2019, the stock is currently trading at a price just below $ 100, as the IPO price is $ 17.
In September 2018, Tilray's share price rose dramatically. Specifically, on September 19, NASDAQ suspended stock trading five times due to significant price fluctuations. Tilray's share price surged 90% before it fell and eventually rose 38% to the end of the day.
The root cause of Tilray's share price volatility on September 19 was its small free float. Tilray's public float volume was 17.83 million shares, resulting in a free-float ratio of 23% (which is small compared to its peers).
Due to the small number of publicly available shares, Tilray's bid-ask spread was very high, at $ 2. Stocks witnessed a very volatile session due to the low number of stocks available and low interest in stocks.
3.1.10 Independent Float and Interfering Float
An independent float is that part of the whole float which will delay the beginning of activity without affecting the float of the previous activity calculated for activity by subtracting tail event slack from the entire float.
Therefore, the independent float is often calculated as follows:
Independent Float = Total Float – Tail Event Slack
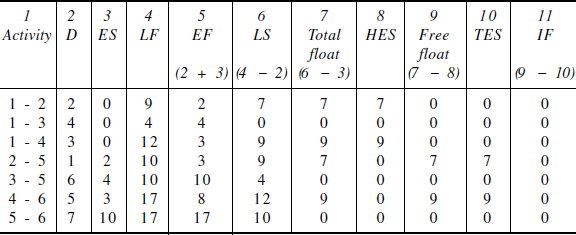
Computation of Total Float, Free Float, and Independent Float
|
Note: If you get a negative value, it's considered zero.
Interfering Float
Floating an activity can affect the float time of subsequent activities in your network. Interference floats are part of the overall float and reduce the float for subsequent activities. This is the difference between the slowest end time of the activity in question and the earliest start time of the next activity, or zero, whichever is greater. This shows the part of the float of the activity that cannot be consumed without adversely affecting the float of the subsequent activity.
Therefore, the interference float can be calculated as:
Interference Float = Latest End Time for the activity under consideration – Early start time for the next activity.
Key takeaways:
- In order to organize working project, you need to determine the most logical order to complete the project activity.
- A tool that helps you document your workflow is called a network diagram.
- Network diagrams use logical relationships between activities to identify the order in which work is completed.
- Network diagrams can help you understand how your work actually works together and create a reliable and realistic schedule for your project. Network diagrams reveal workflows as well as tasks.
- To create a network diagram, the team needs to analyze project activity and identify the relationships and constraints that exist between them.
- The network diagram above shows the activity as a box called a node. The relationship between each activity and subsequent activities is indicated by an arrow.
- The project team first determines the required external dependencies and then works to define any relationships. It is important to note that the latter is subject to change at a later date if necessary.
- In addition to identifying the various dependencies, the team needs to analyze the precedent relationships between activities.
- Keep in mind that each activity in your network has both dependencies and predecessors, except for those that you can start right away
- The relationship between activities is not always immediate. In some cases, successors may start a little earlier or may require a delay before they start.
- Precedence Diagramming Method (PDM) may be a graphic representation method. Shows activity interdependencies and is employed to make schedules. Another name for this system is Activity on Node (AON).
- The priority projection is formed from rectangles called nodes. These boxes show the activity of the project.
- Priority diagram techniques play an important role in project management. Your project schedule depends on it and it's a good communication tool.
- Dummy activities are some sort of simulated activity that has zero duration and is created solely for the purpose of showing the path of a particular relationship and action in the manner shown by the arrows.
- Free floats, also known as public floats, are shares of a company that is open-trade able and unrestricted (that is, insider-owned).
3.2.1 Meaning of Project Crashing.
I don't have enough time to manage the project. Therefore, create a schedule to manage your time enough to get the deliverables by the deadline. But even the best plans, in other words, tend to go wrong.
Project managers can't afford to quote stakeholder poems when they don't get going. Project changes are common, but it is the project manager's responsibility to ensure that those changes do not adversely affect the project schedule.
This is usually when triple constraints work range, time, budget. If one is late, the other needs to make up for the slack. There are many ways to adjust the content of your project to make up for the lost time. This includes adding resources along the way. This is a method called project crash.
What is a project crash?
A project crash is shortening the duration of a project by reducing the time for one or more tasks. The crash is done by increasing the resources to the project. This makes the task take less time than planned. Of course, this also adds to the cost of the entire project. Therefore, the main purpose of a project crash is to shorten the project while minimizing costs.
As the triple constraint says, shortening the duration or time of a project should increase costs. That's a trade-off. Crashing project management describes a triple constraint in that it either includes additional resources (as described above) to achieve it, or reduces the requirements or scope of the project. However, such drastic measures cannot be taken without the sponsor or key stakeholder agreeing to the change.
As a result of a project crash, the critical path may change and new different critical paths may appear. In project crash management, you need to go back to the project schedule and make sure you are aware of the changes that occurred there due to the project crash.
Different interpretations of project crashes
Project crash as a term is not carved into the stone and can mean several different things. It may refer to spending more money to get things done faster. It can also refer to identifying the critical path and providing more resources to it, without necessarily thinking of it as efficient. Alternatively, you can check the critical path to see if there is any activity that can be reduced by the influx of resources.
A related method for truncating a schedule is called fast-tracking. This is when you want to overlap tasks that were originally scheduled to run separately. However, this set of actions should not be performed without first analyzing its feasibility and risk. Whichever route you choose, it is always wise to think and analyze.
What are the prompts that crash in project management?
When do project managers want to increase their investment to complete a project early? After all, a lot of time and effort was spent planning and scheduling the project. Crashing a project costs more, so the project will not be used unless an emergency occurs.
One of the reasons for using project crashes was when the project was unrealistically scheduled, which wasn't clear until the project was already run. This can also happen if the sponsor, customer, or stakeholder claims an infeasible date during the planning phase.
Another reason is that during the process of change management analysis (indicating impact on time, cost, scope, or other project factors), there are issues that need immediate attention. If something goes wrong in the process of managing a project and the project doesn't get going, the project manager needs to figure out how to lock back to the schedule baseline.
As mentioned above, there are other fast-tracking methods besides project crashes. We're talking about project crashes, but it's important to mention when fast-tracking is desirable. You may be able to use either, but if your project is already over budget and out of funding, quick tracking may be an option.
Best practices when crashing a project
Project crashes are usually the last resort and are not without great risk. There are a few things to consider before moving the project on this path. Is the task trying to crash on the critical path? These tasks affect the implementation of the project. If the task is not on the critical path, you can probably ignore it.
Another thing to consider is the length of the task. Short tasks can be difficult to speed up, especially if they aren't repeated throughout the project. Long tasks usually have some fat to trim. However, you need to make the resources available regardless of the task. If you don't have access to the right resources, it doesn't make sense for your project to crash. Having to get new resources and team members can be too costly to be effective.
Balance team workloads for efficient project crashes
Use the workload page to ensure that your project's crash management plan does not overload one part of your team and that other teams are not under-assigned. Color-coded graphs make it easy to see who has too many tasks, balance workloads, and assign them to project crashes.
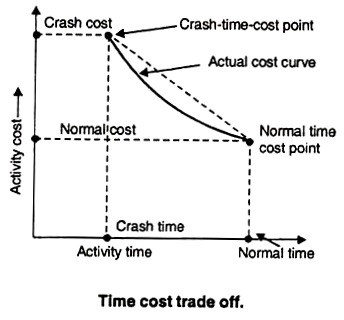
3.2.2 Concepts: Normal Time, Normal Cost, Crash Time, Crash Cost of Activities. Cost Slope of an Activity.
The normal cost is the lowest possible direct cost required to complete an activity.
Normal Time:
This is the time required when activities are performed in a normal way. It is usually the longest time for the project and entails money saving is there.
Crash Time:
This is the time in which the activity will be taken up on a crash basis for accomplishing. It indicates the shortest time for accomplishing the activity but money is not the criterion.
Crash Cost:
The cost involved when activity is performed on a crash basis without consideration of the costs involved. Time-saving is the main criterion.
Activity cost slope.
Activity cost slope is the rate of increase in the cost of activity per unit with a decrease in time. The cost slope indicates the additional cost incurred per unit of time saved in reducing the duration of an activity.
Activity Cost slope =crash cost – Normal cost x Normal time – Crash time
3.2.3 Costs involved in Project Crashing: Numerical with Direct, Indirect, Penalty, crash cost, and Total Costs.
There are two types of costs associated with a project:
(i) Direct costs:
It represents the expenditure which can be allocated to different activities in a project, like manpower, material, etc.
(ii) Indirect costs:
It represents the expenditure on those items which are shared by more than one activity and cannot be directly allocated to the individual activity of a project. Indirect costs of a project are those expenditures that cannot be apportioned or allocated to the individual activity. These include the expenditure related to the administration and establishment charges, overhead, supervision, loss of revenue, etc.
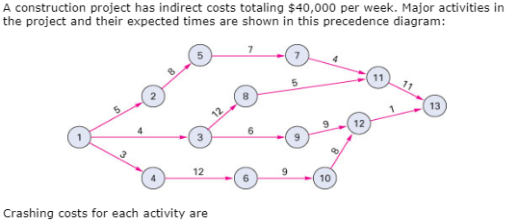
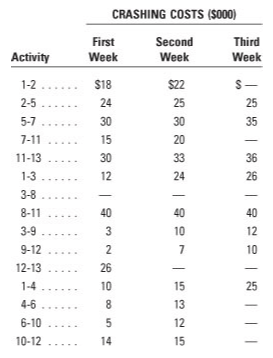
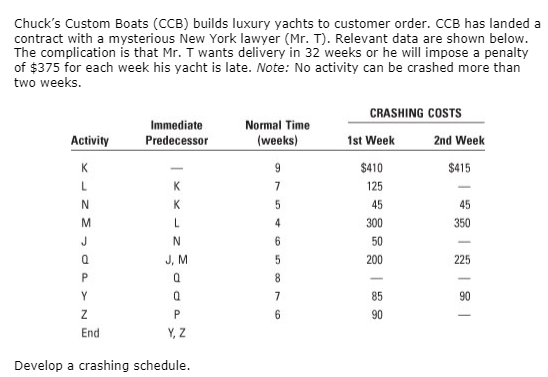
Numerical
|
|
a. Determine the optimum time-cost crashing plan.
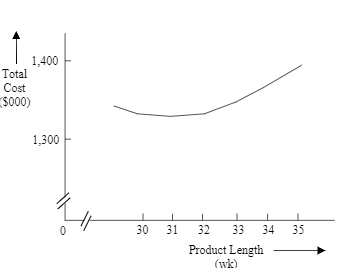
b. Plot the total-cost curve that describes the least expensive crashing schedule
that will reduce the project length by six weeks.
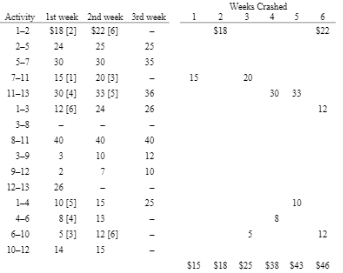
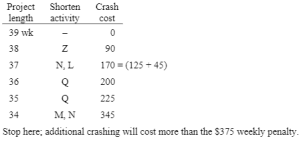
Solution:
|
|
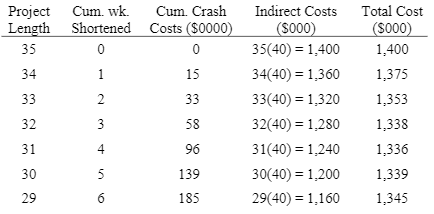
Summary:
|
|
|
Solution
|
|
3.2.4 Time-Cost Trade-off in Project Crashing.
Crash and time/cost trade-off
|
Linear cost
In the previous section, the duration of activity was described as a fixed number or random number with known characteristics. However, the duration of activity can vary depending on the type and amount of resources applied. Assigning more workers to a particular activity usually results in a shorter time. However, increasing speed can increase costs and reduce quality. This section examines the impact of time, cost, and quality trade-offs during activity periods. This process describes the procedure for crashing a project, as described below.
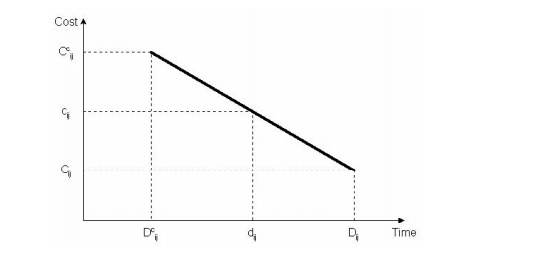
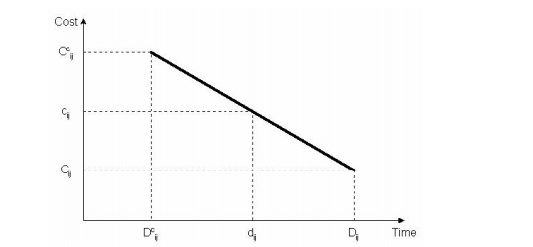
Figure 2-3 shows a simple representation of the possible relationship between the duration of the activity and its direct cost. Considering this activity alone and without reference to the project completion deadline, the manager will undoubtedly choose a period that means the lowest direct cost represented by Dij and Cij in the figure. Unfortunately, each activity
Scheduled for such periods of direct cost minimization can result in significant penalties associated with delaying the start of the project due to too long a time to complete the entire project. This is a small example of sub-optimization, where small components of a project are optimized or improved, resulting in poor overall project performance. Avoiding this partial optimization issue is a basic concern of project managers.
In the other extreme example, the manager may choose to complete the activity in the shortest possible time Dc, but at a higher cost Ccijij. This minimum completion time is commonly referred to as the activity crash time. The linear relationship shown in the figure between these two points means that any intermediate period can be selected. Some midpoints can represent the ideal or optimal trade-off between the time and cost of this activity.
|
Linear cost activity
What is the reason for the direct cost increase as the activity period is shortened?
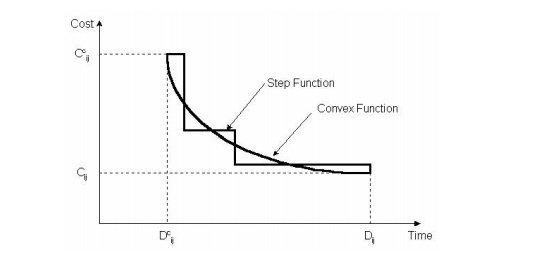
Simple cases occur with the use of overtime. Scheduling work on weekends or evenings reduces the completion time of activities measured on calendar days. However, such overtime costs are high because of the extra wages required. Overtime is also prone to accidents and quality problems and needs to be corrected, which can increase overhead costs. More generally, you may not expect a linear relationship between duration and direct cost, but there are convex functions such as nonlinear curves and step functions shown in Figure 11-4. However, linear functions can be a good approximation of the actual curve, greatly simplifying the analysis.
|
Non-Linear Cost
Because of the linear relationship between cost and duration, the critical path time/cost trade-off problem is often defined as an applied mathematics optimization problem especially Rij
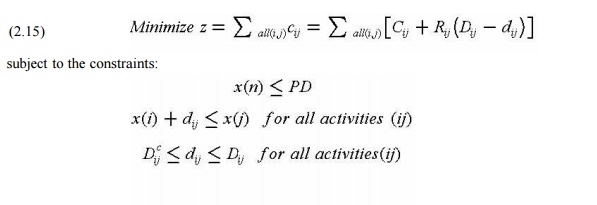
The rate at which the cost changes as the period shortens, as shown by the absolute value of the slope of the line in Figure 11-3. Then the direct cost to complete the activity is:
|
Here, the lowercase cij and dij represent the scheduled duration of the activity ij and the cost of the result. You also need to impose priority constraints on each activity, as described above. Finally, you need to define the completion times required for your project, or otherwise the costs associated with the various completion times. Therefore, the overall scheduling issues are constraints related to (1) desired project duration PD, (2) possible minimum and maximum activity durations, and (3) activity priority or completion times. Algebraically, this is:
|
Here, the notation is defined above and the factors are the activity period dij and the event.
x (k) times. By repeatedly resolving this issue for different project duration PDs, you can find a suitable schedule for different project durations. The entire problem can be solved by a more efficient algorithm that utilizes linear programming or a special network of problem constraints.
One solution to the time-cost trade-off problem is of particular interest and is worth mentioning here. The minimum time to finish a project is named the project crash time. This minimum completion time can be found by setting all activity periods to the minimum value (Dcij) and applying critical path scheduling. This minimum completion time for a project can be used in the time cost scheduling problem above to determine the minimum crash cost for a project. Note that setting each activity to crash duration and summing the resulting costs does not detect the project crash cost. This solution is called the project crash time.
This minimum completion time can be found by setting all activity periods to and applying critical path scheduling their minimum value (Dcij). This minimum project completion time can be used in the following locations:
The time cost scheduling problem above to determine the minimum crash cost for a project. Note that setting each activity to crash duration and summing the resulting costs does not detect the project crash cost. This solution is called all-crash cost. It is beneficial to change all crash schedules to reduce costs, as some activities are not on the critical path that can be allocated longer periods without delaying the project.
A heuristic approach to the time-cost trade-off issue is also possible. In particular, the simple approach is to apply critical path scheduling first and assume that all activity periods have the lowest cost (Dij). Then the planner can look at the critical activity
Pass and reduce the scheduled duration of the activity with the least cost increase. In essence, the planner creates a list of activities on the critical path ranked according to cost unit changes to reduce activity duration. Heuristic solutions work by shortening activities in ascending order of cost impact. Since the activity period on the shortest path is shortened, the project period is also shortened. Eventually, another path becomes critical and you need to prepare a new list of activities on the critical path. This kind of manual or automatic adjustment is appropriate but not always the optimal schedule can be identified. The best or best schedule is only guaranteed by looking at changes in a combination of activities and changes in a single activity. However, with the adjustment of a specific activity period (and its cost)
The critical path scheduling procedure allows the planner to devise a short schedule fairly quickly in time for a particular project deadline, or at worst realize that it is impossible to meet the deadline.
This type of heuristic approach to the time-cost trade-off is important if the time-cost trade-off for every activity isn't known beforehand or if the project's resources are constrained. In such cases, heuristic research determines if more effort needs to be spent estimating the time-cost trade-off, or if additional resources need to be reserved for the project useful for. In many cases, the basic time-cost trade-off is not a smooth curve as shown in Figure 11-4, but only a set of specific resource and schedule combinations that generate a specific period. For example, the planner may have the option of assigning one or two crew members to a particular activity. In this case, there are only two possible periods of interest.
Example 2-4: time-cost trade-off
Building a permanent transitway at the median highway represents a potential time-cost trade-off in construction work. One section of the 10-mile transitway was built in 1985 and 1986, and the existing contraflow lane system (one lane of the highway is flipped daily to provide additional capacity in the peak flow direction) has been replaced. Three engineer estimates have been made for working hours.
z 975 calendar days, supported 750 business days with 5 days/week and eight hours/day work, and 30 days of inclemency, weekends, and holidays.
z 702 calendar days, 6 days/week, and 10 hours/day work based on 540 business days. z Based on 360 calendar days, 7 days/week, and 24 hours/day work.
Operational savings in the Contraflow Lane and savings from early completion due to contract management costs were estimated at $ 5,000 per day.
In accepting the bid for this construction work, the owner requested both the amount and the completion date. The bidder's completion date had to be between 360 and 540 days. In the evaluation of contract bids, a credit of $ 5,000 was granted every day less than 540 days that the bidder specified to complete. Ultimately, the winning bidder completed the project in 270 days and received a bonus of 5,000 * (540-270) = $ 450,000 on a $ 8,200,000 contract. However, contractors have experienced 15 to 30 percent higher costs to maintain an ongoing work schedule.
3.2.5 Optimal (Minimum) Project Cost and Optimal Project Completion Time.
To optimize the cost of your project in terms of time by maximizing the crash of your activity, follow these steps:
I. Use the normal execution time of each activity to find the critical path, normal project completion time. It also finds the normal total cost according to the given data.
II. Find the crash cost slope for each important activity, select the activity with the lowest crash cost slope, and crash first. If the two or more important activities found have the lowest cost but are equal, select the activity as follows:
- When another path in the network can become important by reducing the total time.
- Activities that can crash in more time units.
- After crashing the critical activity according to Rule II, check for a new critical path. If so, identify all important activities and crash them according to Rule II.
- After crashing all important activities for as short a time as possible, stop the procedure and determine the total cost of the project for all periods, including normal and crash periods. Choose the best project period with the lowest total cost.
Example 1:
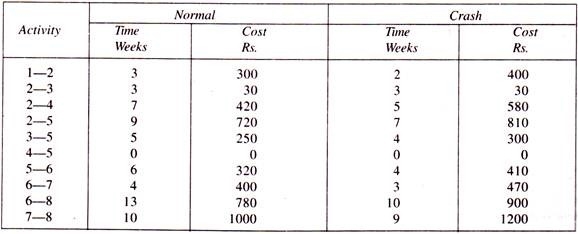
The following table shows data on normal time and cost, and crash time and cost when the project overhead is Rs. 50 a week. Draw a network diagram to identify the critical path. Find out the total number of floats associated with each activity.
|
Systematically crash-related activities to determine the best project completion time and cost.
Solution:
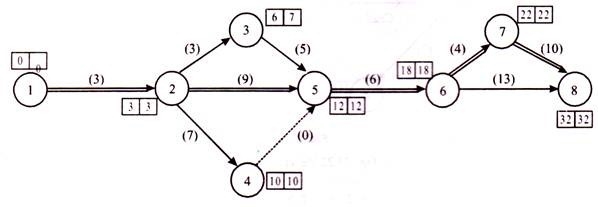
The network diagram is shown in the Figure below. The critical path is identified as 1-2-5-6-7-8. The typical project period is 32 weeks from the critical path indicated by the double line.
Related costs = direct normal costs + 32 weeks indirect costs.
Direct Normal Cost Related Cost = Sum of Normal Costs for All Activities
Related cost = rupee. 4220 = 4220 -1- 50 X 32 = Rs. 5,820
|
|
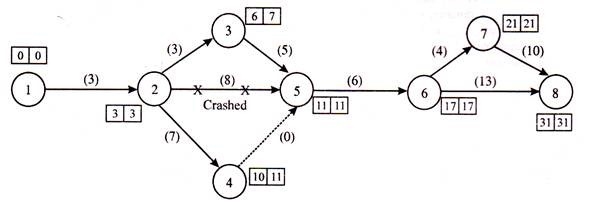
The following table shows the following crash cost slopes: The minimum crash cost slope for activities 2-5 and 5-6 was found. Activities 2-5 can crash in 2 weeks according to the information in question, but they do. In just one week, you will see the parallel critical path 1-2-3-5-6-7-8.
|
If you crash activity 2–5 in a week, only two parallel critical paths are observed 1–2–5–6–7–8 and 1-2-3-5-6-7-8. The new network diagram is shown in Figure 23.21. The total duration of the project is 31 weeks. Total cost with a new network diagram.
= Total direct normal cost + Crash cost + Indirect cost Activity crash cost (i, j) = ∑ [Activity crash time (i, j) x Activity crash cost slope (i, j)] Total cost = 4,220 + (1 x 45) + (31 x 50) = Rs 5,815
|
Again, calculate the slope of the crash cost for the new critical path in Figure above The following table shows it.
|
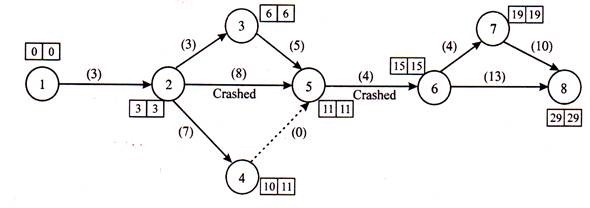
We found that activities 5-6 had the lowest value and could crash in 2 weeks. The total duration of the project will be 29 weeks. The new network diagram is shown in Figure below:
|
By crashing 5-6 activities in 2 weeks.
Total cost = 4,220 + (1 x 45) + (2 x 45) + (29 x 50) = Rupees 5,805 Other paths with a project duration of 29 weeks or more will not be displayed, so the critical path will not change. Also, we can see that the minimum crash cost slope is Rs. It's 70 for activities 6-7 and can crash in a week.
Crash the activity 6-7 times a week.
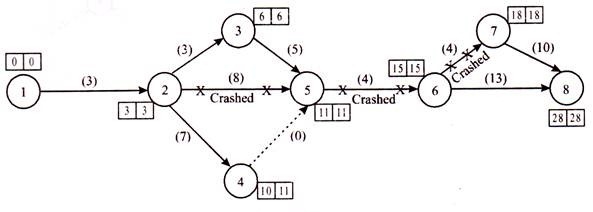
The total duration of the project is 28 weeks and the new network diagram is shown in Figure below:
|
Now the other pass is the important 1-2 5 – 6 – 8 for 28 weeks.
Total cost = 4220 + (1 x 45) + (2 x 45) + (1 x 70) + (28 x 50) = Rupees 5,8254 times Compare all total costs.
Crash cost is not Rs. 5820
A 2-5 cost crash is rupees. 5815
The cost crash of 2-5 and 5-6 is rupees. At least 5805
The crash cost for 2-5, 5-6, 6-7 is rupees. 5825
The lowest cost is obtained by crashing activities 2-5 for 1 week and activities 5-6 for 2 weeks. If the crash continues, the total cost will increase. Therefore, the optimal project duration is 29 weeks and the optimal cost is Rs. 5805.
Comment:
From the above analysis, we can see that an activity crash is only economical if its crash cost slope is less than the indirect cost per unit time. Therefore, you only need to crash activities that have a low crash cost slope. When all such activity crashes are over, you should stop the analysis.
In the above issue, the slope of the crash cost for activities 6-7 is Rs. It costs more than 70 rupees. 50 a week, that's why we know that total project costs are increasing. In this issue, the analysis may stop in 2 weeks after the activity crashes 5-6 times.
3.2.6 Process of Project Crashing.
Project crash management phase
Once you decide to use the project crash, there are some steps you need to take to get the results you want.
1. Critical path
This will help you determine which tasks you can shorten to finish your project faster. So, if you haven't done so already, calculate the critical path to see which tasks are essential and which are second only to the success of your project.
2. Identify the task
Get a list of all the tasks you have and meet the people assigned to complete them. Ask if you believe that one of the tasks you are in charge of is on the critical path and can be reduced. Then start looking for ways to enhance those tasks.
3. What are the trade-offs?
Once you've narrowed down the critical path tasks that you think you can shorten, start calculating the cost of adding resources. Find a task that you can allocate additional resources to, minimize your budget burden, and join faster.
4. Select
Once you know what you need to spend on each task in the critical path (compared to the time you save), you need to make the next decision and choose the cheapest method. Project crashes not only add resources to speed things up, but also take full advantage of the extra cost.
5. Make a budget
As with any project, once you make a plan, you have to pay for it. Creating a project crash budget is the next step in implementing a project crash plan. Baselines, schedules, and resource plans need to be updated to meet new initiatives.
How ProjectManager.com Makes Project Crash Easy
Project crashes involve understanding resources and then reallocating them. If time is working against you, this process should be as efficient as possible. ProjectManager.com is award-winning software that tracks resources, teams, and projects to increase your productivity.
Our resource management software is cloud-based. That is, the data displayed is as up-to-date as possible for the project resource. You can also visualize what your team is doing, including costs. This allows you to make better decisions.
Resource cost tracking
You can identify all resources from your team, including consumables and equipment. If you add an hourly wage to your project, you can see the hourly wage in all software features. When the team records the time, the actual cost is calculated. Then you can compare them to your planned costs so you can quickly see if you're meeting your goals.
|
3.2.7 Numerical Consisting of Maximum Ten (10) Activities.
Example 1
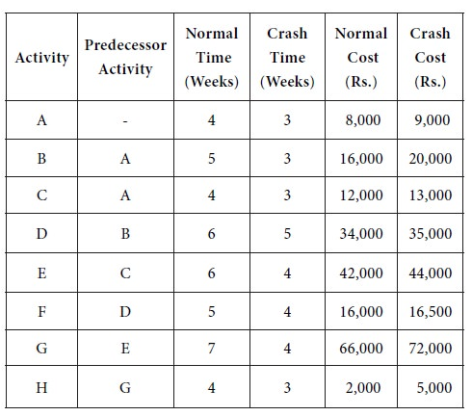
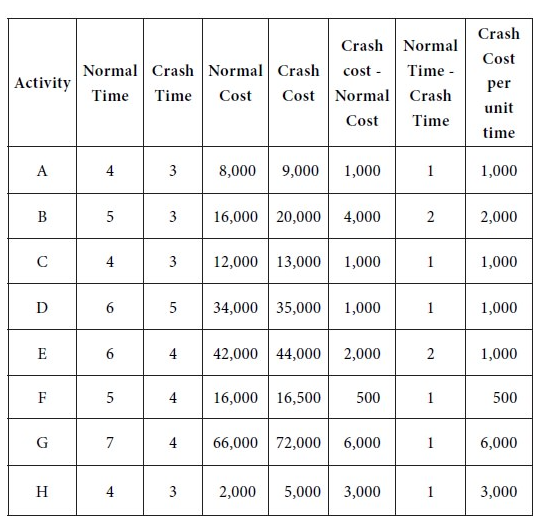
A project has activities with the following normal and crash times and cost:
|
Determine a crashing scheme for the above project so that the total project time is reduced by 3 weeks.
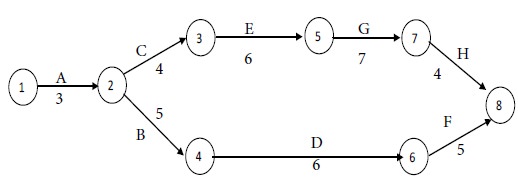
Solution
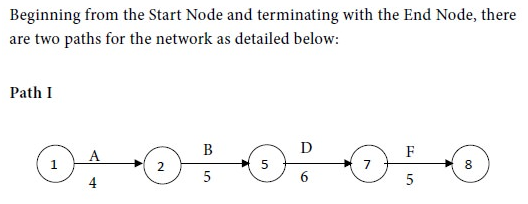
We have the following network diagram for the given project with normal costs:
|
|
|
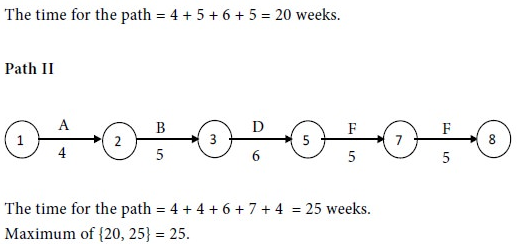
Therefore Path II is the critical path and the critical activities are A, C, E, G, and H. The non-critical activities are B, D, and F.
Given that the normal time of activity A is 4 weeks while its crash time is 3 weeks. Hence the time of this activity can be reduced by one week if the management is prepared to spend an additional amount. However, the time cannot be reduced by more than one week even if the management may be prepared to spend more money. The normal cost of this activity is Rs. 8,000 whereas the crash cost is Rs. 9,000. From this, we see that crashing activity A by one week will cost the management an extra amount of Rs. 1,000. Similarly, we can work out the crash cost per unit time for the other activities also. The results are provided in the following table.
|
A non-critical activity can be delayed without delaying the execution of the whole project. But, if a critical activity is delayed, it will delay the whole project. Because of this reason, we have to select a critical activity for crashing. Here we have to choose one of the activities A, C, E, G, and H The crash cost per unit time works out as follows:
Rs. 1,000 for A; Rs. 1,000 for C; Rs. 1,000 for E; Rs. 6,000 for G; Rs. 3,000 for H.
The maximum among them is Rs. 1,000. So we have to choose an activity with Rs.1,000 as the crash cost per unit time. However, there is a tie among A, C, and E. The tie can be resolved arbitrarily. Let us select A for crashing. We reduce the time of A by one week by spending an extra amount of Rs. 1,000.
After this step, we have the following network with the revised times for the activities:
|
The revised time for Path I = 3 + 5 + 6 + 5 = 19 weeks.
The time for Path II = 3 + 4 + 6 + 7 + 4 = 24 weeks.
Maximum of {19, 24} = 24.
Therefore Path II is the critical path and the critical activities are A, C, E, G, and H. However, the time for A cannot be reduced further. Therefore, we have to consider C, E, G, and H for crashing. Among them, C and E have the least crash cost per unit time. The tie between C and E can be resolved arbitrarily. Suppose we reduce the time of C by one week with an extra cost of Rs. 1,000.
After this step, we have the following network with the revised times for the activities:
|
The time for Path I = 3 + 5 + 6 + 5 = 19 weeks.
The time for Path II = 3 + 3 + 6 + 7 + 4 = 23 weeks.
Maximum of {19, 23} = 23.
Therefore Path II is the critical path and the critical activities are A, C, E, G, and H. Now the time for A or C cannot be reduced further. Therefore, we have to consider E, G, and H for crashing. Among them, E has the least crash cost per unit time. Hence we reduce the time of E by one week with an extra cost of Rs. 1,000.
By the given condition, we have to reduce the project time by 3 weeks. Since this has been accomplished, we stop with this step.
Result: We have arrived at the following crashing scheme for the given project:
Reduce the time of A, C, and E by one week each.
Project time after crashing is 22 weeks.
Extra amount required = 1,000 + 1,000 + 1,000 = Rs. 3,000.
3.2.8 Numerical based on Maximum Four (04) Iterations of Crashing
The table below shows the normal time & cost and crash time & cost of the various activities in a project. Find the optimum duration and minimum project cost, assuming the indirect cost of the project as Rs. 200/week.
Activity | Normal Time(weeks) | Normal Cost(Rs.) | Crash Time(weeks) | Crash Cost(Rs.) |
1-2 | 7 | 700 | 4 | 50 |
1-3 | 5 | 500 | 3 | 100 |
1-4 | 8 | 600 | 5 | 200 |
2-5 | 9 | 800 | 7 | 225 |
3-5 | 5 | 700 | 3 | 150 |
3-6 | 6 | 1100 | 5 | 200 |
4-6 | 7 | 1200 | 5 | 125 |
5-7 | 2 | 400 | 1 | 100 |
6-7 | 3 | 500 | 2 | 350 |
Total: |
| 6500 |
|
|
Solution:
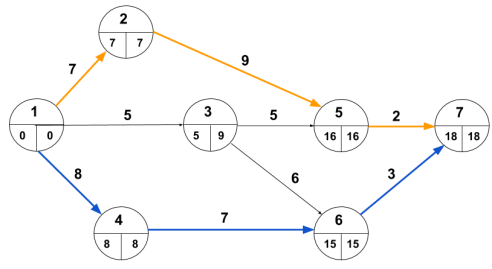
Starting by constructing the Network Diagram and finding project completion time using the Critical Path Method.
|
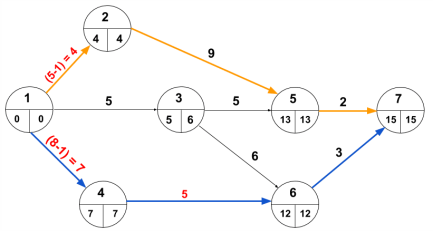
It can be seen from the network diagram, we have more than one critical path generated, i.e. here we have two critical paths as marked in orange and blue color, as follows:
Critical Paths:
1-2-5-7: Project completion 18 weeks
1-4-6-7: Project completion 18 weeks
Project completion time and cost:
Project completion time= 18 days
Project completion cost=Normal cost+Indirect cost for 12 days
=6500+(18 ⋅ 200)=Rs. 10,100
Now,
Let us move to the crashing of this numerical;
Crashing:
Evaluating cost slope for different activities:
Activity | Normal Time(weeks) | Normal Cost(Rs.) | Crash Time(weeks) | Crash Cost(Rs.) | Cost Slope |
1-2 | 7 | 700 | 4 | 50 | 50 |
1-3 | 5 | 500 | 3 | 100 | 100 |
1-4 | 8 | 600 | 5 | 200 | 200 |
2-5 | 9 | 800 | 7 | 225 | 225 |
3-5 | 5 | 700 | 3 | 150 | 150 |
3-6 | 6 | 1100 | 5 | 200 | 200 |
4-6 | 7 | 1200 | 5 | 125 | 125 |
5-7 | 2 | 400 | 1 | 100 | 100 |
6-7 | 3 | 500 | 2 | 350 | 350 |
Total: |
| 6500 |
|
|
|
As it can be seen, cost slopes for different activities are evaluated in the table. Also, critical path activities are marked with their path colors (i.e. Orange and Blue).
Now, as per the method, we will be selecting the critical activity with the lowest cost slope. So, we have activities 1-2 with the lowest cost slope of 50 Rs.
So, crashing activity 1-2 directly by 4 weeks.
We will find that the project completion time will remain the same. This is happening because we have another parallel critical path.
We are trying to reduce the total project completion time up to 3 weeks by crashing activity 1-2 directly by 4 weeks.
If we carried out parallel crashing, then we can avoid this problem. This is because both paths will be crashed together, and both will reduce the duration.
| |||||
Activity | Normal Time(weeks) | Normal Cost(Rs.) | Crash Time(weeks) | Crash Cost(Rs.) | Cost Slope |
1-2 | 7 | 700 | 4 | 50 | 50 # |
1-3 | 5 | 500 | 3 | 100 | 100 |
1-4 | 8 | 600 | 5 | 200 | 200 |
2-5 | 9 | 800 | 7 | 225 | 225 |
3-5 | 5 | 700 | 3 | 150 | 150 |
3-6 | 6 | 1100 | 5 | 200 | 200 |
4-6 | 7 | 1200 | 5 | 125 | 125 # |
5-7 | 2 | 400 | 1 | 100 | 100 |
6-7 | 3 | 500 | 2 | 350 | 350 |
Total: |
| 6500 |
|
|
|
As you can see, the "#" mark is used to mark minimum cost slopes. Let us now crash both paths simultaneously.
We have a crash time of 4 weeks for activities 1-2 with a normal time of 7 weeks.
And for activity 4-6, the crash time is 5 weeks and the normal time is 7 weeks
If we crash both paths by 1 week, then we will find that 1 week is reduced in project duration.
You can crash an activity by steps up to provided crash time.
- For activities 4-6, the crash time is 5 weeks.
- In the first step, we will reduce its normal time by 1 week, i.e. (7-1) = 6 weeks.
- Again crashing it by 1 week, i.e. (6-1) = 5 weeks.
- And now, we can see that the activity 4-6 is reduced to 5 weeks and which equals to the crash time so provided.
- So, after this, we cannot crash this activity as we don't know the cost applicable to the reduction in 1 or more weeks than 5 weeks. So, we stop step-by-step crashing there.
We will add a column to our existing table as follows:
Activity | Normal Time(weeks) | Normal Cost(Rs.) | Crash Time(weeks) | Crash Cost(Rs.) | Cost Slope | Crashing limit |
1-2 | 7 | 700 | 4 | 50 | 50 # | (7-4)=3 |
1-3 | 5 | 500 | 3 | 100 | 100 |
|
1-4 | 8 | 600 | 5 | 200 | 200 |
|
2-5 | 9 | 800 | 7 | 225 | 225 |
|
3-5 | 5 | 700 | 3 | 150 | 150 |
|
3-6 | 6 | 1100 | 5 | 200 | 200 |
|
4-6 | 7 | 1200 | 5 | 125 | 125 # | (7-5)=2 |
5-7 | 2 | 400 | 1 | 100 | 100 |
|
6-7 | 3 | 500 | 2 | 350 | 350 |
|
Total: |
| 6500 |
|
|
|
|
The crashing limit is already added for the required activities. We get;
Crashing limit as:
3 for 1-2
2 for 4-6
So, we will go with the minimum limit, so that both the paths will have the same reduction in the duration.
Iteration 1:
Crashing both activities 1-2 & 4-6 directly by 2 weeks.
Activity | Normal Time(wk) | Normal Cost(Rs.) | Crash Time(wk) | Crash Cost(Rs.) | Cost Slope | Crashing limit |
1-2 | 7 | 700 | 4 | 50 | 50 ## | 3 | | | |
1-3 | 5 | 500 | 3 | 100 | 100 |
|
1-4 | 8 | 600 | 5 | 200 | 200 |
|
2-5 | 9 | 800 | 7 | 225 | 225 |
|
3-5 | 5 | 700 | 3 | 150 | 150 |
|
3-6 | 6 | 1100 | 5 | 200 | 200 |
|
4-6 | 7 | 1200 | 5 | 125 | 125 # | 2 | | |
5-7 | 2 | 400 | 1 | 100 | 100 |
|
6-7 | 3 | 500 | 2 | 350 | 350 |
|
Total: |
| 6500 |
|
|
|
|
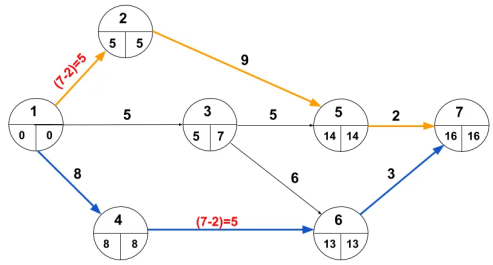
New network diagram formed as follows:
|
As we can see in the above diagram, both activities are crashed for 2 weeks. And, the project completion time is also reduced by 2 weeks, i.e. 16 weeks.
Critical Paths:
1-2-5-7: Project completion 16 weeks
1-4-6-7: Project completion 16 weeks
Also,
New project completion time= 16 weeks New project completion cost=cost obtained in last step−Indirect cost for 2 weeks
+Cost slopes of activity 1-2 for 2 weeks
+Cost slope of activity 4-6 for 2 weeks
=10,100−(2 ⋅ 200)+(2 ⋅ 50)+(2 ⋅ 125)
=Rs. 10,050
Here, we added the cost of reduction by 2 weeks for both activities, because if we crash single activity we cannot reduce the total time of the project.
So, we have to pay 100 Rs. to reduce the time of activity 1-2 by 2 weeks, as well as we have to pay 250 Rs. to reduce the time of activity 4-6 by 2 weeks.
Let us move to the next step of crashing the same way.
Iteration 2:
As it can be seen, the number of bars from crashing limit against 1-2 & 4-6 are struck out. Strike number of weeks you have already crashed, i.e. 2 strikes for both activities.
So, I will now take advantage of 1 week of activity 1-2.
Activity | Normal Time(wk) | Normal Cost(Rs.) | Crash Time(wk) | Crash Cost(Rs.) | Cost Slope | Crashing limit |
1-2 | 7 | 700 | 4 | 50 | 50 ## | 3 | | | |
1-3 | 5 | 500 | 3 | 100 | 100 |
|
1-4 | 8 | 600 | 5 | 200 | 200 ## | 3 | | | |
2-5 | 9 | 800 | 7 | 225 | 225 |
|
3-5 | 5 | 700 | 3 | 150 | 150 |
|
3-6 | 6 | 1100 | 5 | 200 | 200 |
|
4-6 | 7 | 1200 | 5 | 125 | 125 # | 2 | | |
5-7 | 2 | 400 | 1 | 100 | 100 |
|
6-7 | 3 | 500 | 2 | 350 | 350 |
|
Total: |
| 6500 |
|
|
|
|
Now, for this next iteration while we are selecting the minimum cost for both paths, I will select as following:
Crashing activity 1-2 by 1 week for critical path 1-2-5-7.
And,
Crashing activity 1-4 by 1 week for critical path 1-4-6-7.
Selecting crashing by 1 week, as it minimum crashing limit among 1-2 & 1-4.
Also, marking "##" for the second iteration of parallel crashing.
New network diagram formed as follows:
|
Crashing Iteration: 2
So, we get;
New project completion time= 15 days New project completion cost=cost obtained in last step−Indirect cost for 1 week
+Cost slope of activity 1-2 for 1 week
+Cost slope of activity 1-4 for 1 week
=10,050−(1 ⋅ 200)+(1 ⋅ 50)+(1 ⋅ 200)=Rs. 10,100
We can conclude that by this is iteration-2 the Project cost increases than the last iteration-1.
So, we get;
Optimum project completion time=16 weeks
Minimum project cost=Rs.10,050
Key takeaways:
- Project managers can't afford to quote stakeholder poems when they don't get going. Project changes are common, but it is the project manager's responsibility to ensure that those changes do not adversely affect the project schedule.
- A project crash is shortening the duration of a project by reducing the time for one or more tasks.
- The crash is done by increasing the resources to the project. This makes the task take less time than planned.
- Project crash as a term is not carved into the stone and can mean several different things. It may refer to spending more money to get things done faster.
- It can also refer to identifying the critical path and providing more resources to it, without necessarily thinking of it as efficient.
- A related method for truncating a schedule is called fast tracking. This is when you want to overlap tasks that were originally scheduled to run separately.
- One of the reasons for using project crashes was when the project was unrealistically scheduled, which wasn't clear until the project was already run.
- Project crashes are usually a last resort and are not without great risk. There are a few things to consider before moving the project on this path.
- Simple cases occur with the use of overtime. Scheduling work on weekends or evenings reduces the completion time of activities measured on calendar days.
- To optimize the cost of your project in terms of time by maximizing the crash of your activity.
- Once you decide to use the project crash, there are some steps you need to take to get the results you want.
- Project crashes involve understanding resources and then reallocating them. If time is working against you, this process should be as efficient as possible.
3.3.1 Three Time Estimates of PERT: Optimistic Time (a), Most Likely Time (m), and Pessimistic Time (b).
Expected Time (Te) of an Activity Using Three Time Estimates.
PERT has three different activity period estimates.
1. Optimistic
2. Pessimistic
3. Most likely
1. The optimistic time represented by "to" is an estimate of the minimum possible time that an activity can be completed, assuming everything is going well as planned and the difficulty is minimal.
2. The pessimistic time represented by "tp" can complete the activity, assuming that things may not be in line with the plan and the activity may be difficult to carry out. Represents an estimate of the maximum possible time
3. The most likely time, represented by "tm", is an estimate of the time it takes for the activity to complete. This should be done in the usual way, and if the activity is repeated several times, in most cases, it is neither optimistic nor pessimistic. It will be completed within the time represented by t.
From the three different estimates above, PERT suggests working from the expected time, represented as "te", assuming that the probability distribution for the activity period follows a beta distribution. Therefore, te is the average of tp and tm calculated as:
te = to + 4 x tm + tp / 6
This averaging is explained by assuming that for all activities, if tij is estimated 6 times, such an estimated time pattern is 1 time t0 4 times tm and 1 time tp. This can be expressed on a time scale as follows for to = 3, tp = 9, tm = 6.
te = to + 4 x tm + tp / 6 = 3 + 24 + 9/6 = 6; When three estimates are placed on the time scale.
When placed on the timescale, the above three estimates look likes this:
|
If the probabilities follow a beta distribution (assumed by PERT), on a time scale, time unit 12 represents 100% probability, and time unit 6 is 0.5 or 50% probability. The most likely estimate is a probability of 0.5. As mentioned in the averaging equation, the weights of tm and tp are 1, 4, and 1, respectively.
The time scales 0 to 2, 2 to 6 for 1/6 th = 0.17 are 0.33, 6 to 10 are 0.33, and 10 to 12 are 0.17. Therefore, the probability of tm is between 2 and 10. That is, 0.33 + 0.33 = 0.66.
PERT considers te as a more probable time estimate of activity, and network construction and critical paths are drawn taking into account the te of each activity.
The te estimates described here also take into account the longest and shortest time estimates possible and provide a 50% chance of being more reliable. Once the te is calculated for each activity, the network can be built according to the same principles described above, as shown below.
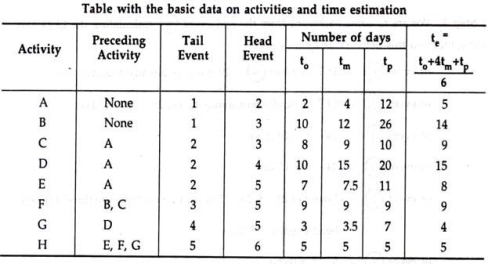
From three different time estimates, te is calculated for each of the above activities.
The network is built with PERT according to te developed from three different time estimates shown below.
|
The network diagram above shows all the various time estimates and calculations for the associated activity. However, there are no specific rules for writing such estimates on the network.
|
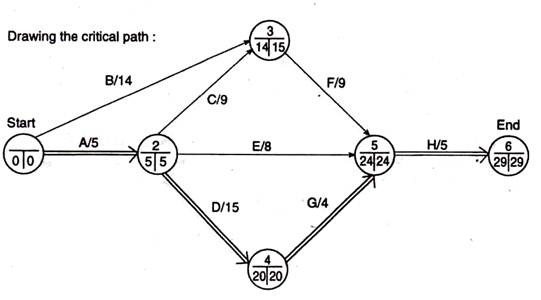
Now re-draft the network using only te (to make the diagram easier to understand) and follow these steps to create the critical path.
Step 1 Calculate the EST and plot it on the network as detailed below.
Event ① = Start from 0;
Event ② = Tail EST + te, that is, 0 + 5 = 5 days
Event ③ = 0 + 14 days;
Event ④ = 5 + 15 = 20 days
Event ⑤ = 14 + 9, 5 + 8, and 20 + 4 maximums (because there are different tail events) = 24 days.
Event ⑥ = 24 + 5 = 29 days
Step 2 Return from end event ⑥.
Calculate the LFT and plot it on this network as follows:
Event ∥ = Event EST (6) = 29th, already found in step 1.
Event ⑤ = LFT of head event minus te, that is, 29-5 = 24 days.
Event ④ = 24 – 4 = 20 days;
Event ③ = 24 – 9 = 15 days;
Event ② = minimum 24 – 8,20 – 15 and 15-9 (because there are 3 different head events) = 5 days.
Event ① = 5-5 = 0 days.
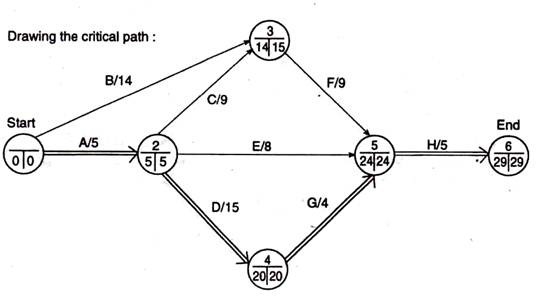
Using the EST and LFT calculated as detailed in Steps 1 and 2 above, create a network diagram as follows:
|
Step 3:
We know that events with the same EST and LFT are on the critical path, so we know they are 1, 2, 3, 4, 5, and 6. The critical path is indicated by a double-lined arrow and the project duration is 29 days. ..
It is subject to random variation in actual performance time for 5, 15, 4, and 5 hours te (estimated PERT time) of activity on the critical path.
Therefore, the actual time to perform the four activities A, D, G, and H represents the time to complete the project, and PERT calculates the probability of achieving a time goal by statistical theory.
3.3.2 Difference between CPM and PERT.
Project management can be defined as a structural way to plan, schedule, run, monitor, and control the various phases of a project. PERT and CPM are two project management techniques that all managers need to implement to reach their project goals on time. These techniques help you view the progress of your project and a set of actions and events.
Meaning of PERT
Program Evaluation and Review Technology (PERT) is an activity to understand project planning, placement, scheduling, coordination, and management. This program will help you understand the research techniques taken to complete the project and identify the minimum and minimum time required to complete the entire project. PERT was developed in the 1950s for the cost and time of the project.
Example:
|
Meaning of CPM
- The critical path method (CPM) is a well-known project modeling technique in project management. This is a resource that utilizes an algorithm developed by James Kelly and Morgan Walker in the 1950s.
- CPM is primarily used in projects to determine critical and non-critical tasks that help prevent conflicts and reduce bottlenecks.
- In essence, CPM is the selection of paths within a project that will help you calculate the minimum amount of time required to complete a task with minimal waste.
- The critical path method or CPM has been used in many industries starting with defense, construction, software, aerospace, and more.
Benefits of CPM
- Provides an overview of long-term project coordination and planning
- Recognize important activities
- Easy to plan, schedule and manage projects
- Improves productivity
- Manage the resources you need
Disadvantages of CPM
- Difficult to understand for beginners
- Software is too expensive
- It may take too long to build a CPM
- You can't manage and shape the schedule of people involved in the project
- Unable to properly monitor resource allocation
CPM example
|
How to create a PERT chart?
To create a PERT chart, you need to follow these steps:
- Recognize specific projects and milestones.
- Determine the exact order of the projects.
- Create a network diagram.
- Determine the time required for each project activity.
- Manage the critical path.
- Update the PERT diagram as the project progresses.
Project management CPM
The project management critical path method is a step-by-step method used in the planning process that describes the critical and non-critical activities of a project. The goal of CPM is to identify time-limited issues and processes that cause project blockage. CPM should preferably apply to projects that include various activities related to complex methods. When CPM is applied, it helps keep the project going.
- It helps you recognize the actions that need to be taken on time so that the entire project is completed on time.
- Shows which responsibilities can be delayed for how long without affecting the overall project plan.
- Determine the minimum time it will take to complete the project.
Shows the latest and latest times when each activity can be started to manage the schedule.
PERT VS CPM
Abbreviation | |
PERT – Project Evaluation and Review Technique | CPM – Critical Path Method |
What does It Mean? | |
PERT – PERT is a popular project management technique that is applicable when the time required to finish a project is not certain | CPM – CPM is a statistical algorithm that has a certain start and end time for a project |
Model Type | |
PERT – PERT is a probabilistic model | CPM – CPM is a deterministic model |
Focus | |
PERT – The main focus of PERT is to minimize the time required for the completion of the project | CPM – The main focus of CPM is on a trade-off between cost and time, with a major emphasis on cost-cutting. |
Orientation type | |
PERT – PERT is an event-oriented technique | CPM – CPM is an activity-oriented technique |
Comparison Chart
BASIS FOR COMPARISON | PERT | CPM |
Meaning | PERT is a project management technique, used to manage uncertain activities of a project. | CPM is a statistical technique of project management that manages the well-defined activities of a project. |
What is it? | A technique of planning and control of time. | A method to control cost and time. |
Orientation | Event-oriented | Activity-oriented |
Evolution | Evolved as Research & Development project | Evolved as Construction project |
Model | Probabilistic Model | Deterministic Model |
Focuses on | Time | Time-cost trade-off |
Estimates | Three-time estimates | One time estimate |
Appropriate for | High precision time estimate | Reasonable time estimate |
Management of | Unpredictable Activities | Predictable activities |
Nature of jobs | Non-repetitive nature | Repetitive nature |
Critical and Non-critical activities | No differentiation | Differentiated |
Suitable for | Research and Development Project | Non-research projects like civil construction, shipbuilding, etc. |
Crashing concept | Not Applicable | Applicable |
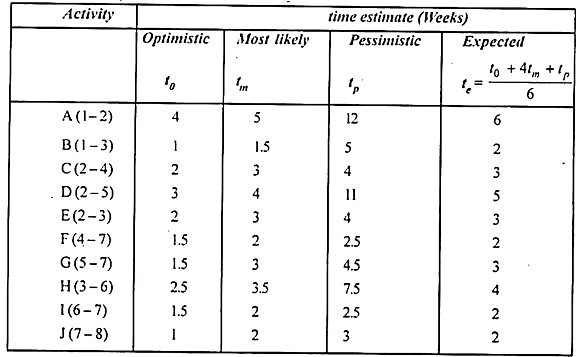
3.3.3 Numerical Consisting of Maximum Ten (10) Activities.
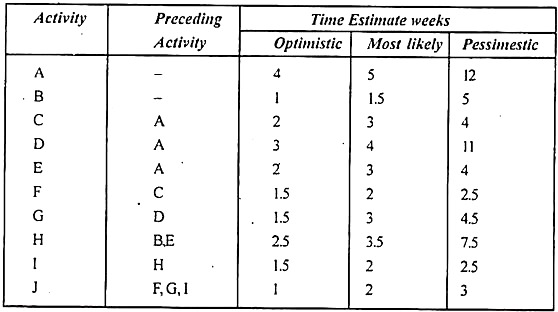
A small project consisting of ten activities has the following characteristics:
Determine the critical path
Solution:
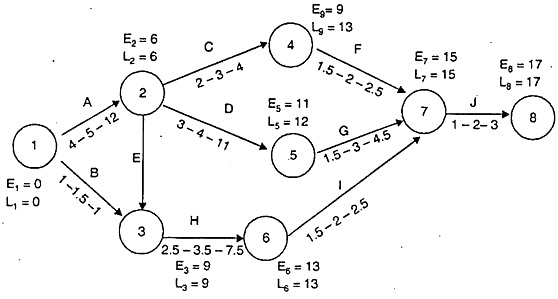
The network for the given project is drawn below:
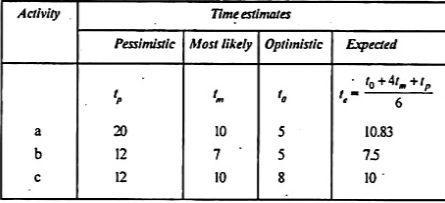
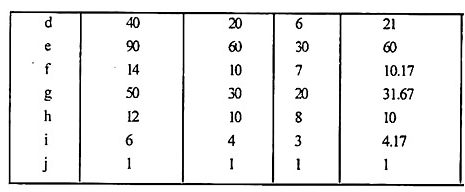
The value of the expected time for each activity is shown in the following table:
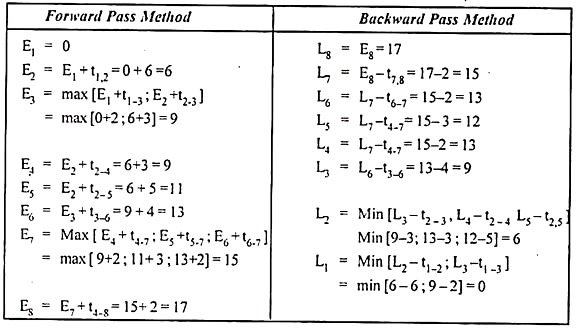
Time [Earliest & latest] are calculated as follows:
As we can see there are two critical paths along which E-values and L-values are similar, but the longest network of critical activities is known as the critical path.
The critical path is 1-2-3-6-7-8
Expected length of critical path is = 6 + 3 + 4 + 2 + 2 = 17 weeks
3.3.4 Construction of PERT Network using te values of all Activities.
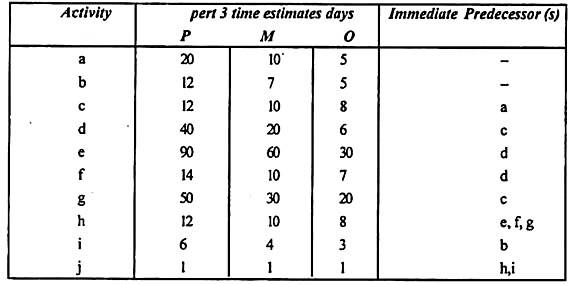
A product manager has planned a list of activities culminating in the inaugurate launch of the new products.
These are given in the table below:
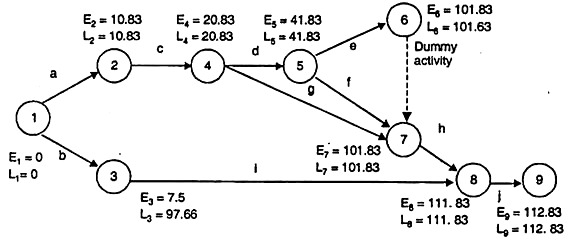
Solution:
The network diagram for the given problem is shown in the following fig:
The expected time value for each activity of the given network is listed in the table below.
|
Value of earliest & latest time is calculated based on expected time te as follows:
|
Value of earliest & latest time is calculated based on expected time te as follows:
Hence critical path along with E-value and L- value is the same i.e., 1- 2-4-5-6-7- 8-9 Expected project duration is 172.83 days
3.3.5 Mean (Expected) Project Completion Time.
"I have more time," laments. The project manager sings this sad song, but don't expect the chorus to join. Keeping the project schedule is one of the three prongs of the triple constraint.
Time dominates all projects. This is of utmost importance to everyone involved, from stakeholders to team members. The clock is always ticking. The best thing a project manager can do is to make an accurate estimate of how long it will take to complete a project well.
Time estimation is important
With these probabilities, anyone who understands how to stop the clock will be a super project manager.
It may not be possible to stop the time, but it is possible to overcome the imminent approach as it relates to the end of the project. Looking to the future to determine how long it will take to complete a project's tasks will allow you to make an estimate. But it's not magic; it's a well-executed project management technique.
So what are some of those tips and tricks for a better time estimate? They run from simple to complex. Below is a list of some proven? Find out what works best for your project management style.
How to estimate the time
Don't fall into planning failure
The planning error comes from the work of psychologists Daniel Kahneman and Amos Tversky, who came up with the term in the late 1970s to explain the psychological tendencies of those who underestimate the time it takes to complete a task. I am. People often neglect to incorporate historical data into their calculations and only think about what they have to do. Therefore, there is not enough information in the quote.
In 2011, Kahneman expanded his planning mistakes in his Fast & Slow, stating that estimation accidents are usually caused by two factors. Don't be an obstacle to historical data (you can't look back on the time taken for past tasks) and complicate the way forward.
The main lesson learned from all this psychological profiling is that our gut has poor time estimates. Project managers can take intuition into account, but it's a good idea to use hard data to back up your schedule. Let's take a closer look at some of these types of hard data.
Historical data
The first is historical data. This is a fancy way of saying it. You are not the first to do this. Therefore, look back at past examples to see how long they took. It's not just an anecdote, it's information about past events and situations related to a particular subject. Analyzing this data is useful.
The historical data is also wide. It's a wide net around every subject it's involved with. Here you'll find everything from press releases to financial reports, log files, project and product documentation.
Historical data is important for consistent time estimates, but it's not cheap. Collecting historical data can be expensive, time-consuming, and labor-intensive. It doesn't even include analysis. However, even a small amount of historical data is better than nothing at all in that it can set a precedent and guide a more accurate path plan in terms of estimating the time it takes to complete a project.
Know what you need to accomplish
However, historical data only works if the project manager has met with stakeholders in advance and has a clear understanding of what the actual goals and objectives of the project are. This is just the first step in getting a complete understanding of your project.
There are many tools to help you identify the tasks you need to complete your project successfully, and you can create a more accurate schedule. One of those tools is the Work Breakdown Template (WBS). This is a way to get the project artifacts and divide them into smaller tasks. Not only does this make your work more manageable useful for time estimation.
But projects don't just perform tasks. Other seemingly insignificant activities waste time. Don't forget to include the time it takes to both meet with the team and reports to stakeholders. There are also common communications, tests, and other activities that occur during the project phase.
Consider using timesheet software to track the time spent on your project.
Talk to an expert
You can make many estimates yourself, and you can also look for historical data to put your project in a larger context, but you shouldn't make time estimates alone. Talking to someone who has worked on a similar project reveals nuances and details not found in dry data.
The experts are great, but there may be untapped people nearby. We are talking about your colleague. The team is gathered for expertise and experience. Talk to them, brainstorm, and listen to their thoughts and concerns.
Team members may have run similar projects and resolved issues that they may have avoided in the past. They can give you an idea of an efficient and effective plan, including a better sense of how long everything will take.
Bottom-up and top-down quotes
Bottom-up estimation is the division of large tasks into smaller, more detailed tasks. Estimating time at a detailed level will also improve accuracy.
Top-down estimation is an analysis that outlines the first expected timeline. Then use past projects, experience, and historical data as a guide to determine your time estimate.
Both time estimation methods work well together. Comparing both results gives you a more accurate estimate of the time required to complete the project. If the two don't match, it doesn't mean that one is wrong, you just need to adjust the estimate.
PERT
PERT (Program Evaluation and Review Technique) is from the United States Navy, which was used to estimate the time it takes to develop a ballistic missile. It was a complex and large-scale project involving thousands of contractors. Thanks to PERT, the project ended two years earlier than expected.
What PERT does is manage the probabilities. It starts with a WBS, divides the task into smaller activities, which are placed on the Gantt chart. When you compare a PERT chart to a Gantt chart, the Gantt chart links dependent tasks (tasks that cannot be started until another task finishes). Each task is a line on the Gantt chart, starting at one point and ending at completion.
Time estimation formula
Estimate the next time for each of these activities. Optimistic time (O), the fastest way to complete an activity. In most cases, time (M), the required delivery date of the project manager. Pessimistic time (P) is the longest time given to complete an activity.
To calculate how long the activity will take, complete the following formula. E represents the estimated time to complete: E = (O + 4M + P) / 6.
To calculate the variance with V as the variance, use the following equation: V = [(P – O) / 6] ^ 2.
After calculating the E and V for each activity, add them together to get an accurate time estimate for project completion.
3.3.6 Standard Deviation and Variance of Activities.
Standard deviation.
A measure of the range of outcomes, the average difference from the mean, is calculated as the square root of the variance. The symbol for standard deviation is σ.
The basic equation for computing standard deviation is
|
Variance
The level of volatility of the time required to carry an activity from the average time is termed as variance in PERT analysis.
The given formula is used to determine the variance of each activity in project management:
|
3.3.7 Project Variance and Project Standard Deviation.
Project Variance
In the project management world, a variance is a measurable change from a known standard or baseline. In other words, a variance is a difference between what is expected and what is accomplished. A variance baseline is established by identifying the cost, schedule, and scope. The scope defines all the work which needs to be done.
Project Standard deviation
The standard deviation (SD, also represented by the Greek letter sigma or σ) is a measure that is used to quantify the amount of variation or dispersion in a set of data values; and is expressed as a quantity defining how much the members of a group differ from the mean value for the group. The concept of standard deviation and normal distributions are valuable quality control tools where the project is making or buying hundreds of similar components.
3.3.8 Prob. Z’ Formula
What is a Z-score?
Simply put, the z-score (also known as the standard score) indicates how far the data points are from the average. But more technically, the standard deviation above and below the population is a measure of the number that means the raw score.
Z-scores can be placed on a normal distribution curve. The Z-score ranges from -3 standard deviation (to the left of the normal curve) to +3 standard deviation (to the right of the normal curve). To use the z-score, we need to know the mean μ and the population standard deviation σ.
Z-scores are a way to compare results to a "normal" population. There are thousands of possible results and units for test or survey results. These results can often seem meaningless. For example, knowing that someone weighs 150 pounds may be good information, but if you want to compare it to the weight of an "average" person, the vast table of data is overwhelming. (Especially if some weight is recorded in kilograms). The Z-score indicates where a person's weight is compared to the average weight of the average population.
Z score formula
Z-score formula: 1 sample
The basic z-score formula for the sample is:
z = (x – μ) / σ
For example, suppose your test score is 190. The mean (μ) of the test is 150 and the standard deviation (σ) is 25. Assuming a normal distribution, the z-score looks like this:
z = (x – μ) / σ
= (190 – 150) / 25 = 1.6.
The z-score indicates how many standard deviations there are from the average score. In this example, the score is 1.6 standard deviations above the mean.
Alternative-z-score the z-score formula shown on the left may also be displayed. This is the same equation as z = x –μ / σ, but x CLK (population mean) is used instead of μ (population mean) and s (sample standard deviation) is used instead of σ (population standard) the point is different. ( Deviation) However, the steps to resolve it are the same.
Z-score formula: mean standard error
If you have multiple samples and want to describe the standard deviation (standard error) of their mean, use the following z-score formula.
z = (x –μ) / (σ / √n)
This z-score indicates how many standard errors there are between the sample mean and the population mean.
Example problem: In general, a woman has an average height of 65 inches and a standard deviation of 3.5 inches. What is the probability of finding a random sample of 50 women with an average height of 70 inches, assuming that their heights are normally distributed?
z = (x –μ) / (σ / √n)
= (70 – 65) / (3.5 / √50) = 5 / 0.495 = 10.1
The important thing here is that we are dealing with the mean sampling distribution, so we need to include the standard error in the equation. We also find that 99% of the values are within 3 standard deviations of the mean of the normal probability distribution (see Rule 68 95 99.7). Therefore, the average height of a female sample is less than 1%.
Z score and standard deviation
Technically, the z-score is the number of standard deviations from the mean of the reference population (the population in which known values are recorded, such as these graphs that the CDC summarized about people's weight). For example:
A z-score of 1 is one standard deviation above the mean.
Score 2 is 2 standard deviations above the mean.
A score of -1.8 is below the average -1.8 standard deviation.
The Z-score indicates where the score is on the normal distribution curve. A z-score of zero indicates that the value is exactly average, and a score of +3 indicates that the value is much higher than average.
How is it used in real life?
You can use the z-table and the normal distribution graph to visually see what a 2.0 z-score means "higher than average". Suppose you have a person's weight (240 lbs) and you know that person's z-score is 2.0. I know 2.0 is above average (because of the high placement of the normal curve), but want to know how much this weight is above average?
The z-score in the center of the curve is zero. The z-score on the right side of the average is positive and the z-score on the left side of the average is negative. You can look up the score in the Z-table to see what percentage of the population is above or below the score. The following table highlights the 2.0 z-score, showing .9772 (converted to 97.72%). Looking at the same score (2.0) on the normal distribution curve above, we can see that it corresponds to 97.72%.
3.3.9 Standard Normal Probability Table. Calculation of Probability from the Probability Table using ‘Z’ Value and Simple Questions related to PERT Technique.
If the number of activities on the critical path is large, then the distribution of the mean of the activity durations approaches a normal distribution, according to Central Limit Theorem So, if n is large enough, the distribution of the project completion time T can be approximated with normal distribution with mean TD and variance V2 as follows:
|
Since Tˉ and V2 are assumed to follow a normal distribution, statistical analysis can be performed to make probabilistic statements.
Normal distribution with mean µ and variance σ2 has a probability density function (PDF) and cumulative distribution function (CDF) as shown below:
|
Normal Distribution.
|
Sample Normal distribution CDF
Determining probabilities
Using CDF, for any given value of x we can determine the probability of having a number ≤ x by reading F(x) from the graph, or using the equation shown below, or using a normal distribution table
|
Sample Normal distribution CDF
Determining probabilities From normal distribution table for +z:
|
Determining probabilities From normal distribution table for -z:
|
Determining probabilities
If x is normally distributed with mean µ and variance σ2, then random variable z :
Z = (x − µ)/√σ2
is normally distributed with mean µ = 0 and variance σ2 = 1 and z is referred to as standard normal variate; therefore to determine the probability of completing the project in x time units or less, read probability corresponding to value of z from normal distribution table.
Sometimes, probability tables are provided for positive values of z only:
- Use symmetric properties of a normal distribution, so that:
φ(−z)= 1 − φ(z)
where φ is the cumulative probability density function of normal distribution
- So, read the value corresponding to +z in the table and calculate the probability of -z by subtracting the value read from the table from 1.0
For a project network:
Since Tˉ = mean and V2= variance for the project completion time (assumed to have a normal distribution)
-Calculate Tˉ and V2
- Given values of x calculating z and use normal distribution table to assess the probability of completing a project in x days or less, OR
- Given a probability, read z from the table and calculate duration x which will give this probability of completion.
3.3.10 Meaning, Objectives, Importance, Scope, RORO/LASH
Normal Distribution is the most important continuous probability distribution in statistics and is defined by the probability density function, where Mean = Median = Mode = m (representing, as the symbol) and Standard Deviation (SD), represented by the symbol a. The curve representing the Normal Distribution is called the normal curve and the total area bounded by the curve and X-axis is equal to 10.
The curve is symmetrical about the mean (m) and is bell-shaped as shown in the figure:
If a random variable X follows a normal distribution with m as mean and SD as σ, then the random variable Z = X-m/σ. (Z is called standard normal variable with m = 0 and SD is 1).
Because of the symmetry of the curve with Z = 0 correspondings to the mean, the area corresponding to the value of Z = 0 and extending in the direction of Z = – 3 will be equal to the area corresponding to the value of Z and extending in the direction of Z = + 3
In addition to being used to illustrate the shape and variability of the data, the normal distribution can be used to estimate future process performance. Normality is an important assumption in many statistical tools and techniques when conducting statistical analysis so that they can be applied in the right manner. Certain SPC charts, many process capability studies, and many statistical inference tests require the data to be normally distributed.
The normal curve helps to calculate the probabilities for normally distributed populations. The probabilities are represented by the area under the normal curve where the total area under the curve is equal to 100 percent.
Importance
The normal distribution is the most important probability distribution in statistics because it fits many natural phenomena. For example, heights, blood pressure, measurement error, and IQ scores follow the normal distribution. It is also known as the Gaussian distribution and the bell curve.
Significance/Importance of Normal Curve:
Normal Curve has great significance in mental measurement and educational evaluation. It gives important information about the trait being measured.
If the frequency polygon of observations or measurements of a certain trait is a normal curve, it indicates that:
1. The measured trait is normally distributed in the Universe.
2. Most of the cases are average in the measured trait and their percentage in the total population is about 68.26%
3. Approximately 15.87% of (50-34.13%) cases are high in the trait measured.
4. Similarly 15.87% cases approximately are low in the trait measured.
5. The test which is used to measure the trait is good.
6. The test has good discrimination power as it differentiates between poor, average and high ability group individuals, and
7. The items of the test used are fairly distributed in terms of difficulty level.
Scope/Objectives
(i) To determine the percentage of cases (in a normal distribution) within given limits or scores.
(ii) To determine the percentage of cases that are above or below a given score or reference point.
(iii) To determine the limits of scores which include a given percentage of cases.
(iv) To determine the percentile rank of a student in his group.
(v) To find out the percentile value of a student’s percentile rank.
(vi) To compare the two distributions in terms of overlapping.
(vii) To determine the relative difficulty of test items, and
(viii) Dividing a group into sub-groups according to certain ability and assigning the grades.
RORO/LASH
Ro-ro ships are an important component of the global transportation system and one of the most successful types of vessels today. However, a significant number of fire incidents on ro-ro ships in recent years and lacking signs of such diminishing call for improved fire protection. Based on a proposal from the European Commission, the International Maritime Organization therefore adopted a new agenda item to the Maritime Safety Committee in November 2016, called "Fire Safety of Ro-ro Passenger Ships" (MSC 97/19/3), and studies are and have since then been carried out to analyse critical aspects in previous ro-ro passenger ship fires.
There is also a need to address the challenges ahead, including the ongoing cargo transformation involving alternative fuel vehicles. Moreover, similar fire safety challenges apply to all types of ro-ro ships (not only passenger ships), including vehicle carriers and general ro-ro cargo ships. Hence, there is a need to update the fire protection of ro-ro ships from a wide and long-term perspective. There are significant challenges to address but there is also great potential in using new and advancing technologies and procedures. The innovative solutions need to be in balance with effects on the environment, cost and crew operations, in order to be considered for regulatory amendments. Then the fire safety of ro-ro ships can be robustly enhanced, without support from external intervention.
LASH FIRE brings together the relevant expertise to cover the challenge of developing and demonstrating new procedures and technical innovations for maritime application. The ambition of the project flows is in line with that of the IMO and other regulatory bodies to greatly enhance the safety of ro-ro ships. Besides, LASH FIRE gives European industry knowledge to address the technical challenges of these updated rules, enhancing shipyards, system suppliers and further industries to develop and build safer and more competitive ships for sustainable transport.
The project has a holistic approach to the problem and will investigate the following:
- Effective Manual Operations: More effective fire managing operations in all stages of a fire, including risk-based screening and management of cargo, more efficient fire patrols and first response as well as effective firefighting.
- Inherently Safe Design: Improved design for critical operations in case of fire, reducing the potential for human error, accelerating time sensitive tasks and providing more comprehensive and effective decision support.
- Ignition Prevention: Significant reduction of the most probable ignition sources and of ignitable deck materials on ro-ro deck, as well as provision for automatic screening and support for risk-based loading.
- Detection: Quicker, more reliable and more robust technical means for fire detection, confirmation, localization and assessment on all types of ro-ro decks.
- Extinguishment: Quick extinguishment regardless of deck, system type or size/existence of crew.
- Containment: Elimination of significant containment weaknesses, considering smoke, fire & heat integrity.
LASH Fire has received funding from the European Union’s Horizon 2020 research and innovation programme under grant agreement No 814975. The project is coordinated by RISE, and the consortium consists of 27 research and industry partners. The project LASH FIRE (Legislative Assessment for Safety Hazards of Fire and Innovations in Ro-ro ship Environment) aims to develop maritime fire safety solutions with innovative technologies, operations and applications.
The consortium, formed by partners from 13 EU Member States, is coordinated by the Research Institutes of Sweden (RISE) and comprises 26 partners from 13 Member States of the European Union, including industry partners, research institutes, universities, regulatory bodies, trade associations and experts in communication and external relations. LASH FIRE will provide a basis for the revision of international maritime regulations and gives European industry knowledge to build safer and more competitive ships for sustainable transport. The European Commission, via its research and innovation programme Horizon 2020, invests 12.2 million euro in LASH FIRE over 4 years, starting in September 2019.
Key takeaways:
- PERT has three different activity period estimates.
1. Optimistic
2. Pessimistic
3. Most likely
2. The network diagram above shows all the various time estimates and calculations for the associated activity. However, there are no specific rules for writing such estimates on the network.
3. Project management can be defined as a structural way to plan, schedule, run, monitor, and control the various phases of a project.
4. PERT and CPM are two project management techniques that all managers need to implement in order to reach their project goals on time.
5. Program Evaluation and Review Technology (PERT) is an activity to understand project planning, placement, scheduling, coordination, and management.
6. The critical path method (CPM) is a well-known project modeling technique in project management. This is a resource that utilizes an algorithm developed by James Kelly and Morgan Walker in the 1950s.
7. The project management critical path method is a step-by-step method used in the planning process that describes the critical and non-critical activities of a project.
8. It helps you recognize the actions that need to be taken on time so that the entire project is completed on time.
9. "I have more time," laments. The project manager sings this sad song, but don't expect the chorus to join. Keeping the project schedule is one of the three prongs of the triple constraint
10. It may not be possible to stop the time, but it is possible to overcome the imminent approach as it relates to the end of the project.
11. The main lesson learned from all this psychological profiling is that our gut has poor time estimates.
12. Historical data is important for consistent time estimates, but it's not cheap. Collecting historical data can be expensive, time consuming, and labor intensive.
13. Z-scores are a way to compare results to a "normal" population. There are thousands of possible results and units for test or survey results. These results can often seem meaningless.
References:
- Higher engineering mathematics, B.S. gerewal
- Hk dass

