Unit-2
Analysis & Interpretation of Financial Statements
Differences between traditional approaches and modern approaches are discussed below-
Sl no | Traditional approach | Modern approach |
| Traditional approach to financial statement analysis includes the Profit and Loss Account (i.e. Income Statement) and the Balance Sheet. | Modern approach to financial statement analysis includes Cash Flow Statement, Funds Flow Statement, Ratio Analysis, Budgetary Control etc. |
2. Method of Preparation | Preparation of these statements are very simple | Preparation of these statements are not so simple. |
3. Supplying Information | These statements are not so informative. | These statements are quite informative. |
4. Reliability | Traditional approaches to financial statements analysis are neither so reliable nor so dependable for the purpose of analysis of financial statements. | These statements are proved to be quite reliable and dependable for the purpose of analysis of financial statements. |
5. Information | The detailed information relating to financial information is not available from these statements as they do not exhibit the required material information. | These statements, no doubt, exhibit the required material information for the purpose of analysis of financial statements. |
6. Presentation | Presentation of these statements is very old. | Presentation of these statements is quite new and more informative than the Traditional Approach. |
7. Specificity | An individual’s specific information, say, the liquidity position of a firm, is not available from these statements accurately. | Modern approach to financial statement analysis is quite possible to understand any specific information from these statements, say, the liquidity position. |
8. Use | Usually these statements are prepared by the small firms. | These statements are usually prepared by the big business houses. |
9. Area of Application | Profit and Loss Account or Income Statement helps us to know the result of the operation at the end of the year. The other statement, viz. The Balance Sheet, helps us to understand the financial position as a whole at the end of the financial year. | Under Modern approach to financial statement analysis, in addition to the benefits that are available under traditional approach, the other material information viz. Liquidity position, solvency position, profitability and management efficiency position can easily be understood accurately. |
10. Preparation and Presentation | Preparation and presentation of these statements are quite simple and mandatory for all firms. | Preparation and presentation of these statements are not so simple and the preparations of these statements are not mandatory for all firms. |
KEY TAKEAWAYS
- TRADITIONAL APPROACH TO FINANCIAL STATEMENT ANALYSIS INCLUDES THE PROFIT AND LOSS ACCOUNT (I.E. INCOME STATEMENT) AND THE BALANCE SHEET.
- MODERN APPROACH TO FINANCIAL STATEMENT ANALYSIS INCLUDES CASH FLOW STATEMENT, FUNDS FLOW STATEMENT, RATIO ANALYSIS, BUDGETARY CONTROL ETC.
The classification of financial statements on the basis of modus and operandi and on the basis of material used are discussed below-
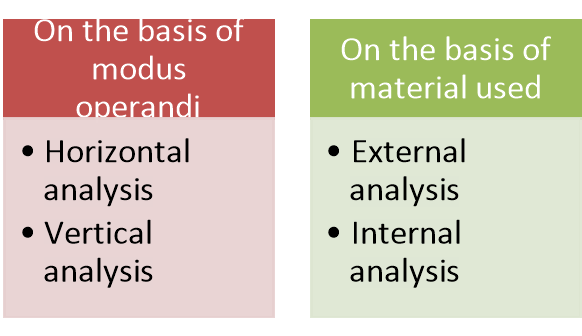
Figure: Classification of financial statement analysis
- On the basis of modus and operandi:
According to material used, financial analysis can be of two types:
a) External analysis:
This analysis is done by outsiders who do not have access to the detailed internal accounting records of the business firm. These outsiders include investors, potential investors, creditors, potential creditors, government agencies, credit agencies, and the general public. For financial analysis, these external parties to the firm depend almost entirely on the published financial statements. External analysis, thus serves only a limited purpose. However, the recent changes in the government regulations requiring business firms to make available more detailed information to the public through audited published accounts have considerably improved the position of the external analysis.
(b) Internal Analysis:
The analysis conducted by persons who have access to the internal accounting records of a business firm is known as internal analysis. Such an analysis can, therefore, be performed by executives and employees of the organisation as well as government agencies which have statutory powers vested in them. Financial analysis for managerial purposes is the internal type of analysis that can be affected depending upon the purpose to be achieved.
2. On the basis of material used
According to the material used, financial analysis can also be of two types:
(a) Horizontal Analysis:
Horizontal analysis refers to the comparison of financial data of a company for several years. The figures for this type of analysis are presented horizontally over a number of columns. The figures of the various years are compared with standard or base year. A base year is a year chosen as beginning point. This type of analysis is also called ‘Dynamic Analysis’ as it is based on the data from year to year rather than on data of any one year. The horizontal analysis makes it possible to focus attention on items that have changed significantly during the period under review. Comparison of an item over several periods with a base year may show a trend developing. Comparative statements and trend percentages are two tools employed in horizontal analysis.
(b) Vertical Analysis:
Vertical analysis refers to the study of relationship of the various items in the financial statements of one accounting period. In this types of analysis the figures from financial statement of a year are compared with a base selected from the same year’s statement. It is also known as ‘Static Analysis’. Common-size financial statements and financial ratios are the two tools employed in vertical analysis. Since vertical analysis considers data for one time period only, it is not very conducive to a proper analysis of financial statements. However, it may be used along with horizontal analysis to make it more effective and meaningful.
KEY TAKEAWAYS
- ACCORDING TO MATERIAL USED, FINANCIAL ANALYSIS CAN BE OF TWO TYPES- EXTERNAL ANALYSIS AND INTERNAL ANALYSIS.
- ACCORDING TO THE MATERIAL USED, FINANCIAL ANALYSIS CAN ALSO BE OF TWO TYPES: HORIZONTAL ANALYSIS AND VERTICAL ANALYSIS.
Comparative Statements
Comparative financial statements are one of the most commonly used tools for undertaking the financial analysis of the statements generated by the business. Comparative statements or comparative financial statements are statements of financial position of a business at different periods. These statements help in determining the profitability of the business by comparing financial data from two or more accounting periods. There are two types of comparative statements which are as follows
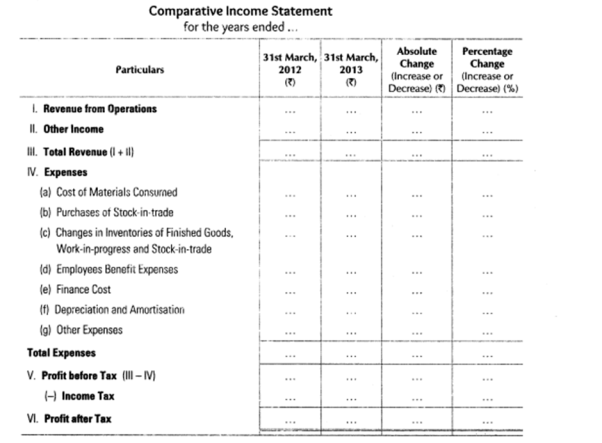
1. Comparative income statement: Income statements provide the details about the results of the operations of the business, and comparative income statements provide the progress made by the business over a period of a few years. This statement also helps in ascertaining the changes that occur in each line item of the income statement over different periods. The comparative income statement not only shows the operational efficiency of the business but also helps in comparing the results with the competitors, over different time periods. This is possible by comparing the operational data spanning multiple periods of accounting. The steps in preparing a comparative income statement are-
• Specify absolute figures of all the items related to the accounting period under consideration.
• Determine the absolute change that has occurred in the items of the income statement. It can be achieved by finding the difference between previous year values with the current year values.
• Calculate the percentage change in the items present in the current statement with respect to previous year statements.
2. Comparative balance sheet
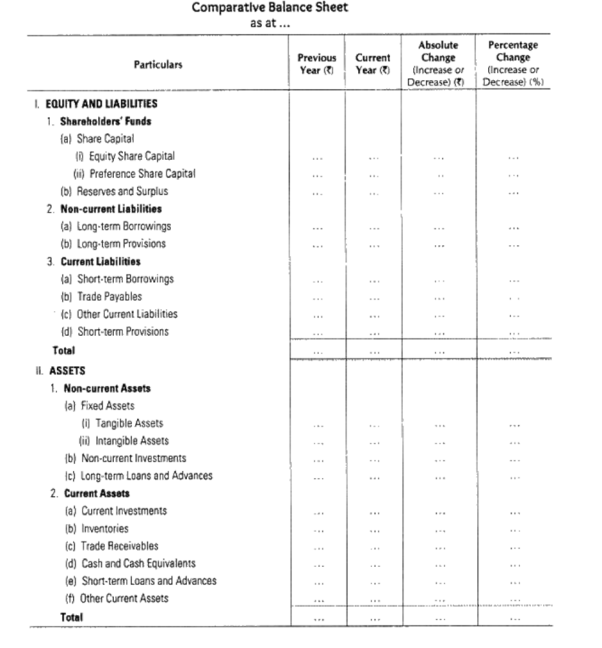
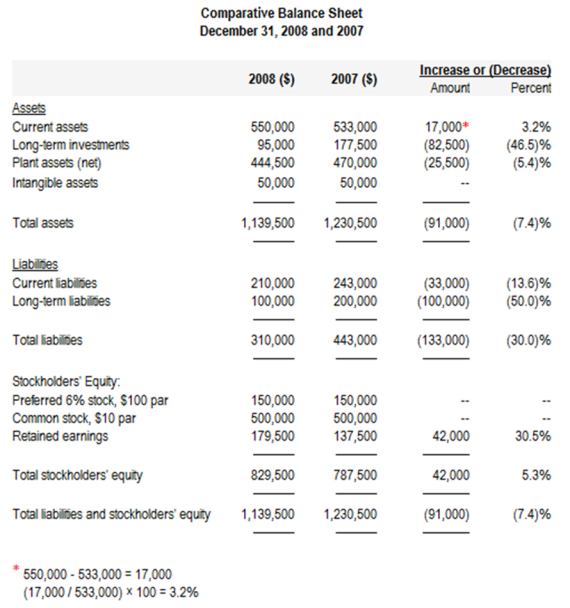
Comparative balance sheet analyses the assets and liabilities of business for the current year and also compares the increase or decrease in them in relative as well as absolute parameters. A comparative balance sheet not only provides the state of assets and liabilities in different time periods, but it also provides the changes that have taken place in individual assets and liabilities over different accounting periods. The below steps can be followed in preparing the statement-
1. Determine the absolute value of assets and liabilities related to the accounting periods.
2. Determine absolute changes in the items of the balance sheet relative to the accounting periods in question.
3. Calculate the percentage change in assets and liabilities by comparing current year values with values of previous accounting periods.
Common-size Statements
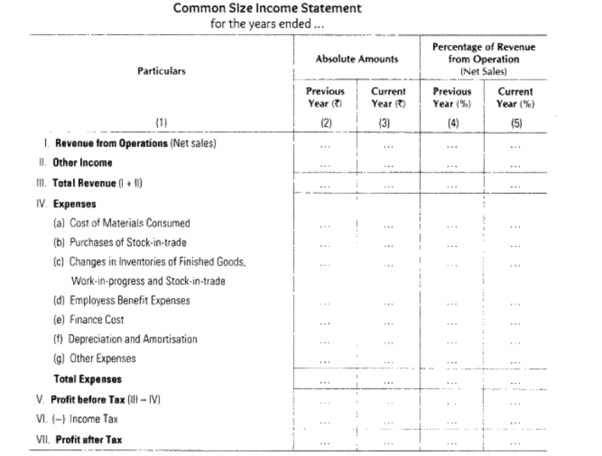
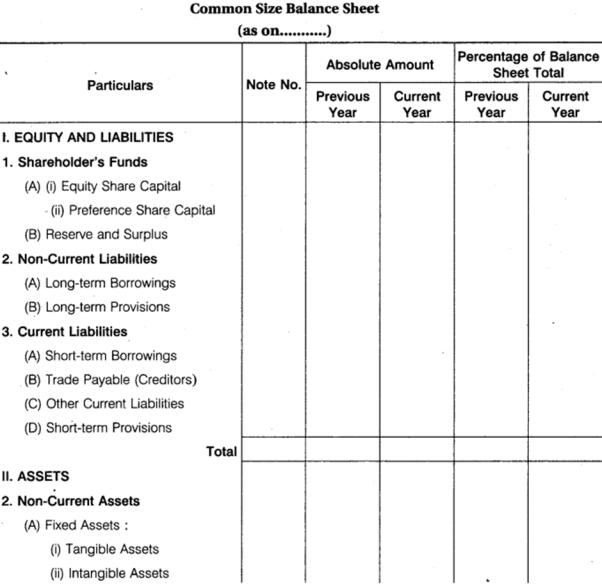
Common size statement is a form of analysis and interpretation of the financial statement. It is also known as vertical analysis. This method analyses financial statements by taking into consideration each of the line items as a percentage of the base amount for that particular accounting period. Common size statements are not any kind of financial ratios but are a rather easy way to express financial statements, which makes it easier to analyse those statements. Common size statements are always expressed in the form of percentages. Therefore, such statements are also called 100 per cent statements or component percentage statements as all the individual items are taken as a percentage of 100. There are two types of common size statements:
- Common size income statement: This is one type of common size statement where the sales is taken as the base for all calculations. Therefore, the calculation of each line item will take into account the sales as a base, and each item will be expressed as a percentage of the sales. It helps the business owner in understanding the following points-
- Whether profits are showing an increase or decrease in relation to the sales obtained.
- Percentage change in cost of goods that were sold during the accounting period.
- Variation that might have occurred in expense.
- If the increase in retained earnings is in proportion to the increase in profit of the business.
- Helps to compare income statements of two or more periods.
- Recognises the changes happening in the financial statements of the organisation, which will help investors in making decisions about investing in the business.
2. Common size balance sheet: A common size balance sheet is a statement in which balance sheet items are being calculated as the ratio of each asset in relation to the total assets. For the liabilities, each liability is being calculated as a ratio of the total liabilities. Common size balance sheets can be used for comparing companies that differ in size. The comparison of such figures for the different periods is not found to be that useful because the total figures seem to be affected by a number of factors.
Trend Ratios
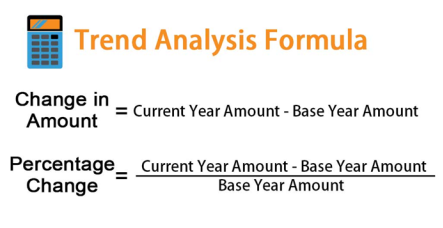
Trend analysis is a financial statement analysis technique that shows changes in the amounts of corresponding financial statement items over a period of time. It is a useful tool to evaluate the trend situations. The statements for two or more periods are used in horizontal analysis. The earliest period is usually used as the base period and the items on the statements for all later periods are compared with items on the statements of the base period. It evaluates an organization’s financial information over a period of time. Periods may be measured in months, quarters, or years, depending on the circumstances. The goal is to calculate and analyze the amount change and per cent change from one period to the next.
Importance of trend analysis
• Trend analysis identifies current and future movements of an investment or group of investments.
• It is comparing past and current financial ratios as they related to various institutions to project how long the current trend will continue.
• It is helpful to investors who wish to make the most of their investments.
• The process of a trend analysis begins with identifying the category of the investments that are under consideration.
• It is possible to determine if all or most of those factors are still exerting an influence.
Specimen format of trend analysis (horizontal analysis of financial statement)
Ratio Analysis
Ratio analysis is used to evaluate relationships among financial statement items. The ratios are used to identify trends over time for one organisation or to compare two or more organisations at one point in time. Ratio analysis focuses on three key aspects of a business: liquidity, profitability, and solvency. Ratio Analysis is an important tool for any business organisation. The computation of ratios facilitates the comparison of firms which differ in size. Ratios can be used to compare a firm's financial performance with industry averages. In addition, ratios can be used in a form of trend analysis to identify areas where performance has improved or deteriorated over time. Generally, ratio analysis involves four steps:
(i) Collection of relevant accounting data from financial statements.
(ii) Constructing ratios of related accounting figures.
(iii) Comparing the ratios thus constructed with the standard ratios which may be the corresponding past ratios of the firm or industry average ratios of the firm or ratios of competitors.
(iv) Interpretation of ratios to arrive at valid conclusions.
Different uses of ratio analysis are-
1. Comparisons
One of the uses of ratio analysis is to compare a company’s financial performance to similar firms in the industry to understand the company’s position in the market. Obtaining financial ratios, such as Price/Earnings, from known competitors and comparing it to the company’s ratios can help management identify market gaps and examine its competitive advantages, strengths, and weaknesses. The management can then use the information to formulate decisions that aim to improve the company’s position in the market.
2. Trend line
Companies can also use ratios to see if there is a trend in financial performance. Established companies collect data from the financial statements over a large number of reporting periods. The trend obtained can be used to predict the direction of future financial performance, and also identify any expected financial turbulence that would not be possible to predict using ratios for a single reporting period.
3. Operational efficiency
The management of a company can also use financial ratio analysis to determine the degree of efficiency in the management of assets and liabilities. Inefficient use of assets such as motor vehicles, land, and building results in unnecessary expenses that ought to be eliminated. Financial ratios can also help to determine if the financial resources are over or under-utilized.
KEY TAKEAWAYS
- COMPARATIVE STATEMENTS OR COMPARATIVE FINANCIAL STATEMENTS ARE STATEMENTS OF FINANCIAL POSITION OF A BUSINESS AT DIFFERENT PERIODS.
- COMMON SIZE STATEMENT ANALYSES FINANCIAL STATEMENTS BY TAKING INTO CONSIDERATION EACH OF THE LINE ITEMS AS A PERCENTAGE OF THE BASE AMOUNT FOR THAT PARTICULAR ACCOUNTING PERIOD.
- TREND ANALYSIS IS A FINANCIAL STATEMENT ANALYSIS TECHNIQUE THAT SHOWS CHANGES IN THE AMOUNTS OF CORRESPONDING FINANCIAL STATEMENT ITEMS OVER A PERIOD OF TIME.
- RATIO ANALYSIS IS USED TO EVALUATE RELATIONSHIPS AMONG FINANCIAL STATEMENT ITEMS. THE RATIOS ARE USED TO IDENTIFY TRENDS OVER TIME FOR ONE ORGANISATION OR TO COMPARE TWO OR MORE ORGANISATIONS AT ONE POINT IN TIME.
The financial statement analysis encountered some problems in its preparation and presentation. Some of such significant problems are discussed below-
- Comparability between periods
The company preparing the financial statements may have changed the accounts in which it stores financial information, so that results may differ from period to period. For example, an expense may appear in the cost of goods sold in one period, and in administrative expenses in another period.
2. Comparability between companies
An analyst frequently compares the financial ratios of different companies in order to see how they match up against each other. However, each company may aggregate financial information differently, so that the results of their ratios are not really comparable. This can lead an analyst to draw incorrect conclusions about the results of a company in comparison to its competitors.
3. Operational information
Financial analysis only reviews a company's financial information, not its operational information, so you cannot see a variety of key indicators of future performance, such as the size of the order backlog, or changes in warranty claims. Thus, financial analysis only presents part of the total picture.
4. Not a Substitute of Judgement
An analysis of financial statement cannot take place of sound judgement. It is only a means to reach conclusions. Ultimately, the judgements are taken by an interested party or analyst on his/ her intelligence and skill.
5. Based on Past Data
Only past data of accounting information is included in the financial statements, which are analysed. The future cannot be just like past. Hence, the analysis of financial statements cannot provide a basis for future estimation, forecasting, budgeting and planning.
6. Problem in Comparability
The size of business concern is varying according to the volume of transactions. Hence, the figures of different financial statements lose the characteristic of comparability.
7. Reliability of Figures
Sometimes, the contents of the financial statements are manipulated by window dressing. If so, the analysis of financial statements results in misleading or meaningless.
8. Various methods of Accounting and Financing
The closing stock of raw material is valued at purchase cost. The closing stock of finished goods is value at market price or cost price whichever is less. In general, the closing stock is valued at cost price or market price whichever is less. It means that the closing stock of raw material is valued at cost price or market price whichever is less. So; an analyst should keep in view these points while making analysis and interpretation otherwise the results would be misleading.
9. Change in Accounting Methods
There must be uniform accounting policies and methods for number of years. If there are frequent changes, the figures of different periods will be different and incomparable. In such a case, the analysis has no value and meaning.
10. Changes in the Value of Money
The purchasing power of money is reduced from one year to subsequent year due to inflation. It creates problems in comparative study of financial statements of different years.
KEY TAKEAWAYS
- THE PROBLEMS FACED IN FINANCIAL STATEMENT ANALYSIS ARE COMPARABILITY BETWEEN PERIODS, COMPARABILITY BETWEEN COMPANIES, CHANGES IN TIME VALUE, CHANGE IN ACCOUNTING METHODS, AND RELIABILITY IN FIGURES ETC.
References
• Foster, G.: Financial Statement Analysis, Englewood Cliffs, NJ, Prentice Hall.
• Sahaf M.A – Management Accounting – Principles & Practice – Vikash Publication
• Foulke, R.A.: Practical Financial Statement Analysis, New York, McGraw-Hill.
• Hendriksen, E.S.: Accounting Theory, New Delhi, Khosla Publishing House.
• Kaveri, V.S.: Financial Ratios as Predictors of Borrowers’ Health, New Delhi, Sultan Chand.
• Lev, B.: Financial Statement Analysis – A New Approach, Englewood Cliffs, NJ, Prentice Hall.