Unit 3
Ratio Analysis
A ratio is a simple arithmetical expression of the relationship of one number to another. It may be defined as the indicated quotient of two mathematical expressions. The Financial Accounting ratios can be classifying into the following groups:
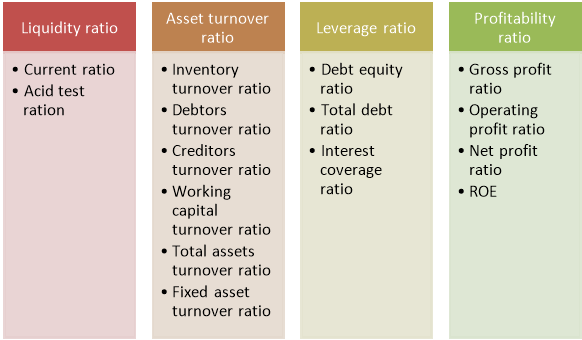
Figure: Classification of ratio
1. Liquidity Ratios
The ratio is an indicator of short-term solvency of the company. Here liquidity refers to the speed and ease with which a firm is able to settle its short term debt. The day to day problems of financial management consists of finding sufficient cash to pay-off its current debt .These ratios intend to provide information about a firm’s liquidity.
Liquidity Ratio can be classified into two categories:
- Current Ratio: It measures the ability of the firm to meet its short term obligations. It is calculated as-
Current ratio= Current Assets/ Current Liability
Where, Current Assets = Stock, debtor, cash and bank, receivables, loan and advances, and other current assets.
Current Liability = Creditor, short-term loan, bank overdraft, outstanding expenses, and other current liability.
- Quick Ratio: It is also called the Acid Test Ratio or Liquid Ratio. This ratio establishes the relationship between quick/liquid current assets and the current liabilities. It is calculated as-
Quick ratio= Quick Assets/ Current Liability
Where, Quick Assets = Current Assets – Inventory – Prepaid Expenses
2. The Asset Activity Ratios/Turnover Ratios
Asset Activity Ratio helps assess how effectively and efficiently the firm is using its assets to generate sales. It measures how frequently an account has moved/turned over during a period.
- Inventory Turnover Ratio: The Ratio establishes the relationship between the cost of goods sold during the year and the average inventory held during the year by the firm.
Inventory turnover ratio= Cost of Goods Sold/ Average Inventory
Or
Sales/ Average Inventory
- Debtors/Receivables Turnover Ratio: The Ratio attempts to throw light on the collection and credit policies of the firm. In case the firm sells goods on credit (both debtors and/or bills), the realization of the sales revenue is delayed and the receivables are created i.e., the cash is realized from these receivables at a later stage. It gives an idea about the efficiency of the credit collection policy of the firm, by matching the annual credit sales to the average receivables.
Debtors turnover ratio= Net Sales/ Average Debtors
- Creditors/ Payable Turnover Ratio (P/T Ratio): The P/T Ratio shows the pace of debt payment by the firm. It compares the annual credit purchase with the average payables such as creditors, bills payable etc.
Creditors turnover ratio= Credit Purchases/ Average Creditors
- Working Capital Turnover Ratio (WCT Ratio): This Ratio analyses the efficiency of utilization of the working capital of the firm during a year; the working capital here refers to the total current assets less total current liabilities.
Working capital turnover ratio= Net Sales/ Working Capital
- Total Asset Turnover Ratio: It measures how effectively a firm is using its overall assets to generate sales.
Total asset turnover ratio= Net assets/Average total assets
- Fixed Asset Turnover Ratio: The Ratio evaluates as to how effectively a firm is able to utilize its fixed assets to generate sales.
Fixed asset turnover ratio= Fixed Asset Turnover = Net Sales / Average Fixed Assets
3. Leverage Ratios
Long term financial strength of the firm is measured in terms of the ability to pay interest regularly or repay principal on due dates or at the time of maturity. Such long term solvency of a firm can be judged by using leverage.
- Debt-Equity Ratio (DE Ratio): This Ratio is a basic measure of studying the indebtedness if the firm or Debt-equity Ratio measures the debt proportion relative to the equity financing for the firm.
Debt-equity ratio= Debts/ Equity (Shareholders' Funds)
Or
Debts/ Long - term Funds (Shareholders' Funds + Debts)
- Total Debt Ratio: The Ratio compares the total debts of the firm with the total assets available. It measures the relative size of the firm’s debt load and the firm’s ability to pay the debt.
Total debt ratio= Total debts/total assets
- Interest Coverage Ratio (IC Ratio): This ratio is also called the times interest earned ratio and it measures the ability of the firm to pay the fixed interest liability.
Interest coverage ratio= EBIT/Interest expense
4. Profitability Ratios
It measures the overall effectiveness of the firm’s management. The profitability ratios are of prime concern for the management which is interested in the overall profitability and operational efficiency of the firm and the equity shareholders who are interested in the returns available to them.
- Gross Profit Ratio: The ratio measures the effectiveness of the firm at generating revenue in excess of its cost of goods sold.
GP ratio= Gross profit x100/net sales
- Operating Profit Ratio: The Ratio measures the effectiveness o the firm in keeping its costs of production low. It also refers to the pure operating profit of the firm
Operating profit ratio= Operating profit x100/net sales
- Net Profit Ratio: The Ratio establishes the relationship between the net profit (after tax) of the firm and the net sales.
Net profit ratio= Net income x100/net sales
- Return on Equity (ROE): The ROE examines how well the firm is able to generating return to its equity shareholder.
ROE = Net income/Equity
KEY TAKEAWAYS
- A RATIO IS A SIMPLE ARITHMETICAL EXPRESSION OF THE RELATIONSHIP OF ONE NUMBER TO ANOTHER.
A ratio is a simple arithmetical expression of the relationship of one number to another. It may be defined as the indicated quotient of two mathematical expressions. A single ratio in itself does not convey much of the sense. To make ratios useful, they have to be further interpreted. The interpretation of the ratios can be made in the following ways:
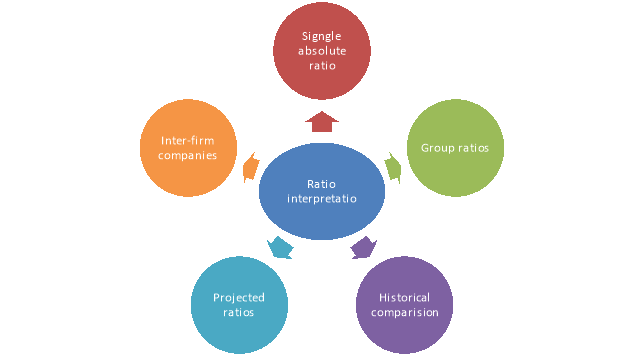
Figure: Ratio interpretation
1. Single Absolute Ratio:
Generally speaking one cannot draw any meaningful conclusion when a single ratio is considered in isolation. But single ratios may be studied in relation to certain rules of thumb which are based upon well proven conventions as for example 2: 1 is considered to be a good ratio for current assets to current liabilities.
2. Group of Ratios:
Ratios may be interpreted by calculating a group of related ratios. A single ratio supported by other related additional ratios becomes more understandable and meaningful. For example, the ratio of current assets to current liabilities may be supported by the ratio of liquid assets to liquid liabilities to draw more dependable conclusions.
3. Historical Comparison:
One of the easiest and most popular ways of evaluating the performance of the firm is to compare its present ratios with the past ratios called comparison overtime. When financial ratios are compared over a period of time, it gives an indication of the direction of change and reflects whether the firm’s performance and financial position has improved, deteriorated or remained constant over a period of time. But while interpreting ratios from comparison over time, one has to be careful about the changes, if any, in the firm’s policies and accounting procedures.
4. Projected Ratios:
Ratios can also be calculated for future standards based upon the projected or proforma financial statements. These future ratios may be taken as standard for comparison and the ratios calculated on actual financial statements can be compared with the standard ratios to find out variances, if any. Such variances help in interpreting and taking corrective action for improvement in future.
5. Inter-Firm Comparison:
Ratios of one firm can also be compared with the ratios of some other selected firms in the same industry at the same point of time. This kind of comparison helps in evaluating relative financial position and performance of the firm. But while making use of such comparison one has to be very careful regarding the different accounting methods, policies and procedures adopted by different firms.
KEY TAKEAWAYS
- A RATIO IS A SIMPLE ARITHMETICAL EXPRESSION OF THE RELATIONSHIP OF ONE NUMBER TO ANOTHER. IT MAY BE DEFINED AS THE INDICATED QUOTIENT OF TWO MATHEMATICAL EXPRESSIONS. A SINGLE RATIO IN ITSELF DOES NOT CONVEY MUCH OF THE SENSE. TO MAKE RATIOS USEFUL, THEY HAVE TO BE FURTHER INTERPRETED.
Time Series (intra firm) Analysis
Comparative statement (two or more periods)
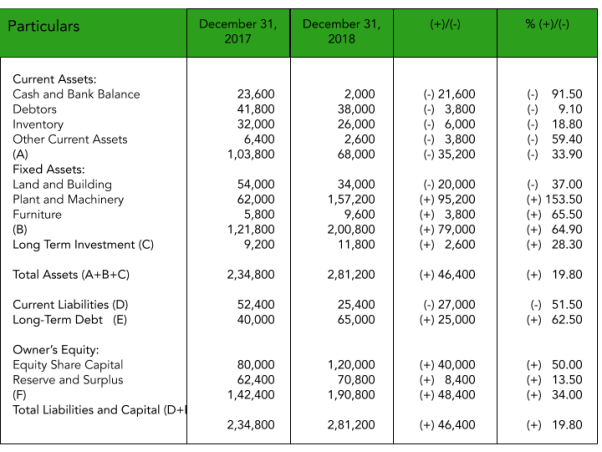
Q1) Prepare a comparative statement from the balance sheet of M/s Kapoor and Co. As of December 31, 2017, and December 31, 2018.
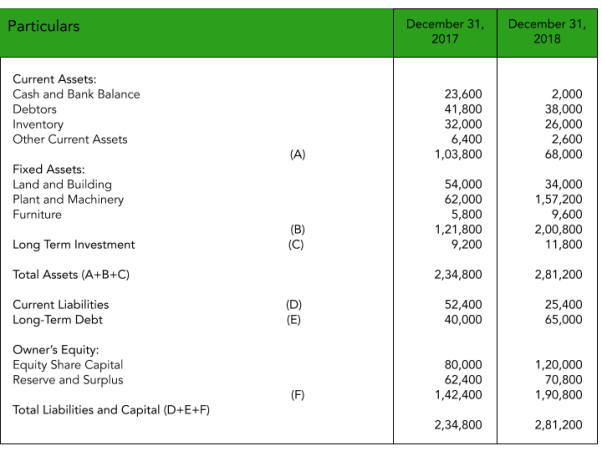
Solution 1)
Comparative Balance Sheet of M/s Kapoor and Co. As on December 31, 2017, and December 31, 2018.
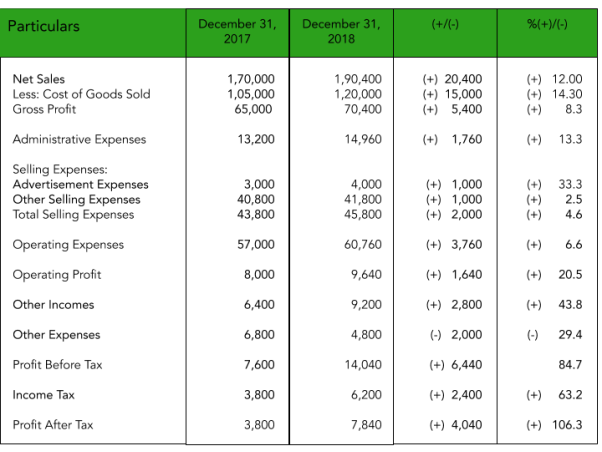
Q2) Prepare a comparative income statement from the Income Statement of M/s Singhania as of December 31, 2017, and December 31, 2018.
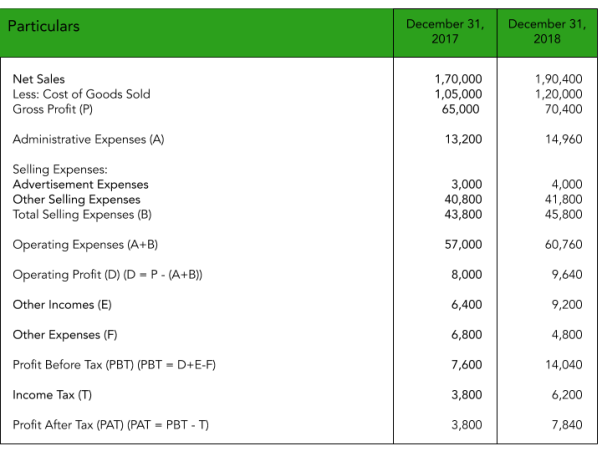
Solution 2)
Comparative Income Statement of M/s Singhania For The Years Ended December 31, 2017, and December 31, 2018.
Q3) From the following information, prepare a Comparative Balance Sheet.
Particulars | 2001 | 2002 |
Amount (in lakhs) | Amount (in lakhs) | |
Land and Building | 480 | 720 |
Furniture & Fixture | 60 | 80 |
Plant and Machinery | 240 | 480 |
Cash | 240 | 80 |
Debtors less reserve for doubtful debts | 120 | 96 |
Merchandise Inventory | 260 | 320 |
Prepaid Expenses | 100 | 80 |
Equity Capital | 400 | 500 |
Retained Earnings | 466 | 566 |
Trade creditors | 234 | 510 |
Accrued Expenses | 400 | 360 |
Solution 3)
ABC Co. Ltd.
Comparative Balance Sheet As on 31st December 2001 and 2002
(Amount in Lakhs of rupees)
| 31st Dec. 2001 | 31st Dec. 2002 | Increase (+) /Decrease (-) Amount |
% |
Rate | |
Assets : |
|
|
|
|
| |
Current Assets : |
|
|
|
|
| |
Cash | 240 | 80 | - 160 | - 66 | 1.24 | |
Debtors less reserve for doubtful debts | 120 | 96 | - 24 | - 40 | 1.60 | |
Merchandise Inventory | 260 | 320 | + 66 | + 46 | 2.46 | |
Prepaid Expenses | 100 | 80 | - 20 | - 40 | 1.60 | |
Total Current Assets | 720 | 656 | - 64 | - 18 | 1.82 | |
Fixed Assets : |
|
|
|
|
| |
Land and Building |
| 480 | 720 | + 240 | +100 | 2.0 |
Furniture & Fixture |
| 60 | 80 | + 20 | + 66 | 2.66 |
Plant and Machinery | 240 | 480 | + 240 | + 200 | 4.00 | |
Total fixed Assets | 780 | 1,280 | + 500 | + 128 | 2.20 | |
Total Assets | 1,500 | 1,936 | + 436 | + 58 | 2.58 | |
Liabilities and Capital: |
|
|
|
|
| |
Current Liability : |
|
|
|
|
| |
Trade creditors | 234 | 510 | + 276 | + 108 | 3.08 | |
Accrued Expenses | 400 | 360 | - 40 | - 20 | 1.08 | |
Total Current liabilities | 634 | 870 | + 236 | + 74 | 2.74 | |
Equity Capital | 400 | 500 | + 100 | + 50 | 2.50 | |
Retained Earnings | 466 | 566 | + 100 | + 42 | 2.42 | |
Total Capital | 866 | 1,066 | + 200 | + 46 | 2.46 | |
Total Liabilities Capital | And | 1,500 | 1,936 | + 436 | + 58 | 2.58 |
Q4) From the Following information of ABC Co. Ltd, prepare a comparative Income statement.
Particulars | 2001 | 2002 |
Amount (in lakhs) | Amount (in lakhs) | |
Selling Expenses | 188 | 182 |
Gen. And Admn. Expenses | 94 | 92 |
Dividend received | 44 | 50 |
Interest Paid | 44 | 44 |
Income Tax | 124 | 124 |
Cost of Goods sold | 838 | 926 |
Sales | 1370 | 1442 |
Solution 4)
ABC Co. Ltd.
Comparative Income Statement For the year ended 31st Dec. 1980 and 1981
(Amount in Lakhs of Rupees)
| 31st Dec. 1980 | 31st Dec. 1981 | Increase (+) / Decrease (-) Amount | % |
Net Sales | 1370 | 1442 | + 72 | +0.6 |
Less : Cost of Goods Sold | 838 | 926 | + 88 | + 21 |
Gross Profit | 532 | 516 | - 16 | - 6.4 |
Operating Expenses : |
|
|
|
|
Selling Expenses | 188 | 182 | - 6 | - 6.4 |
Gen. And Admn. Expenses | 94 | 92 | - 2 | - 4.2 |
Total Operating Expenses | 282 | 274 | - 8 | - 5.6 |
Operating Profit | 250 | 242 | - 8 | - 6.4 |
Add : Other Income |
|
|
|
|
Dividend | 44 | 50 | + 6 | + 2.8 |
| 294 | 292 | - 2 | - 1.4 |
Less : Other Deduction |
|
|
|
|
Interest Paid | 44 | 44 | Nil | Nil |
| 250 | 248 | - 2 | - 1.6 |
Less : Income Tax | 124 | 124 | Nil | Nil |
Net Profit after Tax | 126 | 124 | - 2 | - 3.2 |
Cross Sectional (inter firm) Analysis
a) Common size statement
Q1) The balance sheet of X Ltd are given for the year 2007 and 2008 convert them into common size balance sheet.
Liabilities | 2007 Rs | 2008 Rs. | Assets | 2007 Rs. | 2008 Rs. |
Equity share | 1,46,800 | 1,91,000 | Buildings | 1,80,000 | 2,00,000 |
Capital reserve | 50,000 | 70,000 | Plant and machinery | 40,000 | 55,000 |
Revenue reserve & surplus | 20,000 | 30,000 | Furniture | 10,000 | 20,000 |
Freehold property | 20,000 | 12,000 | |||
Trade creditors | 30,000 | 40,000 | Goodwill | 25,000 | 30,000 |
Bills payable | 80,000 | 60,000 | Cash balance | 25,000 | 20,000 |
Bank overdraft | 90,000 | 80,000 | Sunday debtors | 30,000 | 35,000 |
Provisions | 30,000 | 20,000 | Inventories Bills receivable(temporary) | 70,000 | 57,000 |
| 4,46,800 | 4,91,000 |
| 4,46,800 | 4,91,000 |
Solution 1)
Assets | 2007 | 2008 | ||
Amt. (Rs.) | Percentage | Amt. (Rs.) | Percentage | |
SOURCES OF FUNDS |
|
|
|
|
(A) Shareholder’s Funds |
|
|
|
|
Equity Share | 1,46,800 | 67.71 | 1,91,000 | 65.64 |
Capital Reserve | 50,000 | 23.06 | 70,000 | 24.05 |
Revenue Reserve and Surplus | 20,000 | 9.23 | 30,000 | 10.31 |
Total (A) | 2,16,800 | 100 | 2,91,000 | 100 |
|
|
|
|
|
(B) Borrowed Funds | Nil | Nil | Nil | Nil |
|
|
|
|
|
Total Sources of Funds(A+B) | 2,16,800 | 100 | 2,91,000 | 100 |
|
|
|
|
|
APPLICATION OF FUNDS |
|
|
|
|
(A) Fixed Assets |
|
|
|
|
Building | 1,80,000 | 83.03 | 2,00,000 | 68.73 |
Plant and Machinery | 40,000 | 18.45 | 55,000 | 18.90 |
Furniture | 10,000 | 4.61 | 20,000 | 6.87 |
Freehold Property | 20,000 | 9.23 | 12,000 | 4.12 |
Goodwill | 25,000 | 11.53 | 30,000 | 10.31 |
Total (A) | 2,75,000 | 126.85 | 3,17,000 | 108.93 |
|
|
|
|
|
(B)Working Capital |
|
|
|
|
|
|
|
|
|
Sundry Debtor | 30,000 | 13.84 | 35,000 | 12.03 |
Cash balance | 25,000 | 11.53 | 20,000 | 6.87 |
Inventories | 70,000 | 32.29 | 57,000 | 19.59 |
Investment (Temporary) | 36,500 | 16.84 | 42,000 | 14.43 |
Bill Receivable | 10,300 | 4.75 | 20,000 | 6.87 |
Total (a) | 1,71,800 | 79.24 | 1,74,000 | 59.79 |
|
|
|
|
|
b. Current Liabilities |
|
|
|
|
Trade Creditors | 30,000 | 13.84 | 40,000 | 13.75 |
Bill Payable | 80,000 | 36.90 | 60,000 | 20.62 |
Bank Overdraft | 90,000 | 41.51 | 80,000 | 27.49 |
Provision | 30,000 | 13.84 | 20,000 | 6.87 |
Total (b) | 2,30,000 | 106.09 | 200,000 | 68.73 |
(B)Working Capital (a-b) | (58,200) | (26.85) | (26,000) | (8.93) |
|
|
|
|
|
Total Application of Funds (A+B) | 2,16,800 | 100 | 2,91,000 | 100 |
|
|
|
|
|
Q2) From the income statement give below you are required to prepare common – sized income statement.
Particulars | 1986 Rs. | 1987 Rs. |
Sales | 1,40,000 | 1,65,000 |
Less : Cost of Goods Sold | 85,000 | 1,05,000 |
Gross Profit | 55,000 | 60,000 |
Operating Expenses |
|
|
Selling and Distribution Expenses | 12,000 | 16,000 |
Administrative Expenses | 10,000 | 11,000 |
Total Operating Expenses | 22,000 | 27,000 |
Net Income before Tax | 33,000 | 33,000 |
Income Tax (40%) | 13,000 | 13,200 |
Net Income | 19,800 | 19,800 |
Common size income statement (For the year ending 1986 and 1987)
Particulars | 1986 | 1987 | ||
Amt. (Rs.) | Percentage | Amt. (Rs.) | Percentage | |
Sales | 1,40,000 | 100.00 | 1,65,000 | 100.00 |
Less : Cost of Sales | 85,000 | 60.72 | 1,05,000 | 63.63 |
Gross Profit | 55,000 | 39.28 | 60,000 | 36.37 |
Selling & Distribution | 12,000 | 8.57 | 16,000 | 9.70 |
Expenses |
|
|
|
|
Administrative Exp. | 12,000 | 7.14 | 11,000 | 6.67 |
Total operating Exp. | 22,000 | 15.71 | 27,000 | 16.67 |
Net Income before Tax | 33,000 | 23.57 | 33,000 | 20.00 |
Income Tax (40%) | 13,000 | 9.42 | 13,200 | 8.00 |
Net Income after Tax | 19,800 | 14.15 | 19,800 | 12.00 |
b) Ratio Analysis
Q.1
The following Trading and Profit and Loss Account of Fantasy Ltd. For the year 31‐3‐2000 is given below:
Particular | Rs. | Particular | Rs. |
To Opening Stock Purchases Carriage and Freight Wages Gross Profit b/d
To Administration expenses To Selling and Dist. Expenses To Non‐operating expenses To Financial Expenses To Net Profit c/d | 76,250 3,15,250 2,000 5,000 2,00,000 5,98,500
1,01,000 12,000 2,000 7,000 84,000 2,06,000 | By Sales By Closing stock
By Gross Profit b/d Non‐operating incomes By Interest on Securities By Dividend on shares By Profit on sale of shares | 5,00,000 98,500
 5,98,500 2,00,000
1,500 3,750 750 2,06,000 |
Calculate:
1. Gross Profit Ratio
2. Expenses Ratio
3. Operating Ratio
4. Net Profit Ratio
5. Stock Turnover Ratio.
Solution:
- Gross Profit Ratio = Gross Profit/Sales x 100
= 2,00,000/5,00,000 x 100
= 40%
2. Expense Ratio = Operating expenses/Sales x 100
= (1,01,000+12,000)/5,00,000 x 100
= 22.60%
3. Operating Ratio = (COGS + Operating expenses)/Sales x 100
= (3,00,000+1,13,000)/5,00,000 x 100
= 82.60%
COGS = Op. Stock + purchases + carriage and Freight + wages – Closing Stock
= 76,250 + 3,15,250 + 2,000 + 5,000 - 98,500
= Rs 3,00,000
4. Net Profit Ratio = Net Profit/Sales x 100
= 84,000/5,00,000 x 100
= 16.8%
5. Stock Turnover Ratio = COGS/ Average Stock
= 3,00,000/87,375
= 3.43 times
Average Stock = OPn Stk + Cl Stk / 2
= (76,250+98,500)/2
= 87,375
Q.2
The Balance Sheet of Punjab Auto Limited as on 31‐12‐2002 was as follows:
Particulars | Rs. | Particulars | Rs. |
Equity Share Capital Capital Reserve 8% Loan on Mortgage Creditors Bank overdraft Taxation: Current Future Profit and Loss A/c | 40,000 8,000 32,000 16,000 4,000
4,000 4,000 12,000 1,20,000 | Plant and Machinery Land and Buildings Furniture & Fixtures Stock Debtors Investments (Short‐term) Cash in hand | 24,000 40,000 16,000 12,000 12,000 4,000 12,000
 1,20,000 |
From the above, compute (a) the Current Ratio, (b) Quick Ratio, (c) Debt‐Equity Ratio.
Solution:
- Current Ratio = Current Assets/Current Liabilities
= 40,000/28,000
= 1.43:1
Current Assets = Stock + debtors + Investments (short term) + Cash In hand
= 12,000+12,000+4,000+12,000
= Rs 40,000
Current Liabilities = Creditors + bank overdraft + Provision for Taxation (current & Future)
= 16,000+4,000+4,000+4,000
= Rs 28,000
2. Quick Ratio = Quick Assets/Quick Liabilities
= 28,000/20,000
= 1.40:1
Quick Assets = Current Assets ‐ Stock
= 40,000 - 12,000
= Rs 28,000
Quick Liabilities = Current Liabilities – (BOD + PFT future)
= 28,000 – (4,000 + 4,000)
= 20,000
3. Debt Equity Ratio = Debt/Equity
= 32,000/60,000
= 0.53:1
Debt = Debentures + long term loans
= Rs 32,000
Equity = Eq. Sh. Cap. + Reserves & Surplus + Preference Sh. Cap. – Fictitious Assets
= 40,000+8,000+12,000
= Rs 60,000
Q.3
The details of Shreenath Company are as under:
Sales (40% cash sales) |
| 15,00,000 |
Less: Cost of sales |
| 7,50,000 |
| Gross Profit: | 7,50,000 |
Less: Office Exp. (including int. On debentures) 1,25,000 | ||
Selling Exp. | 1,25,000 | 2,50,000 |
| Profit before Taxes: | 5,00,000 |
Less: Taxes |
| 2,50,000 |
| Net Profit: | 2,50,000 |
Balance Sheet
Particular | Rs. | Particular | Rs. |
Equity share capital 10% Preference share capital Reserves 10% Debentures Creditors Bank‐overdraft Bills payable Outstanding expenses | 20,00,000
20,00,000 11,00,000 10,00,000 1,00,000 1,50,000 45,000 5,000 64,00,000 | Fixed Assets Stock Debtors Bills receivable Cash Fictitious Assets | 55,00,000 1,75,000 3,50,000 50,000 2,25,000 1,00,000
 64,00,000 |
Besides the details mentioned above, the opening stock was of Rs. 3,25,000 & Opening Debtors was Rs 3,00,000, Opening Bills Receivable was Rs 1,00,000. Calculate the following ratios; also discuss the position of the company:
(1) Gross profit ratio. (2) Stock turnover ratio. (3) Current ratio. (4) Liquid ratio. (5) Debtors Turnover Ratio
Solution:
- Gross Profit Ratio = Gross Profit/Sales x 100
= 7,50,000/15,00,000 x 100
= 50%
2. Stock Turnover Ratio = COGS/ Average Stock
= 7,50,000/2,50,000
= 3 times
Average Stock = OPn Stk + Cl Stk / 2
= (3,25,000+1,75,000)/2
= 2,50,000
COGS = Sales – GP
= 15,00,000 – 7,50,000
= 7,50,000
3. Current Ratio = Current Assets / Current Liabilities
= 8,00,000/3,00,000
= 2.67:1
Current Assets = Stock + debtors + Bills receivable + Cash
= 1,75,000 + 3,50,000 + 50,000 + 2,25,000
= Rs 8,00,000
Current Liabilities = Creditors + bank overdraft + Bills payable + O/s Expenses
= 1,00,000 + 1,50,000 + 45,000 + 5,000
= Rs 3,00,000
4. Quick Ratio/
Liquid Ratio = Quick Assets/Quick Liabilities
= 6,25,000/1,50,000
= 4.17:1
(Liquid) Quick Assets = Current Assets ‐ Stock
= 8,00,000 – 1,75,000
= Rs 6,25,000
(Liquid) Quick Liabilities = Current Liabilities – BOD
= 3,00,000-1,50,000
= Rs 1,50,000
5. Debtors Turnover Ratio = Net Credit Sales/Average Debtors
= (15,00,000 x 60%)/4,00,000
= 9,00,000/4,00,000
= 2.25 times
Average Debtors = (Op Debtors+Op B/R+ Cl Debtors+Cl B/R) / 2
= (3,00,000+1,00,000+3,50,000+50,000)/2
= Rs 4,00,000
Q.4
From the data calculate:
(i) Gross Profit Ratio, (ii) Net Profit Ratio, (iii) Inventory Turnover, (iv) Current Ratio (v) Debt-Equity Ratio
Sales 25,20,000 Other Current Assets 7,60,000
Cost of sale 19,20,000 Fixed Assets 14, 40,000
Net profit 3,60,000 Equity & Reserves 15,00,000
Closing Inventory 8,00,000 Debt. 9,00,000
Current Liabilities 6,00,000 Opening Inventory 7,00,000
Solution:
- Gross Profit Ratio = Gross Profit/Sales x 100
= 6,00,000/25,20,000 x 100
= 23.81%
Gross Profit = Sales – COGS
= 25,20,000 – 19,20,000
= 6,00,000
2. Net Profit Ratio = Net Profit / Sales x 100
= 3,60,000/25,20,000 x 100
= 14.29%
3. Inventory Turnover Ratio = COGS/ Average Inventory
= 19,20,000/ 7,50,000
= 2.56 times
Average Inventory = (Opening Inventory + Closing inventory) / 2
= (7,00,000+8,00,000) / 2
= Rs 7,50,000
4. Current Ratio = Current Assets/ Current Liabilities
= 7,60,000/6,00,000
= 1.27:1
5. Debt Equity Ratio = Debt/Equity
= 9,00,000/15,00,000
= 0.60:1
Q.5
Calculate stock turnover ratio from the following information:
Opening stock 8,000
Purchases 4,84,000
Sales 6,40,000
Gross Profit Rate – 25% on Sales.
Solution:
Stock Turnover Ratio = Cost of Goods Sold / Average Stock
Cost of Goods Sold = Sales- G.P
= 6,40,000 – 1,60,000 = 4,80,000
Stock Turnover Ratio = 4,80,000 /58000
= 8.27 times
Here, there is no closing stock. So there is no need to calculate the average stock.
Q.6
Calculate the operating Ratio from the following figures.
Items (Rs in Lakhs)
Sales 17874
Sales Returns 4
Other Incomes 53
Cost of Sales 15440
Administration and Selling Exp. 1843
Depreciation 63
Interest Expenses (Non- operating 456
Solution:
Operating Ratio = (Cost of Goods Sold + Operating Expenses x 100) / Sales
= ((15,440 + 1,843)/ 17,870)x100
= 97%
Q.7
The following is the Trading and Profit and loss account of Mathan Bros Private Limited for the year ended June 30,2001.
Particulars Rs. Particulars Rs.
To Stock in hand 76250 By Sales 500000
To Purchases 315250 By Stock in hand 98500
To Carriage and Freight 2000
To Wages 5000
To Gross Profit 200000
598500 598500
To Administration Expenses 1,01,00 By Gross profit 2,00,000
To Finance Expenses. : By Non-operating Incomes
Interest 1200 Interest on Securities 1,500
Discount 2400 Dividend on Shares 3, 750
Bad Debts 3400 7000 Profit on Sale of Shares 750 6,000
To Selling Distribution Expenses 12000
To Non-operating expenses
Loss on sale of securities 350
Provision for legal suit 1,650 2000
To Net profit 84000
206000 206000
You are required to calculate:
(i) Gross profit Ratio (ii) Net profit Ratio
(iii) Operating Ratio (iv) Stock turnover Ratio
Solution:
- Gross Profit Ratio =Gross Profit/ Sales x 100
= 2,00,000 / 500000 x 100
= 40%
2. Net Profit Ratio = Net Profit/ Sales x100
= 84000/ 500000 x100
= 16.8%
3. Operating Ratio = ( Cost of Goods Sold + Operating Expenses)/Sales* 100
= (3,00,000 + 1,20,000)/ 500000 x 100
= 84%
Cost of Goods Sold = Sales – Gross profit
= 5,00,000 – 2,00,000
= Rs 3,00,000
Operating Expenses
All Expenses Debited in the Profit & Loss A/c Except Non-Operating Expenses
[including Finance expense] = 1,01,000 + 7,000 + 12,000 = 1,20,000
4. Stock Turnover Ratio = Cost of Goods Sold / Average Stock
= 3,00,000/87,375
= 3.43 times
Average Stock = (Opening Stock + Closing Stock)/2
=(76,250 + 98,500) / 2
= 87,375
References
- Foster, G.: Financial Statement Analysis, Englewood Cliffs, NJ, Prentice Hall.
- Sahaf M.A – Management Accounting – Principles & Practice – Vikash Publication
- Foulke, R.A.: Practical Financial Statement Analysis, New York, McGraw-Hill.
- Hendriksen, E.S.: Accounting Theory, New Delhi, Khosla Publishing House.
- Kaveri, V.S.: Financial Ratios as Predictors of Borrowers’ Health, New Delhi, Sultan Chand.
- Lev, B.: Financial Statement Analysis – A New Approach, Englewood Cliffs, NJ, Prentice Hall.