Unit-4
Multivariate Ratio Analysis
Multivariate analysis (MVA) is a Statistical procedure for analysis of data involving more than one type of measurement or observation. It may also mean solving problems where more than one dependent variable is analysed simultaneously with other variables. The measurements are referred to as variables and the objects are called units. Multivariate Analysis helps in summarizing data and reducing the chances of spurious results. Two main multivariate analysis methods are:
- Dependence Analysis – It is used in predicting the dependency among variables. Example: Multiple Regression
- Interdependence Analysis – It is used in analysing the relationships among variables or objects where none of them are dependent. Example : Factor Analysis.
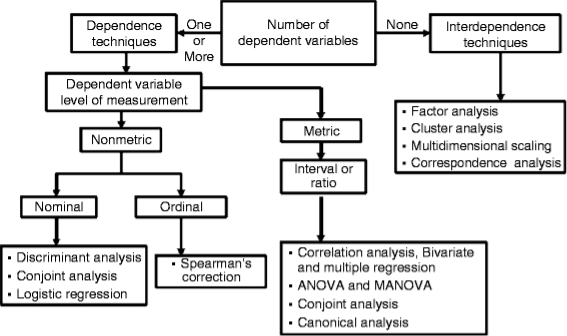
Figure: Overview of multivariate analysis
Source: https://www.google.com
Advantages of Multivariate Analysis
The benefits of multivariate analysis are discussed below-
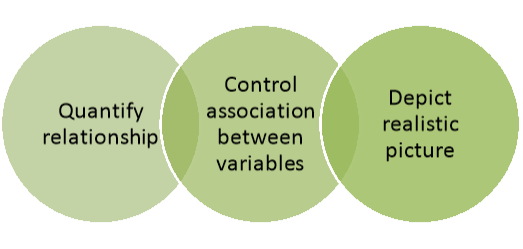
Figure: Advantages of multivariate analysis
- Multivariate techniques allow researchers to look at relationships between variables in an overarching way and to quantify the relationship between variables.
- They can control association between variables by using cross tabulation, partial correlation and multiple regressions, and introduce other variables to determine the links between the independent and dependent variables or to specify the conditions under which the association takes place.
- It able to depict a more realistic picture than looking at a single variable. Further, multivariate techniques provide a powerful test of significance compared to univariate techniques.
Limitations of Multivariate Analysis
The limitations of multivariate analysis are as follows-
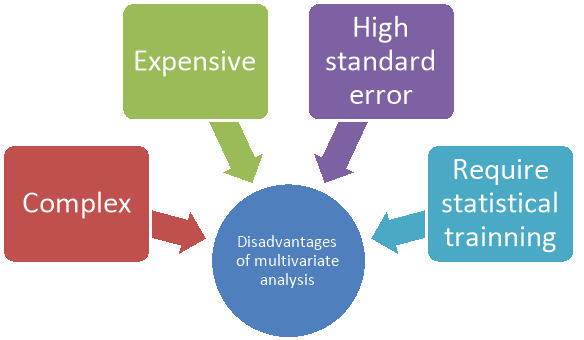
Figure: Disadvantages of multivariate analysis
- Multivariate techniques are complex and involve high level mathematics that required a statistical program to analyse the data.
- These statistical programs can be expensive for an individual to obtain. One of the biggest limitations of multivariate analysis is that statistical modelling outputs are not always easy for students to interpret.
- For multivariate techniques to give meaningful results, they need a large sample of data; otherwise, the results are meaningless due to high standard errors.
- Running statistical programs is fairly straightforward but does require statistical training to make sense of the data.
KEY TAKEAWAYS
- MULTIVARIATE ANALYSIS (MVA) IS A STATISTICAL PROCEDURE FOR ANALYSIS OF DATA INVOLVING MORE THAN ONE TYPE OF MEASUREMENT OR OBSERVATION. IT MAY ALSO MEAN SOLVING PROBLEMS WHERE MORE THAN ONE DEPENDENT VARIABLE IS ANALYSED SIMULTANEOUSLY WITH OTHER VARIABLES.
The objectives of multivariate analysis are discussed below-
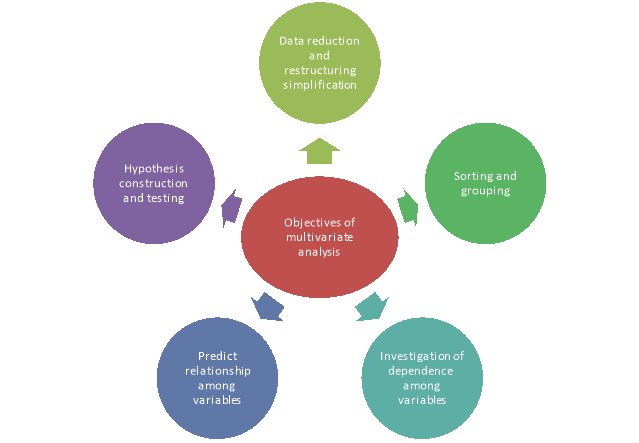
Figure: Objectives of multivariate analysis
(1) Data reduction or structural simplification: This helps data to get simplified as possible without sacrificing valuable information. This will make interpretation easier.
(2) Sorting and grouping: When we have multiple variables, Groups of “similar” objects or variables are created, based upon measured characteristics.
(3) Investigation of dependence among variables: The nature of the relationships among variables is of interest. Are all the variables mutually independent or are one or more variables dependent on the others?
(4) Prediction Relationships between variables: must be determined for the purpose of predicting the values of one or more variables based on observations on the other variables.
(5) Hypothesis construction and testing. Specific statistical hypotheses, formulated in terms of the parameters of multivariate populations, are tested. This may be done to validate assumptions or to reinforce prior convictions.
KEY TAKEAWAYS
- THE OBJECTIVES OF MULTIVARIATE ANALYSIS ARE DATA REDUCTION OR STRUCTURAL SIMPLIFICATION, INVESTIGATION OF DEPENDENCE AMONG VARIABLES, INVESTIGATION OF DEPENDENCE AMONG VARIABLES, HYPOTHESIS CONSTRUCTION AND TESTING ETC.
The uses of multivariate analysis are as follows-
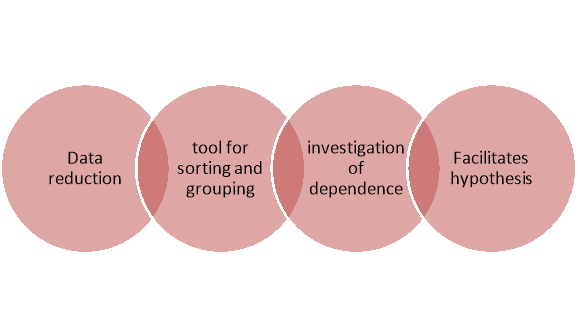
Figure: Usage of multivariate analysis
- It helps in data reduction and structural simplification.
- It is used as tool for sorting and grouping of large data.
- It is used in investigation of the dependence among variables.
- It facilitates prediction of financial position, assets and liabilities of the company.
- It facilitates hypothesis construction and testing of data.
Limitations of Multivariate Analysis
The limitations of multivariate analysis are-
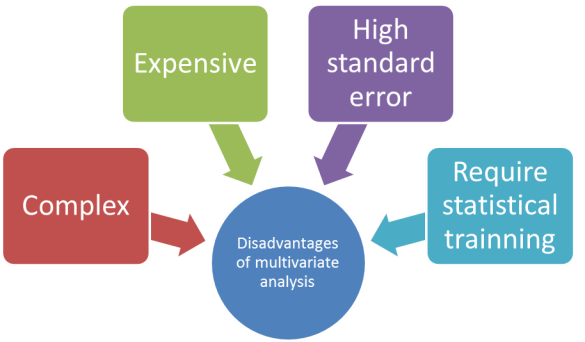
Figure: Disadvantages of multivariate analysis
1. Multivariate techniques are complex and involve high level mathematics that required a statistical program to analyse the data.
2. These statistical programs can be expensive for an individual to obtain. One of the biggest limitations of multivariate analysis is that statistical modelling outputs are not always easy for students to interpret.
3. For multivariate techniques to give meaningful results, they need a large sample of data; otherwise, the results are meaningless due to high standard errors.
4. Running statistical programs is fairly straightforward but does require statistical training to make sense of the data.
KEY TAKEAWAYS
- THE USAGES OF MULTIVARIATE ANALYSIS ARE DATA REDUCTION, TOOL FOR SORTING AND GROUPING, INVESTIGATION OF THE DEPENDENCE, FACILITATES PREDICTION ETC.
Both univariate and multivariate analysis both are used as tool for financial analysis. The differences between these two concepts are-
Sl no | Univariate analysis | Multivariate analysis |
| A univariate analysis is the most basic type of quantitative analysis. | A multivariate analysis is based on two or more variables within a financial model. |
2. Variable | It is carried out using a single variable | It is carried out using a multiple variable. |
3. Use | Univariate analysis is primarily used at the initial stages, by analysing data that is already available. | Multivariate analysis is used for inferential research, as two or more variables can be unknown or approximated. |
4. Objective | Univariate analysis is usually utilized for descriptive purposes. | Multivariate analysis is aimed towards explanations. |
5. Limitation | The univariate model assumes a business fails when any one of these financial ratios indicate financial difficulty | A multivariate financial analysis can be difficult and costly to run. |
KEY TAKEAWAYS
- A UNIVARIATE ANALYSIS IS THE MOST BASIC TYPE OF QUANTITATIVE ANALYSIS.
- A MULTIVARIATE ANALYSIS IS BASED ON TWO OR MORE VARIABLES WITHIN A FINANCIAL MODEL.
Financial statement are analysed to identify the true financial affairs of the company. Most frequently used techniques of financial statement analysis are discussed below-
- Comparative Statements (horizontal analysis): These are the statements depicting the financial position and profitability of an enterprise for the distinct timeframe in a comparative form to give a notion about the position of 2 or more periods. It usually applies to the 2 important financial statements, namely, statement of profit and loss and balance sheet outlined in a comparative form. Comparative figures signify the direction and trend of financial position and operating outcomes. This type of analysis is also referred to as ‘horizontal analysis’.
- Common Size Statements (Vertical Analysis): Common size statements are the statements which signify the association of distinct items of a financial statement with a generally known item by depicting each item as a % of that common item. Such statements allow an analyst to compare the financing and operating attributes of 2 enterprises of distinct sizes in a similar industry. This analysis is also referred to as ‘Vertical analysis’.
- Cash Flow Analysis: It refers to the analysis of the actual movement of cash into and out of an establishment. The flow of cash into the trading concern is called cash inflow or positive cash flow and the flow of cash out of the enterprise is known as negative cash flow or cash outflow. The difference between the outflow and inflow of cash is the net cash flow. Hence, it compiles the reasons for the changes in the cash position of a trading concern between dates of 2 balance sheets.
- Ratio Analysis: It characterizes the vital association which exists between several items of a B/S (balance sheet) and a statement of P&L of an enterprise. As a method of financial analysis, accounting ratios compute the comparative importance of the single items of the position and income statements. It is feasible to evaluate the solvency, efficiency, and profitability of an enterprise via the method of ratio analysis.
- Trend Analysis: Trend analysis is used to reveal the trend of items with the passage of time and is generally used as a statistical tool. Trend analysis is used in conjunction with ratio analysis, horizontal and vertical analysis to spot a particular trend, explore the causes of the same and if required prepare future projections.
- Regression Analysis: Regression analysis is a statistical tool used to establish and estimate relationship among variables. Generally, the dependent variable is related to one or more independent variables. In case of financial statement analysis, the dependent variable may be, say, sales, and it is required to estimate its relationship with the independent variable, say, a macroeconomic factor like Gross Domestic Product.
- Graphical Analysis: Graphs provide visual representation of the performance that can be easily compared over time. The graphs may be line graphs, column graphs or pie charts.
KEY TAKEAWAYS
- MOST FREQUENTLY USED TECHNIQUES OF FINANCIAL STATEMENT ANALYSIS ARE COMMON SIZE STATEMENT, COMPARATIVE STATEMENT, TREND ANALYSIS, RATIO ANALYSIS, REGRESSION, GRAPHICAL ANALYSIS ETC.
References
- Foster, G.: Financial Statement Analysis, Englewood Cliffs, NJ, Prentice Hall.
- Sahaf M.A – Management Accounting – Principles & Practice – Vikash Publication
- Foulke, R.A.: Practical Financial Statement Analysis, New York, McGraw-Hill.
- Hendriksen, E.S.: Accounting Theory, New Delhi, Khosla Publishing House.
- Kaveri, V.S.: Financial Ratios as Predictors of Borrowers’ Health, New Delhi, Sultan Chand.
- Lev, B.: Financial Statement Analysis – A New Approach, Englewood Cliffs, NJ, Prentice Hall.