Unit 3
Approaches to Equity Analysis
Fundamental analysis is one of the three approaches to security valuation. It is based on the premise that in the long run true or fair value of an equity share is equal to its intrinsic value. The intrinsic value of a share is the present value of all future expected cash inflows from the share. If the intrinsic value is greater than current price of the share, the share is under-priced and hence a good buy. Fundamental analysis is used primarily to identify securities that are mispriced i.e. that are undervalued or overvalued. There can be two approaches to fundamental analysis –
Fundamental analysis involves analysis of the following parameters-
- Balance sheet.
- Income statement.
- Cash flow statement.
- Notes to financial statements.
- Auditor’s report.
- Social and sustainability reports, if any
- Corporate governance reports.
2. Earnings analysis or Profitability: Earnings analysis is an important component of company analysis because future cash inflows from an equity share depend to a great extent on the earnings of the company. A company’s overall profitability may be analysed using operating profit margin, return on capital employment (ROCE), Return on asset (ROA), Return on Investment ( ROI), net profit margin etc.
3. Return on Equity (ROE): Return on equity is that part of total earnings of the company which belongs to equity shareholders. It is calculated by dividing profit after tax and preference dividend by the amount of equity shareholders’ funds or net worth.
Return on Equity= PAT - Preference dividend*100/Equity shareholders funds.
4. Earnings per share (EPS): Earnings per share is calculated by dividing the amount of profit after tax and preference dividends by the total number of outstanding equity shares of the company. Hence it shows how much amount is earned per equity share of the company. It is easy to understand than any other ratio and is widely reported in news and media. An increasing EPS shows the relative strength of the company.
Earning per share = PAT - Preference dividend/Number of equity shares
5. Price Earnings Ratio (P/E): Analysis of price earnings ratio or P/E ratio as we popularly call it is an important ingredient of company analysis. P/E ratio is calculated by dividing market price per share by the EPS.
Price Earnings Ratio = Market price per share/EPS
6. Book Equity to Market Equity Ratio (BE/ME): A related valuation ratio is Book equity to Market Equity ratio. It is calculated by dividing the Book Value of Equity share by the Market price.
BE/ME Ratio= Book Value per share/Market price per share
Key takeaways-
1) Fundamental analysis is one of the three approaches to security valuation. It is based on the premise that in the long run true or fair value of an equity share is equal to its intrinsic value.
Technical analysis is the study of financial market action. The technician looks at price changes that occur on a day-to-day or week-to-week basis or over any other constant time period displayed in graphic form, called charts. Technical analysts examine the price action of the financial markets instead of the fundamental factors that (seem to) effect market prices. Different techniques of technical analysis are-
The bar charts are:
One single bar shows the high and the low of the respective trading period. A vertical bar is used to connect the high and the low. Horizontal lines are used to show the opening price (left) of that specific trading period and the closing price (right) at the end of the period.

 High High
 open
open
 close
close
Low Low
2. Line charts
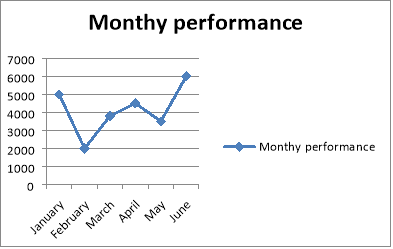
A line chart is the simplest of all methods. It is constructed by joining together the closing price of each period, for example daily closings for the daily line chart, weekly closings for the weekly chart or monthly closings for the monthy line chart.

3. Trend lines
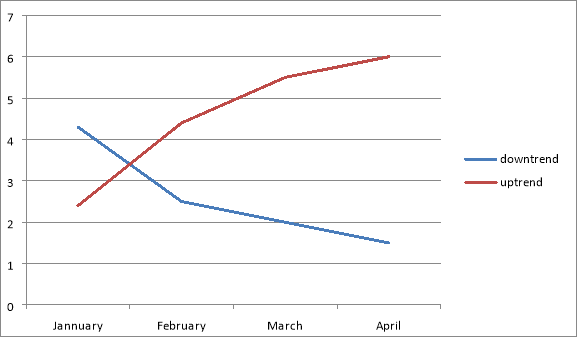
The trend line is nothing more than a straight line drawn between at least three points. In an up-move the low points are connected to form an uptrend line. For a downtrend the peaks are connected. The important point is that it should not be drawn over the price action. Trend-lines must encorporate all of the price data, i.e. connect the highs in a downtrend and the lows in an uptrend.

4. Investment horizons
The charts on the previous pages show that investors require perspective. It is imperative to differentiate between a short-term, a medium-term and a long-term trend.
5. Moving averages
Moving averages are popular and versatile for identifying price trends. They smooth out fluctuations in market prices, thereby making it easier t0 determine underlying trends. The simple moving average is the most widely used.
6. The simple moving average (SMA)
The simple moving average yields the mean of a data set for a given period. The moving average is usually plotted on the same chart as price movements, so a change in direction of trend can be indicated by the penetration/crossover of the SMA.
7. Momentum
In financial markets it is measured by the speed of the price trend, i.e. whether a trend is accelerating or decelerating, rather than the actual price level itself. While moving averages are lagging indicators, giving signals after the price trend has already turned, momentum indicators lead the price trend. They give signals before the price trend turns.
Efficient market hypothesis
An efficient capital market is one in which security prices adjust rapidly to the arrival of new information and, therefore, the current prices of securities reject all information about the security. The efficient market hypothesis (EMH) asserts that prices for assets are efficient with respect to available information. The hypothesis implies that no investment strategy based on current or historical information produces extraordinary large products. With thousands of investment advisory services, mountains of information, and millions of investors, the adjustment of prices to new information is almost instantaneous. Assumptions made for the requirements of an efficient market include:
Efficient market hypothesis could have some implications regarding the following:
1) Technical analysis: markets adjust gradually to new information. Traders can develop rules to detect a move to a new equilibrium price and buy or sell ahead of the rest of the market. EMH assumes that the market adjusts to new information much more rapidly and therefore such technical trading rules should be useless.
2) Fundamental analysis: assets have an intrinsic value. This can be determined by analysis of various factors. If the market price differs from the intrinsic value, one buys or sells as appropriate. One must estimate intrinsic value better than the market on average.
3) Aggregate market analysis: EMH states that past data are not useful in themselves in selecting superior stocks, so in order to take advantage of long run price moves one must do a superior job of identifying and estimating the relevant variables that cause prices to move.
4) Industry and Company Analysis: the crucial factor here is to be able to forecast the relevant variables that affect industry and firm performance better than the market. The strong-form EMH tests suggest that there may be superior analysts, and cross-sectional tests suggest that some variables may have useful information for analysts. For fundamental analysts to do better than the market is to: (1) identify the relevant variables that affect a security’s return; and (2) do a better job than average in forecasting those variables.
5) Portfolio Management: If one has a superior analysts, one should follow their recommendations. Analysts should concentrate their energies on taking advantage of a possible neglected firm effect. In case a portfolio without superior analysts, then one should measure clients’ risk preferences, then build a portfolio that rejects those preferences. The portfolio should be completely diversified and one should be minimizing transaction costs.
Key takeaways-
1) Technical analysis is the study of financial market action. The technician looks at price changes that occur on a day-to-day or week-to-week basis or over any other constant time period displayed in graphic form, called charts.
Myron Gordon used the dividend capitalization approach to study the effect of the firms’ dividend policy on the stock price.
Assumptions
The following are the assumptions based on which Gordon based the dividend policy model for firms: –
Gordon model assumes that the investors are rational and risk averse. They prefer certain returns to uncertain returns and thus put a premium to the certain returns and discount the uncertain returns. Thus, investors would prefer current dividends and avoid risk. Retained earnings involve risk and so the investor discounts the future dividends. This risk will also affect the stock value of the firm.
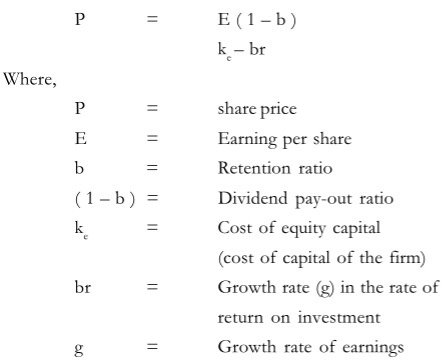
Gordon explains this preference for current income by the bird- in-hand argument. Since, a bird-in-hand is worth two in bush, the investors would prefer the income that they earn currently to that income in future which may be or may not be available. Thus, investors would prefer to pay a higher price for the stocks, which earn them current dividend income and would discount those stocks, which either postpones / reduce the current income. The discounting will differ depending on the retention rate (percentage of retained earnings) and the time. Gordon’s dividend capitalization model gave value of the stock as

So, Gordon correlated that the firm’s share value is positive with the payout ratio when re > ke and decreases with an increase in the pay-out ratio when r > ke. Thus, firms with rate of return greater than the cost of capital should have a higher retention ratio and those firms, which have a rate of return less than the cost of capital, should have a lower retention ratio.
The dividend policy of firms which have a rate of return equal to the cost of capital will however not have any impacts on its share value.
The constant-growth DDM (aka Gordon Growth model) assumes that dividends grow by a specific percentage each year, and is usually denoted as g, and the capitalization rate is denoted by k.

The constant-growth model is often used to value stocks of mature companies that have increased the dividend steadily over the years. Although the annual increase is not always the same, the constant-growth model can be used to approximate an intrinsic value of the stock using the average of the dividend growth and projecting that average to future dividend increases.
Key takeaways-
1) Myron Gordon used the dividend capitalization approach to study the effect of the firms’ dividend policy on the stock price.
Valuation multiples are financial measurement tools that evaluate one financial metric as a ratio of another, in order to make different companies more comparable. There are two main types of valuation multiples:
Investment decisions make use of equity multiples especially when investors look to acquire minor positions in companies. The list below shows some common equity multiples used in valuation analyses.
Key takeaways-
1) Valuation multiples are financial measurement tools that evaluate one financial metric as a ratio of another, in order to make different companies more comparable.
References:
1. Jones, C.P. Investments Analysis and Management, Wiley, 8th ed.
2. Chandra, Prasanna. Investment Analysis and Portfolio Management. McGraw Hill Education.
3. Rustogi, R.P. Fundamentals of Investment. Sultan Chand & Sons, New Delhi.
4. Vohra N.D. & Bagri B.R., Futures and Options, McGraw Hill Education.