Unit - 1
Atomic Spectra and Models
1.1.1 The inadequacy of Classical Mechanics is:
1] It is not valid in the atomic dimension range.
2] It was unable to explain the reported black body radiation spectra.
3] The diversity in metal and gas specific heats is also unaccounted for.
4] It was unable to explain the spectrum of black body radiation seen.
5] It was unable to explain the genesis of atoms' distinct spectra. This is because energy changes are always constant according to classical mechanics.
6] A huge number of phenomena could not be explained by classical mechanics. Photoelectric effect, Raman effect, and others are examples.
Quantum Mechanics arose from the weakness of Classical Mechanics.
1.1.2 THREE FAILURES OF CLASSICAL PHYSICS:
1. Blackbody Radiation
Light is emitted at all wavelengths by any object with a temperature greater than absolute zero. The light that comes from an object that is absolutely black (and so does not reflect any light) is known as blackbody radiation.
All wavelengths of light do not share the energy of blackbody radiation equally. The blackbody radiation spectrum (below) reveals that some wavelengths get more energy than others. Three spectra at three distinct temperatures are illustrated. (One of the curves represents the Sun's surface temperature, which is 5770 K.)
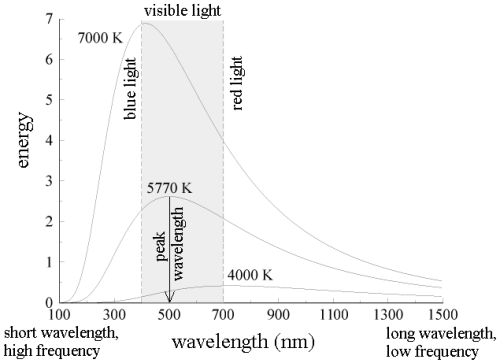
Here are some blackbody radiation experimental facts:
a. The blackbody spectrum is determined only by the object's temperature, not its composition. If their temperatures are the identical, an iron horseshoe, a ceramic vase, and a piece of charcoal will all radiate the same blackbody spectrum.
b. An object emits more blackbody energy at all wavelengths as its temperature rises.
c. As an object's temperature rises, the blackbody spectrum's peak wavelength becomes shorter (bluer). Blue stars, for example, are hotter than red stars.
d. The left-hand side of the blackbody spectrum is usually tiny (the short wavelength, high frequency side).
The explanation of classical physics: When an electric charge vibrates, it produces light, which is an electromagnetic wave. (The term "vibrates" refers to any change in the charge's motion, such as speeding up, slowing down, or changing direction.) Remember that heat is nothing more than the kinetic energy of random motion. Electrons vibrate in random directions in a heated object, producing light as a result. A hotter object produces more energetic vibrations, which results in more light being emitted —- it lights brighter. So far, everything has gone well. Classical physics, on the other hand, was unable to explain the form of the blackbody spectrum.
A heated object's electrons can vibrate at a variety of frequencies, from a few vibrations per second to thousands of vibrations per second. In reality, there is no limit to the frequency that can be used. According to classical physics, each vibration frequency should have the same energy. Because the frequency has no upper limit, the energy of the vibrating electrons at high frequencies has no upper limit. This indicates that, according to classical physics, the energy of light produced by electrons vibrating at high frequencies has no limit. The blackbody spectrum always becomes smaller on the left-hand side in experiments (short wavelength, high frequency).
Max Planck came up with the solution in 1900. He claimed that the traditional concept that each vibration frequency should have the same energy was incorrect. Instead, he claimed that electrons vibrating at various frequencies do not share energy evenly. Energy, according to Planck, arrives in clumps. A clump of energy was dubbed a quantum by him. The size of a clump of energy —- a quantum —- is determined by the vibration frequency. Planck's rule for a quantum of energy for a vibrating electron is as follows:
Quantum energy = (a calibration constant) x (frequency of vibration)
Or
Hf = E
The calibration constant, h, is now known as Planck's constant. It’s worth is approximately 6 x 10-34, which is quite small!
So, how does this explain the blackbody radiation spectrum? According to Planck, an electron vibrating at frequency f could only have an energy of 1 hf, 2 hf, 3 hf, 4 hf, and so on; that is, an electron vibrating at frequency f could only have an energy of 1 hf, 2 hf, 3 hf, 4 hf, and so on.
(Any integer) x hf = energy of a vibrating electron
If the electron is to vibrate, it must have at least one quantum of energy. If it doesn't have at least 1hf of energy, it won't vibrate and won't be able to create any light. Exclaimed Planck, "the amount of energy in a quantum, hf, is so great at high frequencies that the high-frequency vibrations can never get underway!" This is why the left-hand (high frequency) side of the blackbody spectrum is always narrow.
2. The Photoelectric Effect
When light shines on a metallic substance's surface, electrons in the metal absorb the light's energy and are able to escape through the metal's surface. The photoelectric effect is utilised to generate the electrical current that powers many solar-powered gadgets. Classical physicists predicted that when utilising very weak light, it would take some time for enough light energy to build up to eject an electron from a metallic surface, based on the assumption that light is a wave with energy spread uniformly across the wave. Experiments reveal that it doesn't matter how weak the light is if it can eject electrons from a metal if it has a specific frequency. There is no such thing as a time delay.
Albert Einstein came up with the solution in 1905. If Max Planck's theory of energy clumps (quanta) is right, light must be made up of a stream of clumps of energy. Einstein defined a photon as a clump of light energy with an energy equal to hf (Planck's constant multiplied by the frequency of the light). As a result, light energy is concentrated in photons rather than being distributed uniformly along the wave. A lower light intensity indicates fewer photons, yet lowering the light intensity (without changing the frequency) has no effect on the energy of individual photons. So, if a single photon has enough energy to eject one electron from a metallic surface for a given frequency light, electrons will always be ejected as soon as the light is turned on and the photons hit the metal.
3. The Hydrogen Atom
When a little hydrogen gas tube is heated, it glows and emits light. This light, unlike blackbody radiation from a heated dense solid or gas, has only a few colours (wavelengths): a red wavelength, a turquoise wavelength, and numerous violets. At the turn of the century, classical physicists assumed that because hydrogen is the simplest atom, they should be able to grasp it. A positively charged proton is at the heart of hydrogen, with a negatively charged electron surrounding it. The electron is kept in orbit by the electrical attraction between the positive proton and the negative electron, just as the Earth is kept in orbit by the gravitational force between the Sun and the Earth. There was only one issue. Because the circling electron's orientation is continually changing, classical physics predicted that it would generate electromagnetic radiation —- light. As a result, the electron should be losing energy all the time. Physicists calculated that the electron would lose all of its energy and spiral down into the proton in less than 0.000000000001 second! To put it another way, atoms should not exist for more than 10-12 seconds. INACCURATE!!
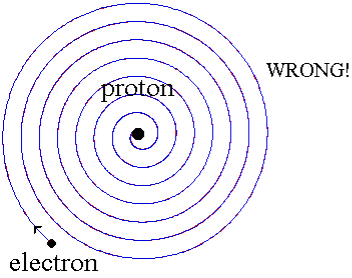
In 1913, Niels Bohr offered an explanation. The electron in the Bohr model of the hydrogen atom can't orbit the proton in any size orbit it wants. Only particular orbits are permitted, and each permitted orbit has a specific radius and energy. Bohr devised a formula for calculating the size and energy of each orbit. If you're interested, Bohr's rule stated that
2 x (electron mass) x (electron orbital speed) x (orbit radius) = (any integer) x h, which isn't really evident. (For the smallest orbit, the integer would be 1, for the following orbit out, and so on.) In order to explain why the hydrogen atom may last longer than 0.000000000001 second, Bohr devised a new criterion. According to him, when an electron is in an authorised orbit, it does not emit electromagnetic radiation. Bohr did not explain why; instead, he postulated a new natural law. Niels Bohr's theory was backed up by nature. His new hydrogen model produced wavelengths for hydrogen gas that were identical to what was measured.
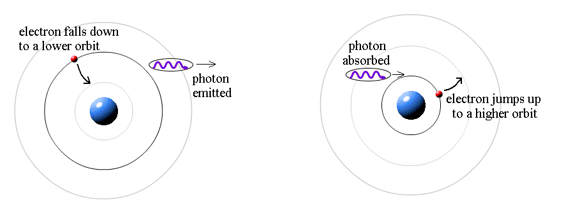
Where does the light that comes from hydrogen come from if electrons do not create light while they are in their authorised stable orbits? According to Bohr, when electrons are in larger orbits, they have greater energy. An electron loses energy when it moves from a bigger to a smaller orbit. The energy lost by the electron must go somewhere, according to the rule of conservation of energy. A photon transfers away the lost energy from the hydrogen atom, according to Bohr.
(Electron energy in bigger orbit) - photon energy (electron energy in smaller orbit)
It works the other way, too. If a photon strikes an atom, the atom can absorb the photon and its energy if (and only if) the photon's energy is exactly equal to the difference between two orbital energies. In this case, an electron uses the photon's energy to jump from the smaller orbit up to the larger orbit. This is called a quantum jump.
1.1.3 WAVES OR PARTICLES?
On a screen, light passing through a double-slit produces an interference pattern consisting of bright and dark bands. When the waves from one slit merge with the waves from the other slit, this occurs. When the crests of two waves meet on the screen, the waves combine to form a brilliant band. When a wave crest from one slit collides with a wave trough from the other, the waves cancel and a dark band result. This demonstrates that light is in fact a wave.
The photoelectric effect, on the other hand, reveals that light is made up of massless particles known as photons.
If you want to understand how light propagates and goes from one point to another, think of it as a wave. The wave characteristics of light must be used to describe how light travels from the double slits to the screen.
If you wish to understand how light interacts with matter, think of it as particles (photons). The particle characteristics of light must be used to describe how light interacts with electrons in a metal and how it ejects them from the metal's surface.
Light is said to have a wave-particle duality. Depending on the situation, it can behave like waves or particles (but not both at the same time).
Recalling the photoelectric effect, how can a photon (which has no mass) cause an electron to move? Even massless photons have momentum, according to Einstein's theory of relativity. For a massed particle, Newton defined momentum as (mass) x (velocity), but Einstein was able to establish that the momentum of a massless photon is determined by its wavelength:
The photon's momentum increases as the wavelength gets smaller.
Prince Louis de Broglie of France had an idea in 1923. Maybe everything in nature is governed by the wave-particle duality. Everything propagates like a wave, and everything interacts like a particle, according to him. De Broglie modified Einstein's formula for photon momentum and applied it to a mass particle:
We don't notice the wavelength of a thrown baseball, which is only about 10-35 metres, since Planck's constant, h, is so little! However, because an electron's mass is so little, its wavelength is around 10,000 times shorter than that of visible light. This is useful since electron-wave microscopes can see thousands of times more detail than light-wave microscopes!
Electrons were fed through a double slit and counted as they hit a screen, proving that they propagate like a wave. If the electrons had moved in a continuous stream, they would have simply piled up behind the two slits. They didn't, however. They displayed a double-slit interference pattern with bright and dark bars, precisely like light waves do. Without a doubt, electrons demonstrate nature's wave-particle duality. Every huge thing, in fact, demonstrates nature's wave-particle duality. It's just not evident on a grand scale in our daily lives.
1.1.4 The Problems with Classical Physics
By the late nineteenth century, the laws of physics were based on Mechanics and the law of Gravitation from Newton, Maxwell's equations describing Electricity and Magnetism, and on Statistical Mechanics describing the state of large collection of matter. Under most circumstances, these principles of physics accurately described nature; nonetheless, some measurements from the late 19th and early 20th centuries were difficult to comprehend. Quantum Mechanics and Special Relativity were developed in response to issues with classical physics.
Here are some of the issues that led to the development of Quantum Mechanics.
Black Body Radiation: Classical physics predicted that hot objects would instantly radiate away all their heat into electromagnetic waves. The calculation, which was based on Maxwell's equations and Statistical Mechanics, showed that the radiation rate went to infinity as the EM wavelength went to zero, The Ultraviolet Catastrophe''. Plank solved the problem by postulating that EM energy was emitted in quanta with
E = hv.
The Photoelectric Effect: When light was employed to knock electrons out of solids, the results were far from what Maxwell's equations predicted. If light is made up of particles with the energy Plank proposed, the measurements were simple to explain (for Einstein).
Classical physics anticipated that the atomic electrons orbiting the nucleus would radiate their energy away and spiral into the nucleus when Rutherford discovered that the positive charge in atoms was concentrated in a relatively small nucleus. Clearly, this did not occur. In contrast to classical physics assumptions, the energy radiated by atoms likewise came out in quantized proportions. The Bohr Atom proposed an angular momentum quantization rule for that yielded the correct answer for hydrogen, but it was later discovered to be incorrect because hydrogen's ground state has zero angular momentum. To explain the atomic energy spectra, a thorough understanding of quantum mechanics was required.
Compton Scattering: When light was scattered off electrons, it behaved like a particle but changed wave length; additional proof for light's particle nature and Plank's hypothesis.
Waves and Particles: Light was demonstrated to behave like a wave in diffraction tests, yet as a particle in experiments like the Photoelectric effect. Even though we can only detect an integer number of electrons, more harder diffraction experiments revealed that electrons (along with other particles) behave like a wave (or photons).
All of the following phenomena are explained by quantum mechanics, which involves a wave-particle duality. Quantum Mechanics fundamentally alters our knowledge of nature in this way. While conventional physics is deterministic, quantum mechanics is probabilistic. We can only anticipate the likelihood of a particle being discovered in a specific region of space.
Photons are particles that make up electromagnetic waves like light. Based on Plank's formula, Einstein hypothesised that the energy of light particles was related to their frequency.
E = hv
Quantum Mechanics' new theory is that the probability of each particle (as a function of position and time) is equal to the square of a probability amplitude function, and that these probability amplitudes obey a wave equation. This is similar to the situation in electromagnetism, where the energy density of the field is proportional to the square of the field, and thus the photon probability density is proportional to the square of the field, despite the fact that the field is made up of waves. In many ways, probability amplitudes are similar to the fields we know from electromagnetic.
DeBroglie assumed E = hv for photons and other particles and used Lorentz invariance (from special relativity) to derive the wavelength for particles like electrons.

The rest of wave mechanics was built around these ideas, giving a complete picture that could explain the above measurements and could be tested to very high accuracy, particularly in the hydrogen atom. We will spend several chapters exploring these ideas.
Now we'll look at another conundrum that physicists faced at the turn of the century (1900): how do hot bodies radiate? Heat was known to cause the molecules and atoms of a solid to vibrate, and the molecules and atoms were themselves intricate patterns of electrical charges, so the mechanism was well understood. (As usual, Newton was right on the money.) Maxwell's predictions that oscillating charges create electromagnetic radiation were confirmed, at least for basic antennas, by Hertz and others' experiments. The fact that this radiation travelled at the speed of light was discovered thanks to Maxwell's equations, and it was realised that light and the closely related infrared heat radiation were both electromagnetic waves. When a substance was heated, the resulting vibrations on a molecular and atomic scale unavoidably caused charge oscillations, according to the picture. Assuming that Maxwell's electromagnetic radiation theory, which worked so well in the macroscopic world, was also valid at the molecular level, these oscillating charges would radiate, presumably emitting the heat and light observed.
How is Radiation Absorbed?
What exactly does "black body" radiation imply? The argument is that the radiation emitted by a heated body is influenced by the body being heated to some amount. Let's take a step back for a moment and analyse how different materials absorb radiation. Some, such as glass, appear to absorb very little light and let it pass right through. A gleaming metallic surface does not absorb light; instead, it reflects it. Light and heat are almost fully absorbed by a black material like soot, and the material becomes warm. How can we explain these diverse behaviours in terms of light interacting with charges in the material, causing these charges to oscillate and absorb energy from the radiation? In the case of glass, this clearly does not occur, at least not frequently. What's to stop you? Quantum mechanics is required to fully comprehend why, but the fundamental notion is that there are charges—electrons—in glass that can oscillate in response to an applied external oscillating electric field, but these charges are strongly linked to atoms and can only oscillate at particular frequencies. (These charge oscillations occur as an electron jumps from one orbit to another, according to quantum experts.) Of course, in the 1890s, when the first precision work on black body radiation was being done, this was not understood.) Because none of these frequencies correlate to visible light in regular glass, there is no resonance with a light wave, and thus minimal energy is absorbed. As a result, glass is ideal for windows! That's a given. Glass, on the other hand, is opaque at frequencies outside the visual range (in general, both in the infrared and the ultraviolet). These are the natural oscillation frequencies of the electrical charge distributions in atoms or bonds.
How can we comprehend how a metal surface reflects light? Electrons in a piece of metal are free to move across the entire solid. This is what distinguishes a metal from other materials: it easily transmits both electricity and heat, which are conveyed by currents of freely moving electrons. (Well, vibrations do carry a small amount of heat.) Metals, on the other hand, are easily identifiable due to their lustrous appearance—why is that? Again, it's those free electrons: the electrical field of the incoming light wave drives them into enormous (compared to the atoms) oscillations, and this generated oscillating current radiates electromagnetically, exactly like a current in a transmitting antenna. The reflected light is the source of this radiation. Little of the incoming radiant energy is absorbed as heat by a polished metal surface; instead, it is reradiated, or reflected.
Consider a substance that absorbs light and does not transmit or reflect it. With soot, we're quite near to perfect absorption. It will conduct an electric current like a metal, but not nearly as effectively. Unattached electrons can flow across the entire solid, but they constantly collide with objects because they have a short mean free path. They create vibration when they bump, similar to balls hitting bumpers in a pinball machine, and hence release kinetic energy as heat. Although the electrons in soot have a shorter mean free path than those in a good metal, they travel far more freely than electrons attached to atoms (as in glass), allowing them to accelerate and absorb energy from the light wave's electric field. As a result, they are extremely efficient at converting energy from light waves to heat.
Relating Absorption and Emission
After seeing how soot absorbs radiation and converts it to heat, what about the other way around? When heated, why does it radiate? Imagine a pinball machine where the boundaries, etc., vibrate violently because they are supplied energy. At each collision, the balls (electrons) bouncing off them will accelerate suddenly, and these speeding charges will create electromagnetic waves. The electrons in a metal, on the other hand, have very long mean free pathways and are less affected by lattice vibrations, therefore they are less effective in collecting and radiating heat energy. It is clear from such considerations that good radiation absorbers are also good emitters.
In fact, we may be much more precise: a body emits radiation at a certain temperature and frequency in the same way that it absorbs it. Kirchhoff demonstrated this: if we assume a body can absorb better than it emits, then in a room full of objects all at the same temperature, it will absorb radiation from the other bodies better than it will radiate energy back to them. This means it will heat up as the rest of the room cools down, which is in direct violation of the second rule of thermodynamics. (With such a body, we could build a heat engine that extracts work as the room gets colder and colder!)
But why does a metal light when heated sufficiently? As the temperature rises, the atoms' lattice vibrates more and faster, scattering and speeding up the electrons. At high enough temperatures, even glass glows as the electrons loosen and vibrate.
The “Black Body” Spectrum: a Hole in the Oven
Any body that is above absolute zero will radiate to some extent, with the intensity and frequency distribution of the radiation varying depending on the body's detailed structure. To begin analysing heat radiation, we must first define the body that is radiating: the simplest feasible situation is an idealised entity that is a perfect absorber, and hence also a perfect emitter (based on the above logic). This is referred to as a "black body" for obvious reasons.
But we need to test our theories in the lab: how can we build a perfect absorber? OK, nothing is perfect, but Kirchhoff had a nice notion in 1859: any radiation that passes through a little hole in the side of a huge box bounces around inside, absorbing a lot of it on each bounce, and has little chance of ever getting out again. So, we can do it backwards: make an oven with a tiny hole on the side, and the radiation that comes out of the hole should be as close to a perfect emitter as we can get. Kirchhoff challenged theorists and experimentalists to calculate and measure the energy/frequency curve for this "cavity radiation," as he dubbed it (in German, of course: hohlraumstrahlung, where hohlraum means hollow room or cavity, strahlung is radiation). Kirchhoff's challenge in 1859, in fact, was the catalyst for quantum theory forty years later!
What Was Observed: Two Laws
Stefan's Law (1879) was the first quantitative conjecture based on experimental observation of hole radiation: the total power P radiated from one square metre of black surface at temperature T is proportional to the fourth power of the absolute temperature:
P=T4, =5.67108 watts/square meter/K4.
Boltzmann determined this T4 behaviour from theory five years later, in 1884: he used classical thermodynamic logic to apply to a box filled with electromagnetic radiation, utilising Maxwell's equations to relate pressure to energy density. (Of course, the minuscule quantity of energy escaping the hole would have the same temperature dependence as the intensity of the radiation inside.) Details of the derivation can be found in the appendices.
Wien's Law of Displacement (1893):
The frequency at which the emitted radiation is most strong varies with the oven temperature. The frequency is, in fact, directly related to the absolute temperature:
FmaxT is the maximum value of a function.
(This law was theoretically deduced by Wien in 1893, using Boltzmann's thermodynamic reasoning.) Langley, an American astronomer, had already observed it, at least semi-quantitatively.) The formula can be found in the appendices.
Indeed, everyone is aware with this upward shift in fmax with T: when an iron is burned in a fire, the initial visible radiation (at roughly 900K) is deep red, the lowest frequency visible light. At very high temperatures (10,000K or more), where the peak in radiation intensity has shifted beyond the visible into the ultraviolet, the hue changes to orange, yellow, and finally blue as T increases.
When it comes to harvesting solar energy, such as in a greenhouse, this shift in the frequency at which radiant power is at its peak is critical. The glass must allow solar radiation to pass through while blocking heat radiation. Because the two radiations have such distinct frequency ranges—5700K and, say, 300K—and because some materials are transparent to light but opaque to infrared radiation, this is possible. Only because fmax fluctuates with temperature do greenhouses work.
What Was Observed: the Complete Picture
By the 1890s, experimental techniques had advanced to the point where it was able to make reasonably precise measurements of the energy distribution in this cavity radiation, or black body radiation, as we'll call it. Wien and Lummer drilled a small hole in the side of an otherwise completely closed oven in 1895 at the University of Berlin, and began measuring the radiation that emerged.
The beam that emerged from the hole was passed through a diffraction grating, which transmitted the various wavelengths/frequencies in different directions, all of which were directed at a screen. The amount of radiant energy emitted in each frequency band was determined by moving a detector up and down the screen. (This is a theorist's model of the experiment; the actual experimental setup was far more complex.) For example, repeated reflections from quartz and other crystals were used to reduce higher frequency waves in order to make challenging infrared observations.) They discovered a radiation intensity/frequency curve that was nearly identical to this (correct one):
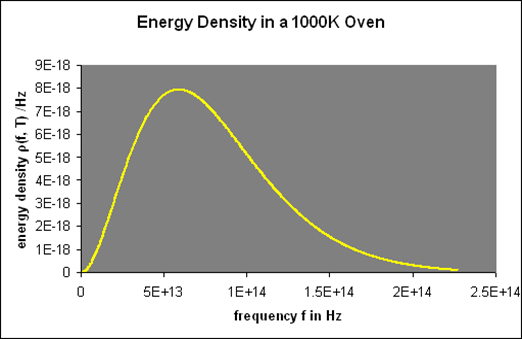
This oven glows bright red since the visible spectrum begins at roughly 4.31014 Hz.
One minor point: the energy density inside the oven is denoted by (f,T), which means that the energy in Joules/m3 in the frequency interval f,f+f is (f,T)f at temperature T.
Remember that the radiation within the oven contains waves going both directions, therefore only half of them will come out via the hole to locate the electricity pumped out. In addition, if the hole has area A, waves flowing in at an angle from the inside will view a smaller target area. As a result of these two influences, the
A=14Ac radiation power from a hole (f,T).
By analysing the black body curves at various temperatures, they were able to corroborate both Stefan's Law P=T4 and Wien's Displacement Law, for example:
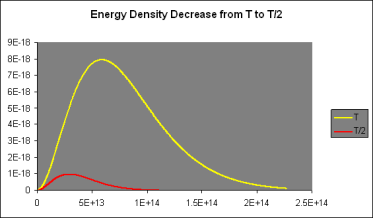
Let's take a closer look at these curves: For low frequencies, f, (f,T) was found to be proportional to f2, giving it a parabolic shape; however, as f grew beyond fmax, it fell below the parabola, peaking at fmax and then rapidly declining towards zero.
It was discovered that doubling the temperature doubled the strength of the radiation at low frequencies when (f,T) is parabolic. However, at 2T, the curve followed the doubled parabolic route for a significantly longer time before dropping away—in fact, twice as far, and fmax(2T)=2fmax (T).
The curve (f,2T) thus reaches eight times the height of the curve (f,1T) (f,T). (For further information, see the graph above.) It also spreads over twice the lateral extent, resulting in a sixteenfold rise in the area under the curve, which corresponds to the total energy radiated, when the temperature is doubled: P=T4 according to Stefan's Law.
Understanding the Black Body Curve
The key to a revolution was these exquisitely precise experimental data. Max Planck performed the first successful theoretical analysis of data in 1900. He focused on simulating the oscillating charges that must exist in the oven walls, radiating heat inwards while being driven by the radiation field in thermodynamic equilibrium.
The basic line is that he discovered he could account for the observed curve if he required these oscillators to lose or acquire energy in chunks, called quanta, of size hf for an oscillator of frequency f, rather than continuously, as the classical theory would require. The constant h is currently known as Planck's constant, with a value of 6.6261034 joulesec.
Planck computed the following formula for the radiation energy density within the oven based on this assumption:

The perfect agreement of this formula with exact observations, and the resulting need for energy quantization, was the most significant advancement in physics of the century.
But no one noticed for a long time! His black body curve was universally acknowledged as correct: more and more precise experiments proved it time and time again, but the quantum assumption's radical nature remained a mystery. Planck wasn't too bothered; he didn't believe it either, and he considered it as a technological remedy that would (he hoped) someday be obsolete.
Part of the problem was that Planck’s route to the formula was long, difficult and implausible—he even made contradictory assumptions at different stages, as Einstein pointed out later. But the result was right in any case, which is why we'll take a different, easier approach, which was started (but never completed) by Lord Rayleigh in England.
Rayleigh’s Sound Idea: Counting Standing Waves
Lord Rayleigh was taking a more direct approach to the radiation inside the oven in 1900, a few months before Planck's breakthrough work: he didn't even think about oscillators in the walls, he just took the radiation to be a collection of standing waves in a cubical enclosure: electromagnetic oscillators. These standing electromagnetic waves were absolutely clear, in contrast to the murky reality of the wall oscillators.
Rayleigh had solved an almost identical problem a quarter century before, an examination of stationary sound waves in a cubical room (page 267 of his book). The goal is to identify and count as many different standing waves as possible in the room/oven while staying within the boundary conditions. The amplitude of sound waves in a room decreases as they approach the walls. If the wall is a perfect conductor, the electric field parallel to it must go to zero for electromagnetic waves.
So, what are the standing waves that are permitted? Consider the several allowable modes of vibration, that is, standing waves, in a string of length a fixed at both ends as a warm-up exercise:
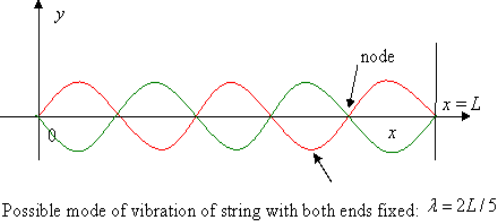
The possible values of wavelength are:
λ=2a, a, 2a/3, …
So the allowed frequencies are
f=c/λ=c/2a, 2(c/2a), 3(c/2a), …
These allowed frequencies are equally spaced c/2a apart. We define the spectral density by stating that
Number of modes between f and f+Δf=N(f)Δf
Where we assume that Δf is large compared with the spacing between successive frequencies. Evidently for this one-dimensional exercise N(f) is a constant equal to 2a/c, each mode corresponds to an integer point on the real axis in units c/2a.
The amplitude of oscillation as a function of time is:
y=Asin2πx/λsin2πft
More conveniently written
y=Asinkxsinωt, where k=2π/λ, ω=2πf, so ω=ck.
The allowed values of k (called the wave number) are:
k = 2π/λ = π/a, 2π/a, 3π/a, … f=ck/2π.
The generalization to three dimensions is simple: in a cubical box of side a, an allowed standing wave must satisfy the boundary conditions in all three directions. This means the choices of wave numbers are:
Kx = 2π/λx = π/a, 2π/a, 3π/a, …
Ky = 2π/λy = π/a, 2π/a, 3π/a,
Kz = 2π/λz = π/a, 2π/a, 3π/a, …
That is to say, each modes is labeled with three positive integers:

And the frequency of the mode is:
f = ck/2π = (c/2π) 
Frequency intervals measured experimentally for infrared and visible radiation in a moderately sized oven are significantly greater than the spacing c/2a of these integer points. These modes occupy the three-dimensional k -space uniformly, with density (a/)3, just as they did in the one-dimensional case, but now the mode density is not uniform as a function of frequency.
The volume in k-space, in units (/a)3, of the spherical shell of radius k=2f/c, thickness k=2f/c, and confined to all components of k being positive (like the integers), a factor of 1/8, is the number of them between f and f+f=N(f)f.
The density of states as a function of frequency in an oven of volume V=a3 is: Including a factor of 2 for the two polarisation states of the standing electromagnetic waves, the density of states as a function of frequency in an oven of volume V=a3 is:

Giving the density of radiation states in the oven

(This analyses' details can be found in the notes.) If you’re wondering why it’s OK to have an oven with essentially perfectly reflecting walls when we were previously insisting on absorbing walls, Kirchhoff proved long before that two such ovens at the same temperature will have the same radiation intensity—otherwise energy could be transferred from one to the other, violating the Second Law.)
What about Equipartition of Energy?
The energy equipartition is a key conclusion of classical statistical mechanics: for a system in thermal equilibrium, each degree of freedom has an average energy of 12kBT. (Boltzmann's constant is kB.) Thus molecules in a gas have average kinetic energy 32kBT, 12kBT for each direction, and a simple one-dimensional harmonic oscillator has total energy kBT: 12kBT kinetic energy and 12kBT potential energy.
Comparing now the formula for the number of modes N(f)Δf in a small interval Δf

With Planck’s formula for radiation energy intensity in the same interval:

For the low frequency modes hf≪kBT we can make the approximation

And it follows immediately that each mode has energy kBT, in line with classical predictions.
However, things go horribly wrong on a regular basis! The number of modes grows indefinitely, but the energy in these high-frequency modes decreases exponentially as the frequency rises. This was eventually termed the UV catastrophe by Ehrenfest. Rayleigh's sound strategy didn't appear to be that sound after all—something vital was lacking.
Planck never discussed equipartition, which is maybe unexpected. Of fact, as Rayleigh pointed out, equipartition was recognised to have issues, such as in the case of gas specific heat. In truth, Planck was unsure about the existence of atoms, writing subsequently that “I had been inclined to oppose atomism” in the 1890s (see notes). Even Boltzmann was unclear how successfully oscillators achieved thermal equilibrium with electromagnetic radiation—after all, it was well known that diatomic molecules oscillated with kinetic energy but did not achieve classical thermal equilibrium. (Maxwell observed that hot gases generate light at specific frequencies as early as 1877.) The oscillations must be simple harmonic because the frequencies do not change with temperature—but such an oscillator would surely be activated by collisions at low temperatures, so why wasn't energy delivered into this mode?)
Einstein Sees a Gas of Photons
As previously stated, there was a deafening hush on the matter for several years after Planck reported his result in December of 1900. No one, even Planck, grasped the significance of what he had accomplished—his work was widely regarded as merely a clever technical repair, despite the fact that it provided the correct answer (the curve itself was completely accepted as correct).
Then, in March of 1905, Albert Einstein became interested in the problem. He began by recalculating the Rayleigh result under the assumption of equipartition:

And observed that this made no sense at high frequencies. So he focused on Planck’s formula for high frequencies, hf≫kBT:

(Asymptotically identical for f→∞ to an earlier formula by Wien).
Einstein saw a parallel between this and the energy distribution in a classical gas.
Remember how the (normalised) probability distribution function for classical atoms as a function of speed v was in the previous lecture?

And the corresponding energy density in E is

The radiation formula at high frequencies is

If high frequency radiation is considered as a gas of independent particles with energy E=hf, Einstein pointed out that the energy density in frequency/energy in the radiation is

When compared to the expression for atoms, the analogy is close: remember that frequency is proportional to wave number and, after quantization, to momentum for radiation, and velocity is proportional to momentum for (nonrelativistic) atoms, so both these distributions are essentially in momentum space. Of course, the normalisation factors differ because, unlike total radiation, the total number of atoms does not change with temperature. Nonetheless, the analogy is convincing, leading Einstein to conclude that the radiation in the enclosure was quantized as well, rather than being a unique attribute of the wall oscillators, as Planck believed. Of course, the radiation quanta are photons, but that term wasn't coined until later.
Planck's derivation of his result had upset Einstein since it relied on a classical explanation of the interaction between the wall oscillator and radiation, followed by a declaration that the interaction was not at all like that. But the answer was correct, and Einstein was beginning to understand why. The electromagnetic standing wave oscillations in the oven, in contrast to the poorly known wall oscillators, were perfectly obvious.
Energy in an Oscillator as a Function of Temperature
The blackbody radiation curves have a straightforward interpretation in terms of Rayleigh's electromagnetic standing waves, according to Einstein: the average energy in an oscillator of frequency f at temperature T equals

Furthermore, Planck's work suggested that the material oscillators in the walls may be quantized in the same way.
The next step was taken by Einstein, who proposed that all oscillators, such as a vibrating atom in a solid, are quantized. This could explain why the Dulong Petit law, which gives 3kB of specific heat to each atom in a solid, fails at low temperatures: once kBThf, the modes are not activated and absorb little heat. As can be seen, the specific heat decreases. It also explains why diatomic gas molecules like oxygen and nitrogen don't seem to absorb heat into vibrational modes, which have a relatively low frequency.
Consider an oscillator in thermal equilibrium at temperature T and its continual energy exchange with the environment. The energy of random thermal fluctuations in a system is of order kBT, which is the amount of energy transmitted back and forth, roughly. However, if an oscillator has hf=5kBT, it can only take chunks of energy that are 5kBT in size, and will only be stimulated if five of these random kBT variations occur at the correct time and place. This minimum energy requirement essentially freezes out the high frequency modes. The exponential decrease off in excitation with frequency corresponds to the exponential decrease off in the likelihood of getting the proper number of fluctuations together, similar to the exponential drop off in the likelihood of flipping a coin n times in a row.
Simple Derivation of Planck’s Formula from the Boltzmann’s Distribution
Planck's formula was based on the assumption that the oscillators only exchange energy with the radiation in quanta hf. Standing electromagnetic waves, such as the radiation in an oven, have quantized energy, as Einstein demonstrated.
The likelihood of a system at temperature T containing energy E is proportional to eE/kBT, Boltzmann's formula, as covered in the last lecture. It turns out that this formula holds true in quantum systems as well. Now, at T, a classical simple harmonic oscillator will have a probability distribution proportional to, implying that the energy expectation value is

Just the classical equipartition of energy.
But we now know this isn’t true if the oscillator is quantized: the energies are now in steps hf apart. Taking the ground state as the zero of energy, allowed energies are0,hf, 2hf, 3hf…
And assuming the Boltzmann expression for relative probabilities is still correct, the relative probabilities of these states will be in the ratios:
e−hf/kBT, e−2hf/kBT, e−3hf/kBT…
To find the oscillator energy at this temperature, we use these probabilities weighted by the corresponding energy, and divide by a normalization factor to ensure that the probabilities add up to 1:


(The expression is evaluated as follows: write e−hf/kT=x, so the sum of the relative probabilities is 1+x+x2+x3+…=1/(1−x), and the numerator in the above expression for is hfx(1+2x+3x2+…)=hfx/(1−x)2, since the infinite series in parens is given by differentiating 1+x+x2+x3+… )
This is indeed the correct result from the black body experiments. Evidently Boltzmann’s relative probability function e−E/kBT is still valid in quantum systems.
A Note on Wien’s Displacement Law
Wien's Displacement Law is easily deduced from Planck's formula: the highest radiation per unit frequency range occurs at the frequency f for which the function f3/(ehf/kBT1) is at its maximum. Numerically, hfmax=2.82kBT is obtained.
The equation linking the frequency of maximum energy intensity in units of Joules/m3/Hz may be established theoretically (and is proven experimentally) as fmax=5.881010 T Hz/K.
The law is frequently expressed in terms of the wavelength at which the intensity, now measured in Joules/m3/m, or per unit interval of wavelength, and2.910-3 TmK is the maximum value.
The crucial thing to remember here is that these calculations do not produce the same result, as can be easily confirmed, because fmaxmax1.7108m/sec is not the same as the speed of light! Because the two measurements, per unit interval of frequency and per unit interval of wavelength, are distinct, a claim that, for example, sunlight is most intense in the yellow must explain which one is being utilised (actually it would be wavelength, frequency would give the near infrared).
An Excel spreadsheet was used to create the graphs of black body radiation as a function of temperature. You are invited to download and experiment with this spreadsheet to see how radiation varies with temperature. It's simple to use—all you have to do is enter the temperature and see the graph change.
Key takeaway:
1. We will regard the planets and stars (including the earth and the sun) to be blackbodies, despite the fact that a blackbody does not exist. A blackbody, according to the preceding description, will produce radiation in all portions of the electromagnetic spectrum, but we know from experience that it will not radiate in all wavelengths equally.
2. A blackbody is a physics term for a surface that absorbs all radiant radiation falling on it. The word comes from the fact that incident visible light is absorbed rather than reflected, making the surface appear black.
3. The blackbodies are utilised in applications such as lighting, heating, security, thermal imaging, and testing and measuring. The Planck Law of Radiation can be used to determine the intensity of energy at any temperature and wavelength.
1.3.1 Introduction: What is the photoelectric effect?
The photoelectric effect occurs when light shines on a metal and causes electrons to be expelled from the metal's surface. Photoemission is another name for this process, and photoelectrons are the electrons that are emitted from the metal. Photoelectrons behave and behave like other electrons in terms of behaviour and attributes. The prefix photo- merely indicates that incoming light has expelled electrons from a metal surface.
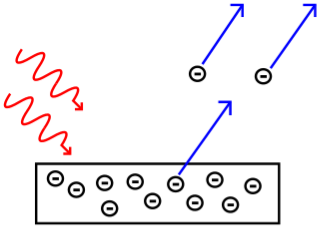
Fig. The photoelectric effect.
1.3.2 Predictions based on light as a wave
To explain the photoelectric effect, 19th-century physicists proposed that the incoming light wave's oscillating electric field heated the electrons, causing them to vibrate and eventually release them from the metal surface. This concept was founded on the idea that light travels across space solely as a wave. (For additional detail on light's fundamental qualities, see this article.) Scientists also believed that the light wave's energy was proportional to its brightness, which is connected to its amplitude. They conducted tests to examine the effect of light amplitude and frequency on the rate of electron ejection as well as the kinetic energy of photoelectrons in order to test their hypotheses.
They made the following predictions based on the classical description of light as a wave:
- The kinetic energy of released photoelectrons should increase as the light frequency increases, and the rate of electron emission, which is proportional to the measured electric current, should increase as well.
- We may compare a light wave to a water wave to better understand why they made these predictions. Consider some beach balls on a dock that stretches out into the sea. The dock is a metal surface, the beach balls are electrons, and the waves in the ocean are light waves.
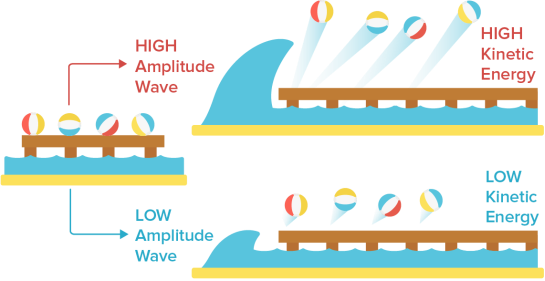
We would assume that if a single massive wave shook the dock, the energy from the enormous wave would send the beach balls flying off the pier with considerably more kinetic energy than a single, little wave. This is also what physicists predicted would happen if the intensity of the light was raised. Higher amplitude light was predicted to result in photoelectrons with more kinetic energy since light amplitude was proportional to light energy.
Classical physicists also predicted that increasing the frequency of light waves (while keeping the amplitude constant) would increase the rate of electron ejection, and therefore the measured electric current. Using our beach ball analogy, we would expect more beach balls to be knocked off the dock when waves of the same size strike the dock more frequently than waves of the same size striking the dock less frequently.
1.3.3 When intuition fails: photons to the rescue!
Experiments on the effect of light amplitude and frequency revealed the following findings: Photoelectrons' kinetic energy increases with light frequency, whereas electric current remains constant as light frequency increases.
The amplitude of light increases the electric current.
As the amplitude of light rises, the kinetic energy of photoelectrons remains constant.
These findings were diametrically opposed to predictions based on the traditional explanation of light as a wave! It turned out that an altogether new model of light was required to describe what was going on. That model was devised by Albert Einstein, who hypothesised that light may act as photons, which are electromagnetic energy particles. Planck's equation can be used to compute the energy of a photon:
Ephoton = hv
Where Ephoton is the photon's energy in joules h is Planck's constant (6.6261034 Js), and v is the light frequency in Hz. The energy of a photon is proportional to the frequency of light, according to Planck's equation. The number of photons with a specific frequency determines the amplitude of the light.
1.3.4 Applications
Photoelectric devices have a number of advantages, including creating a current that is precisely proportional to light intensity and having a very fast response time. The photoelectric cell, often known as a photodiode, is a simple device. This was originally a phototube, a vacuum tube with a metal cathode with a tiny work function that allowed electrons to be easily emitted. An anode held at a large positive voltage compared to the cathode would collect the current produced by the plate. Phototubes have been phased out in favour of semiconductor-based photodiodes, which can detect light, quantify its intensity, operate other devices in response to illumination, and convert light to electrical energy. These devices operate at low voltages, similar to their bandgaps, and are utilised in a variety of applications including industrial process control, pollution monitoring, light detection in fibre optic telecommunications networks, solar cells, imaging, and many more.
Semiconductors with bandgaps that correspond to the photon energy to be sensed make up photoconductive cells. Photographic exposure metres and automatic street lighting switches, for example, function in the visible spectrum and are often constructed of cadmium sulphide. Lead sulphide or mercury cadmium telluride can be used to make infrared detectors, such as night-vision sensors.
A semiconductor p-n junction is commonly used in photovoltaic devices. Solar cells are typically built of crystalline silicon and convert approximately 15% of incident light energy into electricity. Solar cells are frequently utilised in specialised contexts such as space satellites and remote telephone sites to produce very tiny amounts of power. Solar power may become economically viable for large-scale applications when cheaper materials and higher efficiency become available.
The photomultiplier tube is a very sensitive extension of the phototube, which contains a sequence of metal plates called dynodes and was first created in the 1930s. When light strikes the cathode, electrons are released. These are drawn to the first dynode, where they release more electrons, which then strike the second, and so on. The photocurrent is boosted so much after up to ten dynode stages that some photomultipliers can almost detect a single photon. In spectroscopic research, where it is frequently necessary to monitor extremely faint light sources, these devices, or solid-state counterparts of comparable sensitivity, are important. They're also employed in scintillation counters, which have a substance that creates light flashes when X-rays or gamma rays strike it, as well as a photomultiplier that counts and measures the strength of the flashes. These counters are employed for things like recognising certain isotopes for nuclear tracer analysis and detecting X-rays in computerised axial tomography (CAT) scans, which show a cross section of the body.
Photomultipliers and photodiodes are also used in image technologies. The fact that the electron emission from each place on a cathode is dictated by the number of photons arriving at that location is used in light amplifiers or image intensifiers, television camera tubes, and image-storage tubes. On the other side of a semitransparent cathode, an optical image falling on one side is translated into an analogous "electron current" image. The electrons are then focused onto a phosphor screen using electric and magnetic forces. Each electron striking the phosphor causes a flash of light, causing a cascade of electrons to be released from the cathode directly opposite the phosphor. The resulting intensified image can be displayed or stored after going through the same process to get even more amplification.
The examination of electrons emitted by X-rays at higher photon energies provides information about electronic transitions between energy levels in atoms and molecules. Because released electrons carry a specific energy that is distinctive of the atomic source, it also aids to the study of certain nuclear processes and plays a role in the chemical examination of materials. The Compton effect is also used to investigate material properties, and in astronomy, it is utilised to investigate cosmic gamma rays.
1.3.5 Dilemma
Light can be used to push electrons away from a solid's surface if the conditions are appropriate. The photoelectric effect (or photoelectric emission or photoemission) is a phenomena that occurs when electrons are ejected from a substance that is photoemissive. The ejected electrons are termed photoelectrons, though there is nothing that distinguishes them from other electrons. In terms of mass, charge, spin, and magnetic moment, all electrons are similar.
Heinrich Hertz discovered the photoelectric effect in 1887 while conducting tests with a spark gap generator (the earliest device that could be called a radio). Sparks generated between two small metal spheres in a transmitter cause sparks to bounce between two distinct metal spheres in a receiver in these studies. The spark gap generator was infamously difficult to deal with when compared to later radio equipment. For a receiver to reliably recreate the transmitter's spark, the air gap would frequently have to be less than a millimetre. Hertz discovered that exposing his spark gap device with visible or ultraviolet light increased its sensitivity. J.J. Thomson's later research revealed that the heightened sensitivity was due to light pushing on electrons, a particle he discovered in 1897.
While this is intriguing, it isn't really remarkable. All forms of electromagnetic radiation transfer energy, and it's easy to envisage this energy being used to drive tiny negative charge particles loose from the surface of a metal where they weren't all that tightly contained to begin with. However, the modern physics age is characterised by entirely unexpected and incomprehensible discoveries. The photoelectric effect was studied further, and the results contradicted the classical idea of electromagnetic radiation. Light didn't behave the way it was meant to when it came into contact with electrons. In principle, repairing this tear would necessitate more than simply a patch. It necessitated rewriting a significant amount of physics from the ground up.
Philipp Lenard, Hertz's assistant, was the one who carried out the first, definitive research of the photoelectric effect. Lenard used metal surfaces that were first cleaned and then held under vacuum so that the effect could be evaluated without being influenced by impurities or oxidation on the surface. A second metal plate was put at the other end of an evacuated glass tube containing the metal sample. The tube was then positioned or limited in some way so that only the first metal plate — the one constructed of the photoemissive substance under examination — received light. A photocell or an electric eye is the formal name for such a tube (informally). As illustrated in the schematic design below, Lenard linked his photocell to a circuit that included a variable power source, voltmeter, and microampmeter. He then used light of various frequencies and intensities to illuminate the photoemissive surface.
The photoemissive plate would get a little positive charge if electrons were knocked free. Because the wiring of the circuit connected the second plate to the first, it became positive as well, attracting the photoelectrons floating freely through the vacuum, where they would land and return to the plate from where they originated. Keep in mind that this experiment does not use light to make electrons; rather, it uses light's energy to push electrons that are already there around the circuit. Although the photoelectric current created by this method was modest, it could be measured using a microammeter (a sensitive galvanometer with a maximum deflection of only a few microamps). It also serves as a gauge for the pace at which photoelectrons leave the photoemissive material's surface.
Take note of how the power supply is linked to the circuit, with the negative end attached to the non-illuminated plate. The photoelectrons are then pushed back into the photoemissive surface by a potential difference. When the power supply is set to a low voltage, the least energetic electrons are trapped, resulting in a reduction in current through the microammeter. As the voltage is increased, more and more energetic electrons are driven back, until none can leave the metal surface and the microammeter reads zero. The stopping potential is the point at which this happens. It's a measurement of the electrons' maximum kinetic energy emitted as a result of the photoelectric effect.
The maximum kinetic energy of the photoelectrons was discovered to be unaffected by the intensity of the incident light, according to Lenard. Those who were ejected from a very bright light had the same amount of energy as those who were ejected from a very dim light of the same frequency. However, in accordance with the rule of conservation of energy, a bright source ejected more electrons than a dark source.
Others' tests, most notably that of American physicist Robert Millikan in 1914, discovered that light with frequencies below a particular cutoff value, known as the threshold frequency, would not release photoelectrons from a metal surface, regardless of how intense the source was. These results came as a complete shock. Given that light can transport electrons and that the energy in a beam of light is proportional to its intensity, classical physics would predict that a more intense beam of light, regardless of frequency, will release electrons with greater energy than a less intense beam. However, this was not the case.
Photoelectrons are not ejected by red light (even if it is very bright).
Photoelectrons are ejected by green light (even if it is very dim).
Photoelectrons ejected by blue light have greater energy than photoelectrons ejected by green light (even if it is very dim).
Actually, these outcomes may not be entirely normal. Most elements have ultraviolet threshold frequencies, and only a few, like the example above, dip low enough to be green or yellow. Semiconductors are the materials having the lowest threshold frequencies. The infrared part of the spectrum has threshold frequencies for some.
Light is described as a transverse electromagnetic wave in the classical model. There was little doubt about this by the end of the nineteenth century. When it was effectively employed to explain optical phenomena including diffraction, interference, polarisation, reflection, and refraction, the wave character of light was verified. If we can successfully visualise light as waves in an electromagnetic ocean, then we shouldn't have too much trouble visualising electrons in a metal surface as tethered buoys floating in an electromagnetic harbour. The waves (light) arrive, pulling and tugging at the buoys (electrons). Strong waves can rip a buoy from its mooring and send it adrift. Instead of the energy-frequency relationship indicated above, a wave model of light would predict an energy-amplitude relationship. Photoelectric experiments depict an electromagnetic ocean in which massive swells would not topple a canoe over, but tiny ripples would launch you into the air.
Not only that, but the photoelectrons appear to jump out of the surface far too soon. The rate at which energy is transferred to the surface is sluggish when light intensity are very low. It should take a long time for any one electron to collect enough of this dispersed energy to become free. It ought to work, but it doesn't. When light of the right frequency and intensity contacts a photoemissive surface, at least one electron always pops out (t 109 s). Using the ocean as an example, imagine a harbour filled of little boats (electrons). Except for a few small waves on the surface, the sea seems tranquil (low intensity, short wavelength light). The majority of the boats in the harbour are untouched by the waves, but one is ripped off the dock and launched into the sky like a jet. Something isn't quite right in this place. Light, unlike mechanical waves, behaves in this manner.
1.3.6 New idea
The frequency of incident radiation and the material on the surface are the two factors that influence the maximum kinetic energy of photoelectrons. Above the threshold, electron energy grows in a straightforward linear fashion, as seen in the graph below. The energy-frequency relationship is constant for all materials because all three curves have the same slope (Planck's constant). Photoemission does not occur below the threshold frequency. The energy axis has a distinct intercept for each curve, indicating that threshold frequency is a function of the material.
Albert Einstein, the world's most famous physicist, was the genius who worked out what was going on here. In 1905, Einstein observed that light behaved as if it were made up of small particles called quanta, which were later renamed photons, and that each particle's energy was proportional to the frequency of the electromagnetic radiation it was a part of. Remember from the last section of this book that Max Planck developed the concept of quantized electromagnetic radiation to solve a technical difficulty involving idealised electromagnetic radiation sources known as blackbodies. Remember that, contrary to his mathematical analysis, Planck did not believe that radiation was truly divided up into small bits. He assumed the whole event was a set-up to provide him with the correct answers. Einstein's brilliance lay in his recognition that Planck's concoction was, in fact, a plausible description of reality. We perceive electromagnetic radiation as a continuous wave, but it is actually a stream of distinct particles.
1.3.7 Equations
Einstein and Millikan described the photoelectric effect using a formula (in contemporary notation) that relates the maximum kinetic energy (Kmax) of the photoelectrons to the frequency of the absorbed photons (f) and the threshold frequency (f0) of the photoemissive surface.
Kmax = h(f − f0)
Or if you prefer, to the energy of the absorbed photons (E) and the work function (φ) of the surface
Kmax = E − φ
Where the first term is the energy of the absorbed photons (E) with frequency (f) or wavelength (λ)
E = hf = | Hc |
λ |
And the second term is the work function (φ) of the surface with threshold frequency (f0) or threshold wavelength (λ0)
φ = hf0 = | Hc |
λ0 |
The maximum kinetic energy (Kmax) of the photoelectrons (with charge e) can be determined from the stopping potential (V0).
V0 = | W | = | Kmax |
q | e |
Thus
Kmax = eV0
When charge (e) is given in coulombs, the energy will be calculated in joules. When charge (e) is given in elementary charges, the energy will be calculated in electron volts. This results in a lot of constants. Use the one that's most appropriate for your problem.
| SI units | Acceptable |
h | 6.63 × 10⁻³⁴ J s | 4.14 × 10⁻¹⁵ eV s |
Hc | 1.99 × 10⁻²⁵ J m | 1240 eV nm |
● Planck's constant with variations | ||
Lastly, the rate (n/t) at which photoelectrons (with charge e) are emitted from a photoemissive surface can be determined from the photoelectric current (I).
I = q/t |
| = ne/t |
|
|
|
Thus…
| n/t = I/e |
|
|
|
1.3.8 Technology
- "Electric eye," "light metre," and "movie film audio track" are some of the terms used.
- A nonmetallic solid's electrical conductivity increases when it is subjected to electromagnetic radiation, which is known as photoconductivity. The addition of free electrons liberated by collisions with photons results in an increase in conductivity. The quantity of the rise is determined by the pace at which free electrons are generated and the time they remain free.
- Photovoltaics: instead of going through a vacuum to an anode, the expelled electron goes through the emitting material to reach a solid electrode in contact with the photoemitter, resulting in direct conversion of radiant energy to electric energy photostatic duplication
Key Takeaway:
1. When a specific "threshold frequency" of light is incident on a metal surface. Iii — "When photoelectric materials absorb light with a high enough frequency, they produce electrons."
2. According to Einstein's renowned photoelectric effect explanation, the photon's energy is the sum of the energy required to remove the electron and the kinetic energy of the expelled electron. As a result, h nu= W + E.
3. This is how the photoelectric effect works. When a metal is exposed to high-energy light, electrons are emitted from the metal. No electrons are emitted by light below a specific threshold frequency, no matter how bright it is. Interactions with photons allow electrons to gain energy.
1.4.1 What is Compton Effect?
The Compton effect is the phenomenon that occurs when x-rays or gamma rays are scattered on a substance with increasing wavelength. In the year 1922, Arthur Compton investigated this phenomenon. Compton discovered that wavelength is unaffected by incident radiation intensity during his research. It is determined by the scattering angle as well as the wavelength of the incident beam. It is expressed mathematically as follows:
What is the location?
The angle at which light is scattered
m0: an electron's rest mass
h/m0c : The electron's Compton wavelength
The peaks of the radiation spectrum are denoted by the letters s and 0.
1.4.2 Derivation of Compton effect equation
Considering the elastic collide between a photon and an electron, following is the derivation:
hν0 : energy of photon
Pi=hν0/c :momentum of the photon
Pi=pfcosΘ+pecosϕ(1) (conservation of momentum in x direction)
0=−pfsinΘ+pesinϕ(2) (conservation of momentum in y direction)


Therefore, above is the Compton effect equation andhm0c≡λc is Compton wavelength of an electron.
1.4.3 Difference Between Compton Effect and Photoelectric Effect
Compton effect | Photoelectric effect |
This is the result of high-energy photons being bound to free electrons dispersing inelastically. | When electromagnetic radiation interacts with electrons, weakly bound electrons are expelled from the surface of the material, causing this effect. |
The effect was explained by Arthur Compton. | The effect was explained by Albert Einstein. |
The free electrons have a mid-energy level of energy. | The electrons have a low-energy associated with them. |
The dispersed photon has a longer wavelength than the incident photon. | The photon vanishes after interacting with the electrons, therefore the wavelength isn't visible. |
1.5.1 Important Topics Covering Dual Nature of Matter
Here are some of the most crucial points to remember while working with this concept.
Electronic Emission
The free electrons can be supplied with the lowest energy required to emit an electron from a metal's surface using one of the techniques listed below:
- Thermionic Emission: The required thermal energy is delivered to the free electrons by appropriately heating the metal to allow them to exit.
- Field Emission: Electrons are held under a strong electric field in order to emit electrons from the metal.
- Photo-electric Emission: Electrons are emitted from a metal surface when it is illuminated by light of the suitable frequency. Photoelectrons are electrons that are created by light.
Photoelectric Effect
The photoelectric effect is a phenomena in which electrons escape from a material's surface. The material's surface is usually made up of both positive and negative ions. When light is incident on a metal surface, some of the electrons near the surface absorb enough energy from the incident radiation to overcome the pull of the positive ions. Furthermore, after the electrons have accumulated enough energy, they will escape from the metal surface and into the surrounding vacuum. The Photoelectric Effect is founded on this.
The following are some terms that are related:
- The minimal energy necessary to expel an electron from a metal surface is known as the work function.
- The minimal frequency of light that can compel an electron to emit from a metal surface is called the threshold frequency.
- Threshold Wavelength: The longest wavelength of light capable of ejecting a photoelectron from a metal's surface.
- If, Work Function is denoted by Ɵ, Threshold Frequency by f, and Threshold Wavelength by ƛ; then we have Ɵ = hf =hc/ ƛ; where h is Planck’s Constant. E = hf
Concepts to understand:
Cut-off or Stopping Potential is the minimal negative or retarding potential V0 applied to a plate for which photoelectric current becomes zero.
For a fixed incidence frequency, the effect of incident light intensity is linear with photoelectric current, as shown in Figure.
The effect of potential on photoelectric current is that it rises with increasing potential supplied to the collector for a fixed frequency and intensity of incident light, eventually reaching its maximum current, which is known as Saturation Current.
1.5.2 Wave-Particle Duality
Early in the argument over whether light is made up of particles or waves, it was discovered that electrons have a wave-particle dual nature as well. When the photoelectric effect offered firm evidence of a particle nature, the evidence for the depiction of light as waves was well established at the turn of the century. The particle properties of electrons, on the other hand, were clearly documented when the DeBroglie hypothesis and subsequent investigations by Davisson and Germer revealed the electron's wave nature.
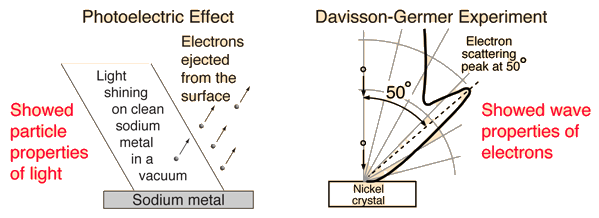
1.5.3 The Photoelectric Effect
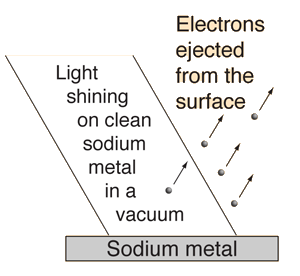
The details of the photoelectric effect were in direct contradiction to the expectations of very well developed classical physics.
The explanation marked one of the major steps toward quantum theory.The remarkable aspects of the photoelectric effect when it was first observed were:
1. The electrons were emitted immediately - no time lag!
2. Increasing the intensity of the light increased the number of photoelectrons, but not their maximum kinetic energy!
3. Red light will not cause the ejection of electrons, no matter what the intensity!
4. A weak violet light will eject only a few electrons, but their maximum kinetic energies are greater than those for intense light of longer wavelengths!
1.5.4 Wave-Particle Duality: Light
Does light consist of particles or waves? When one focuses upon the different types of phenomena observed with light, a strong case can be built for a wave picture:

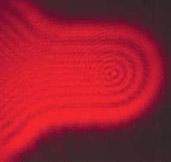
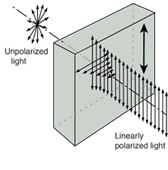
Fig. Interference Diffraction Polarization
Phenomenon | Can be explained in | Can be explained in |
Reflection |  |  |
Refraction |  |  |
Interference |  |  |
Diffraction |  |  |
Polarization |  |  |
Photoelectric effect |  |  |
Waves can explain the majority of regularly observed light phenomena. However, the photoelectric effect suggested that light has a particle nature. Then electrons were discovered to have multiple natures as well.
There is a lot of debate in the literature concerning whether light reflection and refraction can be represented in particle terms at an interface when the medium changes. Treating light as a wave phenomenon is sufficient for practical geometrical optics applications.
Newton's corpuscular theory: Light, according to Newton, is made up of corpuscles that travel in straight lines. Because the bouncing of particles or waves off a planar surface follows the same law of reflection, this worked great for reflection. However, he had to assume that the particles travelled quicker in a more optically dense substance to explain refraction. However, Foucault's 1850 experiment revealed that light travels more slowly through such material, requiring that version of the particle theory of light to be abandoned.
Huygens wave theory: Presuming that light was composed of waves, in 1678 Huygens proposed that each point of a light wavefront could be considered to be the source of a spherical wave. Huygens' idea aided in the development of light wave theory, which was further expanded by Fresnel and Kirchhoff.
Quantum view of light: On the quantum scale of atoms, the photoelectric effect provided proof that light has particle qualities. At the very least, light can localise enough energy to dislodge an electron off a metal surface. So, though a particle treatment of refraction of light may be indicated, the wave view of light is the practical approach in common optics.
1.5.5 Heisenberg’s Uncertainty Principle
According to Heisenberg's Uncertainty Principle, a particle's momentum and position cannot be determined at the same time.
It can be stated mathematically as x P (h / 4) where x represents position uncertainty and P represents momentum uncertainty.
1.5.6 Planck’s Quantum Theory
When heat is applied to a black body, distinct wavelengths or frequencies of thermal radiation are emitted. As a result, Max Planck proposed Planck's Quantum Theory to explain these radiations. The following are some of the theory's primary points:
- Energy is absorbed or radiated in a discontinuous manner by substances. This procedure is carried out in little packets.
- The above-mentioned process occurs in whole-number quantum multiples such as hf, 2hf, 3hf......nhfs, where n is a positive integer.
- Quantum energy is the tiniest packet of energy. In the case of light, it is referred to as a photon.
- The energy of a Quantum is related to the frequency of its radiation.
1.5.7 Electron Under An Electric Field
Consider an electron of mass m, with a charge q being accelerated through a potential V from rest. The kinetic energy K of the electron equals the work done on it by the electric field which equals to qV.
K = qV = ½ mv2 = P2/2m
P = √ 2mK = √ 2mqV
The de Broglie wavelength ƛ of the electron is given by;
ƛ = h / P = h / √2mK = h / √2mqV
Substituting the numerical values of h, m and e; we have ƛ=1.227/ nm; where V is the magnitude of accelerating potential in Volts.
1.5.8 Davisson And Germer Experiment
The Davisson and Germer Experiment established the wave nature of electrons and confirmed the de Broglie equation for the first time. The findings proved quantum mechanics for the first time in an experiment.
The Davisson and Germer Experiment is contained within a vacuum chamber. As a result, electron deflections and scattering by the medium are avoided. The following are the main components:
Electron Gun: Electrons are emitted from a Tungsten filament via thermionic emission.
Electrostatic Particle Accelerator: The electrons are accelerated at a known potential using two oppositely charged plates.
Collimator: The accelerator is encased in a cylinder with a narrow beam for the electrons running parallel to its axis.
The electron beam is fired over a Nickel crystal as the target.
The scattered electrons from the Ni Crystal are captured by the detector.
1.6.1 Definition:
An electron's spectrum of electromagnetic radiation released or absorbed as it moves between different energy levels within an atom.
When an electron moves from one energy level to the next, it emits or absorbs light of a given wavelength. The atomic spectra of atoms is the collection of all these unique wavelengths of the atom in a certain set of variables such as pressure, temperature, and so on. Emission spectra, absorption spectra, and continuous spectra are the three forms of atomic spectra.
1.6.2 Spectral Series of Hydrogen Atom
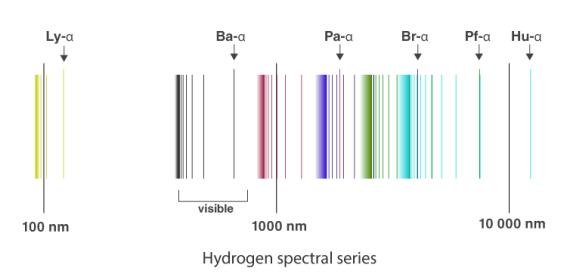
The atomic hydrogen emission spectrum is divided into a number of spectral lines with wavelengths determined by the Rydberg formula, as seen in the image above. The atomic transitions between different energy levels cause the observed spectral lines in the hydrogen emission spectrum. In astronomical spectroscopy, spectral series are crucial.
1.6.3 Continuous Spectrum
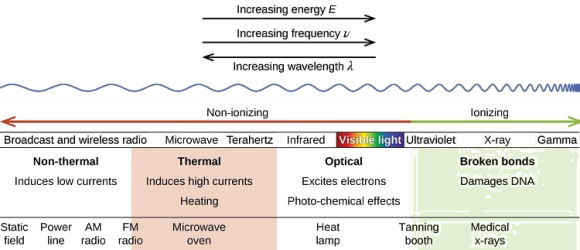
A continuous spectrum is exemplified by a rainbow. The colours used here are from the visible spectrum (between 380-760 nm). This wavelength range can be seen with the naked eye. Light of diverse wavelengths (see the electromagnetic spectrum below) is not visible, unlike light with the same wavelength. Take note of the varied zones of light in Figure 4.2.1. (or electromagnetic spectrum). On the left side of the spectrum are areas of light with short wavelengths. All wavelengths between UV (ultraviolet) and gamma (gamma) have the ability to ionise tissues and/or DNA. As a result, people who have been exposed to high doses of these forms of radiation over a short period of time may acquire cancer. Visible light (see the rainbow area in Figure 4.2.1) and radiation on the right side of the spectrum, on the other hand, has longer wavelengths and cannot ionise tissues or DNA. Nonionizing radiation includes visible, infrared (designated IR), microwave, and radio waves, which have not been related to cancer. It contains various frequencies (cycle/time) and wavelengths.
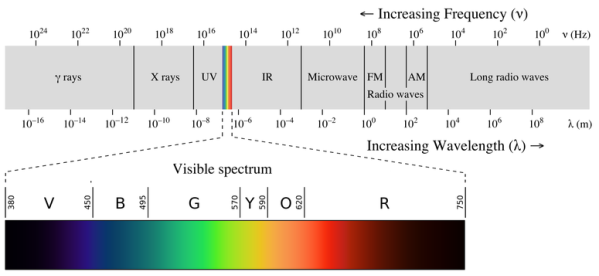
Please be mindful of the difference between ionising and nonionizing light. Do not memorise the electromagnetic spectrum's wavelengths or frequencies. The electromagnetic spectrum is an example of a continuous spectrum, which you should be aware of.
1.6.4 Atomic Emission Spectra
An atom's electrons tend to be grouped in such a way that the atom's energy is as low as possible. The lowest energy state of an atom is called the ground state. When energy is delivered to those atoms, the electrons absorb it and travel to a higher energy level. These electron energy levels in atoms are quantized, which means the electron must go from one energy level to the next in discrete stages rather than constantly. An atom's excited state is one in which its potential energy is higher than its ground state. The excited state of an atom is unstable. When it returns to the ground state, it releases the energy it had gained in the form of electromagnetic radiation that it had previously gained (although it can be released via heat).
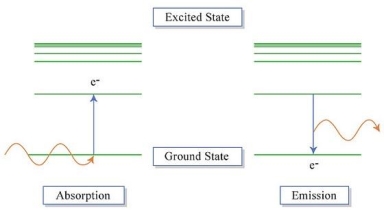
Atoms can obtain energy from a variety of sources to effect these changes. Electrical current has been used to stimulate the gases in the image below. Each noble gas's atoms produce various colours that can be used to identify the elements. Each of these species has a different number of electrons that can be excited in different ways. Each gas, in turn, produces a distinct colour.

Flames can also be used to excite atoms. Metal chlorides are directly thrown into a flame during a flame test experiment. The metal's electrons will be promoted to an excited state by the tremendous heat. This excess energy is released in the form of visible light when it is emitted. The flame colour can be utilised to identify a metal atom if a reference panel is available (Table).
Table: Flame colors corresponding to elements | ||||
Metal Ion | Flame Color |
| Metal Ion | Flame Color |
Li | Red |
| K | Light Purple |
Na | Orange |
| Ba | Light Green |
Ca | Orange-Red |
| Cu | Blue |
Sr | Red |
|
|
|
Experiments with flames are akin to fireworks. For these devices, fireworks producers choose specific metal atoms to produce desired colours. Individual detonators will detonate the metal compounds, releasing a rainbow of colours. On December 31, 2017, the world's largest aerial firework shell exploded over the United Arab Emirates, as seen in the video below. Compare the colours you see in the video to the chart above to figure out which atoms were used in the display.
1.6.5 Discontinous Spectra
Individual patterns of lines will appear if the light generated by the excited atoms is examined through a prism. These lines are known as spectra, and they correspond to a certain element's fingerprint wavelengths (the symbol for wavelength is λ). The light from excited electrons can be diffracted to generate line spectra for the elements hydrogen, helium, and iron, as shown in Figure. The specific elements create visible wavelengths (between 400 and 700 nm) that can be seen with the naked eye. One would need to use some sort of detector to get the numerical wavelengths (in nanometers).
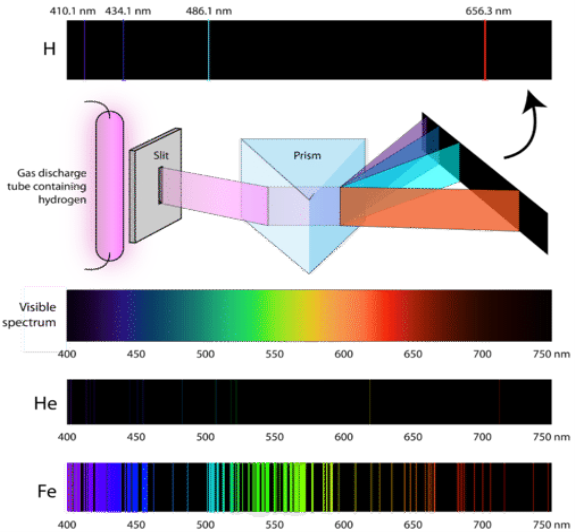
Figure: Light from a hydrogen gas discharge tube is split into four visible lines when it passes through a prism. Each spectral line represents an electron transition from a higher to a lower energy state. As the examples of helium (He)(He) and iron (Fe) indicate, each element has its own atomic emission spectrum (Fe).
1.6.6 Atomic Absorption Spectra
Chemists will utilise atomic absorption to identify and quantify in addition to emission investigations. Chemists can create another form of discontinuous spectrum by noting the energy shifts from ground to excited states (see image below). A fingerprint wavelength pattern is created once more, which can be used to identify an atom. Academia and Industry could employ either an AA (atomic absorption) or AE (atomic emission) spectrometer to analyze the atoms within a sample.
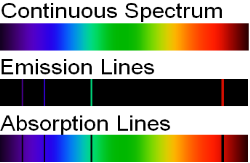
Figure: Spectral lines.
1.6.7 A Featureless Spectrum: Blackbody Radiation
Any item with a temperature higher than absolute zero will radiate energy as light. If you had a perfectly black box with a given temperature and monitored the intensity of light at various photon energies, you'd get a Blackbody Spectrum. This is significant because astronomical objects like as stars can often be treated as near-perfect blackbody emitters. As a result, we can model the continuum emission on which the absorption spectra are observed. This means that, in addition to observing a distant star's chemical composition, we can also measure its temperature near its surface.
The Blackbody Spectrum Simulator was created by the teaching department of the University of Colorado. Click the download button, and then open the downloaded file in your browser to see the applet, as seen below.
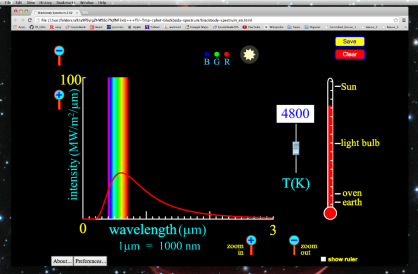
Let's talk about what we're seeing in the plot. The x-axis shows the wavelength of light emitted, while the y-axis shows the intensity, or strength, of blackbody radiation emission at a specific wavelength. Take note of the units! Almost always, blackbody radiation is expressed as energy per unit surface area of the item. On the x-axis, at the actual wavelengths of visible light, there is a rainbow.
You can adjust the temperature using the slide-bar to the left of the right-hand thermometer, or type a temperature (in Kelvin) into the white box above the slide-bar.
We can now click the "display ruler" option in the simulator's bottom-right corner. This displays a ruler, as shown below, that allows us to measure the height of the intensity at a specific wavelength of light. The scale of the ruler does not change when you use the zoom in or zoom out buttons. As a result, you won't be able to zoom in or out when examining the relative strength of a specific wavelength of light being radiated.
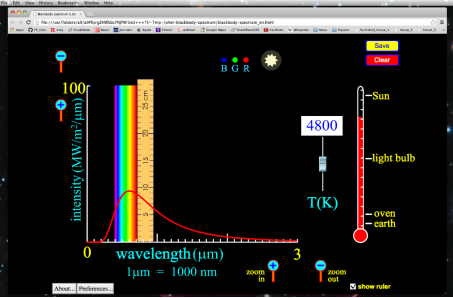
Key Takeaway:
There is an intimate connection between the atomic structure of an atom and its spectral characteristics.
1.7.1 What is Hydrogen spectrum?
The hydrogen spectrum is a crucial piece of evidence for demonstrating an atom's quantized electronic structure. When an electric discharge is conducted across a gaseous hydrogen molecule, the hydrogen atoms in the molecule dissociate. The energetically excited hydrogen atoms emit electromagnetic radiation as a result of this process. The hydrogen emission spectrum is made up of discrete frequency radiation. These radiation series bear the names of the scientists who discovered them.
The spectral lines of the hydrogen atomic emission spectrum are explained by Bohr's hypothesis. The energy of an atom's electron remains unaltered while it is in the ground state. The electron jumps from the ground state orbit to a more distant excited state orbit when the atom absorbs one or more quanta of energy. The variable n is used to identify energy levels. n = 1 is the ground state, n = 2 is the first excited state, and so on. The difference in energy between the two energy levels is equal to the energy obtained by the atom. When the atom relaxes back to a lower energy state, energy equal to the difference in energy between the two orbits is released (see Figure 1).
According to the equation E = hv, the change in energy, E, causes light of a specific frequency to be emitted. Remember that the atomic emission spectrum of hydrogen has four different frequency spectral lines? The finding that electron orbits are not evenly spaced is explained in the Bohr model. The spacing between the levels gets narrower and smaller as the energy travels further away from the nucleus.
Bohr was able to calculate the energies that the hydrogen electron would have in each of its permissible energy levels using the wavelengths of the spectral lines. The energy level transitions that corresponded to the spectral lines in the atomic emission spectrum were then mathematically demonstrated (Figure).
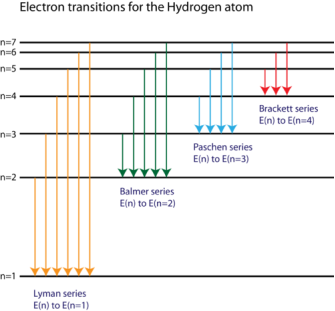
Figure. The electron energy level diagram for the hydrogen atom.
He discovered that the four visible spectral lines correlated to transitions from higher to lower energy levels (n = 2). The Balmer series is what it's named. The Lyman series refers to transitions that finish in the ground state (n = 1), but the energy released are so high that the spectral lines are all in the ultraviolet part of the spectrum. Because the energies are too small, the transitions known as the Paschen series and the Brackett series both produce spectral lines in the infrared region.
Bohr's concept was a huge achievement in understanding the hydrogen atom's spectrum. Unfortunately, when the model's mathematics were applied to atoms containing more than one electron, the frequencies of the spectral lines were incorrectly predicted. While Bohr's model was a significant step forward in atomic theory, and the concept of electron transitions between energy levels is still relevant, further work was required to completely comprehend all atoms and their chemical activity.
1.7.2 Emission Spectrum of Hydrogen:
A glass tube containing hydrogen gas at low pressure emits blue light when an electric current is sent through it. Four narrow bands of bright light against a black backdrop can be seen when this light is transmitted through a prism (as illustrated in the figure below).
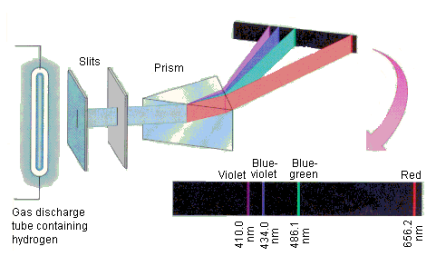
These narrow bands have the characteristic wavelengths and colors shown in the table below.
Wavelength |
|
| Color |
|
|
656.2 |
|
| Red |
|
|
486.1 |
|
| Blue-green |
|
|
434.0 |
|
| Blue-violet |
|
|
410.1 |
|
| Violet |
|
|
By examining the infrared spectrum at longer wavelengths and the ultraviolet spectrum at shorter wavelengths, four new series of lines in the hydrogen emission spectrum were uncovered. Each of these lines matches the same general equation, with numbers n1 and n2 and RH of 1.09678 x 10⁻² nm-1.

1.7.3 Explanation of the Emission Spectrum:
A theoretical explanation of the spectrum of radiation released by a glowing object was offered by Max Planck. He proposed that the walls of a glowing solid may be visualised as a set of resonators oscillating at various frequencies. These resonators absorb energy from the object's walls in the form of heat and release it in the form of electromagnetic radiation. At any given time, the energy of these resonators is proportional to the frequency with which they vibrate.
Planck had to postulate that the energy of these oscillators could only take on a restricted number of values in order to suit the observed spectrum. To put it another way, the energy spectrum for these oscillators was no longer continuous. These oscillators are theoretically "countable" since the number of possible energy levels is restricted. As a result, the energy of the oscillators in this system is quantized. To explain how light was emitted, Planck created the concept of quantization.
Planck's work was extended by Albert Einstein to include the light that had been emitted. Einstein proposed that light acted like a stream of little bundles, or packets, of energy, at a time when everyone accepted that light was a wave (and thus continuous). To put it another way, light was quantized as well. Einstein's model was predicated on two premises. To begin, he assumed that light was made up of photons, which are small, distinct energy bundles. He also assumed that a photon's energy is related to its frequency.
E = hv
In this equation, h is a constant known as Planck's constant, which is equal to 6.626 x 10⁻³⁴ J-s.
Calculate the energy of a single photon of red light with a wavelength of 700.0 nm and a mole of these photons as an example.
The frequency of red light with a wavelength of 700.0 nm is 4.283 x 10¹⁴ s-1. When this frequency is substituted into the Planck-Einstein equation, the following conclusion is obtained.
E = ( 6.626 × 10⁻³⁴ J-s)( 4.283 × 10¹⁴s-1) = 2.838 × 10⁻¹⁹ J
A single photon of red light carries an insignificant amount of energy. But a mole of these photons carries about 171,000 joules of energy, or 171 kJ/mol.

A mole of red light absorbed would thus give enough energy to raise the temperature of a litre of water by more than 40 degrees Celsius.
Because hydrogen atoms can only produce or absorb radiation at a restricted number of frequencies, they can only absorb radiation with a restricted range of energies. This indicates that the hydrogen atom contains a finite number of energy levels. These energy levels can be measured. The hydrogen atom's energy levels are quantized.
1.8.1 Principle:
It is feasible to detect pairs of spectral lines that have the property that the total of their wavenumbers is also an observable spectral line, according to the Rydberg-Ritz combination principle (Rydberg 1890, Ritz 1908)
When we understand that spectra are caused by transitions between energy levels, this idea becomes evident. An atom can either decay immediately from state 2 to ground state 0 or in two phases (21) and (10). Because E=hf, energy is conserved, the two frequencies (wave numbers) of the second route add to the frequency of the first.
In 1913, Niels Bohr showed this for the hydrogen atom,
E=13.6 eV/n2
We have
fnm = 13.6(1/n2 − 1/m2)
Similarly,
fml = 13.6(1/m2 − 1/l2)
Hence
fnm+fml = 13.6(1/n2 − 1/m2) +13.6(1/m2 − 1/l2) = 13.6(1/n2 − 1/l2) =fnl
1.8.2 Formula:
The Rydberg formula is a mathematical formula that may be used to calculate the wavelength of light emitted by an electron travelling between an atom's energy levels. The energy of an electron changes when it moves from one atomic orbital to another. A photon of light is produced when an electron moves from a high-energy orbital to a lower-energy orbital. When an electron transitions from a low-energy to a higher-energy state, a photon of light is absorbed by the atom. The Rydberg Formula is used to describe the spectra of various elements and is written as

Where,
n1 and n2 are integers and n2 is always greater than n1.
R is constant, called Rydberg constant and formula is usually written as

The modern value of Rydberg constant is known as 109677.57 cm-1 and it is the most accurate physical constant.

Key takeaway:
1. The Ritz wavelengths are the wavelengths generated from the transitions' lower and upper levels. They are only available if both transition levels are known. They are usually more precise than observed wavelengths if they are available, especially in the vacuum ultraviolet spectral area.
2. The Rydberg constant is not a universal constant. Its value is determined by the atomic number.
1.9.1 The Gold Foil Experiment
Rutherford, together with associates Hans Geiger and Ernest Marsden, began a series of revolutionary experiments in 1911 that would totally alter the accepted conception of the atom. They used fast moving alpha particles to assault very thin sheets of gold foil. Alpha particles are positively charged particles having a mass four times that of a hydrogen atom. They are a form of natural radioactive particle.
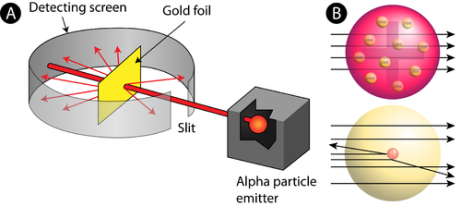
Figure: (A) The Rutherford gold foil experiment's experimental setup: A radioactive element that released alpha particles was aimed toward a thin sheet of gold foil surrounded by a screen that allowed the deflected particles to be detected. (B) All of the alpha particles should have passed through the gold foil with little or no deflection, according to the plum pudding model (top). Rutherford discovered that a small percentage of alpha particles were deflected at huge angles, which might be explained by an atom with a dense, positively charged nucleus at its centre (bottom).
The scientists expected all of the alpha particles to pass through the gold foil with only a tiny deflection or none at all, based on the recognised atomic model, in which an atom's mass and charge are uniformly distributed throughout the atom. Surprisingly, while the vast majority of alpha particles were undeflected, a small number (about 1 in 8000 particles) bounced off the gold foil at extreme angles. Some of the traffic was even rerouted back to the source. They had no prior awareness of what they were about to find. It was "as though you shot a 15-inch [artillery] shell at a piece of tissue paper and it came back and hit you," Rutherford cried in a famous quotation.
To explain his findings, Rutherford needed to create an altogether new model of the atom. He reasoned that most of the atom was empty space because the great majority of the alpha particles had passed through the gold. The particles that were highly deflected, on the other hand, must have been subjected to an enormously intense force within the atom. He came to the conclusion that the majority of the atom's mass and positive charge must be concentrated in a very small place within the atom's interior, which he named the nucleus. Protons and neutrons make up the nucleus, which is the atom's tiny, dense centre core.
The nuclear model was named after Rutherford's atomic model. Protons and neutrons, which make up virtually all of the mass of the nuclear atom, are found in the nucleus, which lies at the centre of the atom. The electrons are dispersed around the nucleus and take up the majority of the atom's volume. It's important to note how small the nucleus is in comparison to the remainder of the atom. The nucleus of an atom would be around the size of a marble if it were blown up to the size of a huge professional football stadium.
Rutherford's model was a crucial step toward a complete understanding of the atom. It did not, however, fully explain the nature of electrons and how they filled the huge area surrounding the nucleus. It took several years for a complete understanding of the electron to emerge. This proved to be the key to comprehending elemental chemical characteristics.
1.9.2 Rutherford's Scattering Experiment
Rutherford's model of an atom:
Ernest Rutherford was fascinated by the arrangement of electrons within an atom. For this, Rutherford devised an experiment. Fast moving alpha ()-particles were created to fall on a thin gold foil in this experiment.
- He used gold foil because he wanted the layer to be as thin as possible. The thickness of this gold foil was around 1000 atoms.
- Particles are helium ions with two charges. The fast-moving -particles have a lot of energy since they have a mass of four.
- The sub-atomic particles in gold atoms were expected to deflect -particles. He didn't anticipate to detect substantial deflections because the -particles were much heavier than the protons. The -particle scattering experiment, on the other hand, yielded completely unexpected findings.
Observations of Rutherford's scattering experiment:
As we can see in Fig.
- Most of the fast moving α-particles passed straight through the gold foil.
- Some of the α-particles were deflected by the foil by small angles.
- Surprisingly one out of every 12,000 alpha particles appeared to rebound.
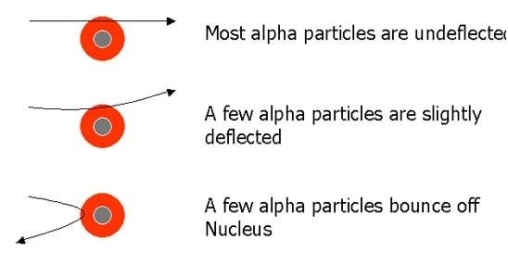
Conclusion of Rutherford's scattering experiment:
1. Because most -particles travelled through the gold foil without being deflected, most of the space inside the atom is unoccupied.
2. Only a few particles were deflected from their intended route, implying that the atom's positive charge takes up relatively little space.
3. Only a small percentage of -particles were deflected by significant angles, implying that the gold atom's positive charge and mass were concentrated in a limited volume within the atom.
He also computed that the radius of the nucleus is around 105 times smaller than the radius of the atom based on the data.
1.9.3 Rutherford's Nuclear Model Of Atom
On the basis of his experiment, Rutherford put forward the model of an atom, which had the following features:
1. Each atom has a nucleus, which is a positively charged centre. The nucleus contains nearly all of an atom's mass.
2. Electrons move in well-defined orbits around the nucleus.
3. In comparison to the size of the atom, the nucleus is quite small.
The presence of a nucleus in the atom is demonstrated by Rutherford's alpha particle scattering experiment.
It also gives the following important information about the nucleus of an atom:
1. An atom's nucleus is positively charged.
2. An atom's nucleus is extremely dense and rigid.
3. The nucleus of an atom is quite small in comparison to the overall size of the atom.
The Rutherford atom model is also known as the Nuclear atom model.
1.10.1 Rutherford model
The Rutherford model, also known as the Rutherford atomic model, nuclear atom, or planetary model of the atom, is a description of atom structure developed by Ernest Rutherford, a New Zealand-born scientist, in 1911. The model depicted the atom as a small, compact, positively charged centre called a nucleus, in which nearly all of the mass is concentrated, and around which the light, negative constituents known as electrons circle at a distance, similar to planets rotating around the Sun.
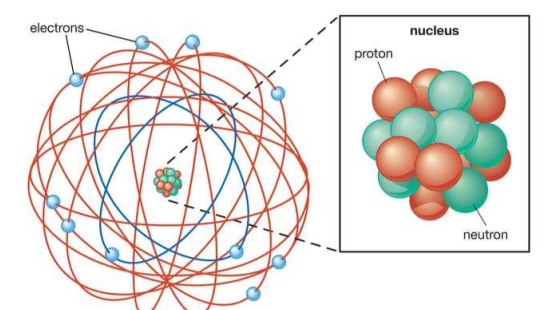
1.10.2 Rutherford atomic model
The atom, according to physicist Ernest Rutherford, is a miniature solar system with electrons orbiting a heavy nucleus and essentially empty space, with the nucleus occupying only a small proportion of the atom. When Rutherford suggested his concept, which featured a nucleus made entirely of protons, the neutron had not yet been identified.
To account for the scattering of alpha particles from thin gold foil reported in a series of experiments conducted by undergraduate Ernest Marsden under the direction of Rutherford and German scientist Hans Geiger in 1909, the nucleus was proposed as small and dense. Within a protective lead shield, a radioactive source generating alpha particles (positively charged particles equivalent to the helium atom nucleus and 7,000 times more heavy than electrons) was contained. After passing through a slit in a lead screen, the radiation was focussed into a narrow beam. To detect alpha particles, a thin section of gold foil was placed in front of the slit, and a screen coated with zinc sulphide to make it luminous acted as a counter. Each alpha particle created a scintillation when it hit the fluorescent screen, which was seen through a viewing microscope mounted to the rear of the screen. Rutherford and his colleagues were able to move the screen around to see if any alpha particles were being deflected by the gold foil.
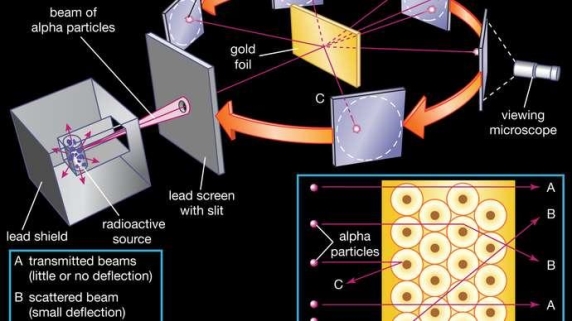
1.10.3 What are the limitations of Rutherford’s model of the atom?
Rutherford conducted an experiment in which he bombarded a thin sheet of gold with -particles and then analysed the trajectory of the particles after they collided with the gold foil.
Conclusions from the experiment
The following are the results of Rutherford's experiment:
- The majority of space in an atom is empty The space occupied by the positive charge is minuscule
- The atom's positive charges and mass were concentrated in a small space within the atom.
- The nucleus is the atom's central component.
- Electrons spin in a circular motion around the nucleus.
1.10.4 Limitations
The limitations of Rutherford's experiment are listed below.
- Rutherford's model was insufficient to explain the stability of an atom since it ignored the arrangement of electrons in orbit.
- According to Rutherford's idea, electrons travel in a circular path around the nucleus. However, particles travelling in a circular direction experience acceleration, and acceleration causes charged particles to emit energy. Electrons should eventually lose energy and fall into the nucleus.
Key takeaway:
1. The nucleus, which is located at the centre of the atom, contains the entire mass of the atom. The nucleus of an atom contains positively charged particles. The charge on an atom's nucleus is equal to (+z.e), where Z is the charge number and e is the proton charge.
2. In 1911, he was the first to discover that atoms contain a small charged nucleus surrounded by mostly empty space and surrounded by tiny electrons, resulting in the Rutherford model (or planetary model) of the atom.
1.11.1 Bohr’s Model of the Hydrogen Atom:
In terms of atomic structure, Bohr's model of the hydrogen atom is the first to correctly explain the radiation spectra of atomic hydrogen. The model holds a unique place in physics history since it introduced an early quantum theory, which sparked new scientific thought and eventually led to the development of quantum mechanics. To grasp the details of Bohr's model, it's necessary to first review the nineteenth-century discoveries that led to its creation.
Using a prism to investigate white light from the sun, we may see various dark lines in the solar spectrum ((Figure)). Fraunhofer lines are named after Joseph von Fraunhofer, who properly calculated the wavelengths of solar absorption lines. Gustav Kirchhoff and Robert Bunsen found that the line emission spectra of a chemical element exactly matches its line absorption spectrum between 1854 and 1861. The distinction between the absorption and emission spectra is described in (Figure). When light passes through a gas, it produces an absorption spectrum. On the background of the continuous spectrum of white light, this spectrum appears as black lines that only exist at certain wavelengths ((Figure)). The wavelengths that are lacking indicate which wavelengths of radiation are absorbed by the gas. When a gas emits light, the emission spectrum is detected. Colorful lines on a dark backdrop represent the spectrum (see (Figure) and (Figure)). The positions of the emission lines reveal the wavelengths of radiation the gas emits. Each chemical element emits a distinct spectrum of light. The positions of each element's emission lines are identical to the positions of its absorption lines. This means that atoms of a certain element absorb only specified wavelengths of radiation, and that radiation that does not have these wavelengths is not absorbed at all. This also means that the wavelengths of the radiation emitted by each element's atoms are identical to the wavelengths of the energy they absorb.
In the solar emission spectrum in the visible range from 380 nm to 710 nm, Fraunhofer lines are observed as vertical black lines at specific spectral positions in the continuous spectrum. Thousands of similar lines are detected by highly sensitive contemporary devices.

Line spectra observation: (a) absorption lines are observed; (b) emission lines are observed. (a) White light travels through a glass flask containing a chilly gas. The wavelengths of the passing light are separated using a prism. Some wavelengths in the spectrum of the passing light are missing, resulting in black absorption lines in the continuous spectrum on the viewing screen. (b) A gas is held in a glass discharge tube with electrodes on both ends. The gas glows when there is a large potential difference between the electrodes, and the light it emits passes through the prism that separates its wavelengths. Only specified wavelengths are present in the emitted light's spectrum, which are visible on the screen as multicoloured emission lines.
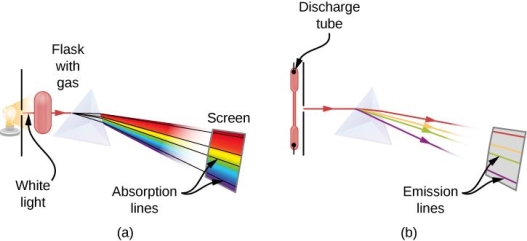
The emission spectrum of atomic hydrogen: The spectral positions of emission lines are characteristic for hydrogen atoms.

The emission spectrum of atomic iron: The spectral positions of emission lines are characteristic for iron atoms.

Emission spectra of elements feature complicated structures, which become even more complex as the atomic number of the element increases. The hydrogen atom has the simplest spectrum, as seen in (Figure). Only four lines may be seen with the naked eye. These lines are read from right to left in (Figure): red (656 nm), often known as the H- line; aqua (486 nm), blue (434 nm), and violet (434 nm) (410 nm). Lines with wavelengths less than 400 nm are visible to the naked eye and appear in the ultraviolet section of the spectrum (Figure, far left). In the series for hydrogen, there exists an unlimited number of invisible spectral lines.
Johann Balmer derived an empirical formula to characterise the locations (wavelengths) of the hydrogen emission lines in this series in 1885. The Balmer formula is as follows:

The constant  is called the Rydberg constant for hydrogen. In (Figure), the positive integer n takes on values
  for the four visible lines in this series. The series of emission lines given by the Balmer formula is called the Balmer series for hydrogen. Other emission lines of hydrogen that were discovered in the twentieth century are described by the Rydberg formula, which summarizes all of the experimental data:

The Lyman series is a set of spectral lines that exists when n f=1. The series is known as the Balmer series when n f=2, and the Rydberg formula agrees with the Balmer formula in this instance. The series is known as the Paschen series when n f=3. The series is known as the Brackett series when n f=4. The series is known as the Pfund series when n f=5. The Humphreys series appears when n f=6. Because n f can be any positive integer value, there are infinitely many such spectral bands in the spectrum of hydrogen.
The Rydberg formula for hydrogen yields the exact positions of the spectral lines as observed in a laboratory; yet, no one could explain why it worked so well at the turn of the twentieth century. Until 1913, when the first successful model of the hydrogen atom was proposed, the Rydberg formula remained unsolved.
-particles were impacted on a thin gold foil and scattered by gold atoms inside the foil in the Rutherford gold foil experiment (also known as the Geiger–Marsden experiment) (see Types of Collisions). A 360 scintillation screen surrounding the gold target detected the outgoing particles (for a detailed description of the experimental setup, see Linear Momentum and Collisions). A brief flash of light (scintillation) was noticed at the area where a scattered particle collided with the screen. The scientists were able to identify what percent of the incident particles were dispersed and what percent were not deflected at all by measuring the scintillations detected at various angles with regard to the direction of the incident beam. There would be no back-scattered -particles if the plum pudding model was right. The Rutherford experiment, on the other hand, revealed that, while a considerable portion of -particles came out the foil not dispersed at all, as if the foil had no effect on them, a considerable fraction of -particles were back-scattered toward the source. Only when the majority of the mass and the full positive charge of the gold atom were concentrated in a narrow region inside the atom was this kind of result conceivable.
Rutherford proposed the nuclear model of the atom in 1911. In Rutherford's conception, an atom had a positively charged nucleus that was almost the size of a point but held almost all of the atom's mass. Negative electrons were also present in the atom, although they were situated relatively far from the nucleus. Rutherford invented the terms proton and neutron to describe the nucleus of hydrogen and a hypothetical electrically neutral particle that would mediate the binding of positive protons in the nucleus ten years later (the neutron was discovered in 1932 by James Chadwick). The atomic nucleus was discovered by Rutherford, however the Rutherford model of atomic structure does not explain the Rydberg formula for hydrogen emission lines.
Niels Bohr proposed the Bohr model of the hydrogen atom in 1913, and it was the first quantum model to correctly explain the hydrogen emission spectrum. The quantum concept of photons is combined with the classical mechanics of planetary motion in Bohr's model. Bohr's intuition that the negative electron in the hydrogen atom must circle around the positive nucleus became a logical consequence of the inverse-square-distance law of electrostatic attraction after Rutherford demonstrated the existence of the atomic nucleus. Remember that Coulomb's law, which describes the attraction between two opposite charges, is analogous to Newton's universal law of gravitation in that both the gravitational and electrostatic forces decrease as 1/r2, where r is the distance between the bodies. The negative electron in the hydrogen atom can rotate around the positive nucleus in the same way as the Earth rotates around the sun. An accelerating charge, on the other hand, radiates its energy. If the electron travelled around the nucleus in a planetary pattern, it would be experiencing centripetal acceleration and so emitting energy, causing it to spiral down into the nucleus. Such a planetary hydrogen atom would not be stable, which contradicts what we know about non-disintegrating hydrogen atoms. Furthermore, the discrete emission spectra of hydrogen cannot be explained by the classical motion of the electron.
To circumvent these two difficulties, Bohr proposed the following three postulates of Bohr’s model:
In a circular orbit, the negative electron orbits the positive nucleus (proton). The nucleus is the core of all electron orbits. An electron bonded to the nucleus does not have access to all classically feasible orbits. The electron orbits that are permitted satisfy the first quantization condition: The electron's angular momentum L n can only take discrete values in the nth orbit:
Ln = nh, where n = 1, 2, 3, ...
The angular momentum of the electron is quantized, according to this assumption. The first quantization requirement can be stated explicitly as r n and u n, the radius of the nth orbit and the electron's speed in it, respectively.

Transitions from one orbit with E n energy to another orbit with E m energy are permitted for an electron. When a photon is absorbed by an atom, the electron moves to a higher-energy orbit. When a photon is emitted by an atom, the electron moves to a lower-energy orbit. Electron transitions with simultaneous photon absorption or emission occur in a split second. The second quantization criterion is satisfied by the allowed electron transitions:
Hf = | En – Em|
Where h f is the energy of a photon with frequency f that is either emitted or absorbed. The change in energy of an electron in the hydrogen atom is quantized, according to the second quantization condition.
These three postulates of the early quantum theory of the hydrogen atom allow us to deduce not only the Rydberg formula, but also the value of the Rydberg constant, as well as other essential aspects of the hydrogen atom like its energy levels, ionisation energy, and electron orbit sizes. The classical description of the electron as a particle exposed to the Coulomb force and whose motion must obey Newton's equations of motion is included in Bohr's model, along with two nonclassical quantization postulates. As an isolated system, the hydrogen atom must obey the rules of conservation of energy and momentum as we know them from classical physics. We can now proceed with our analysis with this theoretical framework in mind.
1.11.2 Electron Orbits
We use Newtonian mechanics to determine the radius r n of the electron's nth orbit and the electron's speed v n within it. The electron experiences an electric pull toward the positively charged nucleus at the centre of its circular orbit as a charged particle. The centripetal force causes the electron to move in a circle around the nucleus due to the electrostatic pull. As a result, the magnitude of centripetal force and the magnitude of electrostatic force are identical:

Here, denotes the value of the elementary charge. The negative electron and positive proton have the same value of charge, |q| = e When (Figure) is combined with the first quantization condition given by (Figure), we can solve for the speed,  and for the radius,


Because all other numbers in the preceding equations are basic constants, these results inform us that the electron's speed and orbit radius depend only on the index n that enumerates the orbit. The size of the orbit expands as the square of n, as shown in (Figure). This means the second orbit is four times the size of the first, the third orbit is nine times the size of the first, and so on. The electron's speed in the orbit reduces as the orbit size grows, as shown in (Figure). For n=1, the electron's speed is greatest in the first Bohr orbit, which is closest to the nucleus. The Bohr radius of hydrogen, represented as a=0, is the radius of the first Bohr orbit. Setting n=1 in (Figure) yields the following value:

We can substitute  in (Figure) to express the radius of the nth orbit in terms of
rn = a0 n2
This result means that the electron orbits in hydrogen atom are quantized because the orbital radius takes on only specific values of a0, 4a0, 9a0, 16a0, . . . given by (Figure), and no other values are allowed.
1.11.3 Electron Energies
The total energy  of an electron in the nth orbit is the sum of its kinetic energy
  and its electrostatic potential energy
  Utilizing (Figure), we find that

Recall that the electrostatic potential energy of interaction between two charges  and
and  that are separated by adistance
  is
is
(1/4πϵ0) q1 q2 / r12
Here, q1 = +e is the charge of the nucleus in the hydrogen atom (the charge of the proton), q2 = e is the charge of the electron and r12 = rn is the radius of the nth orbit. Now we use (Figure) to find the potential energy of the electron:

The total energy of the electron is the sum of (Figure) and (Figure):

Note that the energy depends only on the index n because the remaining symbols in (Figure) are physical constants. The value of the constant factor in (Figure) is

It is convenient to express the electron’s energy in the nth orbit in terms of this energy, as

We can now see that the electron energies in the hydrogen atom are quantized since they can only have discrete values of given by (Figure) and no other energy values are permitted. The energy spectrum of hydrogen ((Figure)) is a collection of permissible electron energies. The energy quantum number is the index n that enumerates energy levels in Bohr's model. We compare the energy of the hydrogen atom's electron to the energy of the hydrogen atom. Because n=1 yields the minimum value of energy, the hydrogen atom cannot have an energy lower than that. The ground state energy of the hydrogen atom is the minimum value of electron energy in the hydrogen atom, and its value is
E1 = E0 = - 13.6 eV
Other energies of the hydrogen atom may exist in addition to the ground state. The higher energy states of a hydrogen atom are known as excited energy states.
There is only one ground state, but there are an endless number of excited states due to the unlimited number of n values in the equation (Figure). When the electron's energy is E 2 (when n=2), the second excited state when its energy is E 3 (when n=3), and the nth exited state when its energy is E (n+1), we call it the "first exited state." There is no highest-of-all excited state, yet the sequence of excited states has a limit. If we keep increasing n in (Figure), we arrive at the following conclusion: The electron is no longer connected to the nucleus and becomes a free electron at this point. As long as an electron's energy is negative, it remains trapped in the hydrogen atom. In the ground state, an electron orbiting the nucleus in the first Bohr orbit, closest to the nucleus, has the minimum energy value. The electron is most tightly coupled to the nucleus in the ground state, and its energy is provided by (Figure). We must provide this electron with enough energy, E_, to balance out its ground state energy if we want to remove it from the atom. 1 (E 1)
E∞ + E1 = 0 E∞ = E1 = (E0) = E0 = 13.6 eV
The ionisation energy is the amount of energy required to remove an electron from an atom. The ionisation limit of the hydrogen atom is the ionisation energy E_ required to remove the electron from the first Bohr orbit. The measured result accords with the ionisation limit obtained in Bohr's model (Figure).
The hydrogen atom's energy spectrum. The bound states of an electron in an atom are shown by energy levels (horizontal lines). There is just one ground state with n=1 quantized excited states, and there are infinite quantized excited states. The quantum number n=1,2,3,4,.... Enumerates the states. The allowable electron transitions between the states are represented by vertical lines. Transitions involving an emission of a photon with a wavelength in the designated spectral band are depicted by downward arrows.
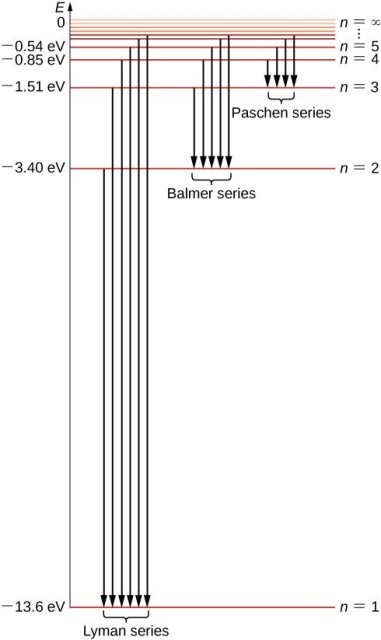
1.11.4 Spectral Emission Lines of Hydrogen
We utilise the second of Bohr's quantization conditions and (Figure) for energies to get the wavelengths of the emitted radiation when an electron transitions from the nth to the mth orbit. Only when an electron transitions from an excited state to a lower-energy state can energy be emitted from the atom. The difference in energy between the states involved in the transition is carried away by the emitted photon during such a transition. Because a photon's energy cannot be negative, the transition cannot occur in the other direction, requiring E n>E m and >m for emission. As a result, the third of Bohr's postulates results in

Now we express the photon’s energy in terms of its wavelength, hf = hc/λ and divide both sides of (Figure) by  The result is

The value of the constant in this equation is

The Rydberg constant R H in the Rydberg heuristic formula is exactly this value (Figure). In reality, because we have n=m+1,m+2,.... For a given m, (Figure) is equal to the Rydberg formula. In this method, we can deduce the experimental Rydberg constant from first principles and describe it in terms of basic constants using the Bohr quantum model of the hydrogen atom. Transitions between the permitted electron orbits are depicted in the diagram (Figure).
We may use the same techniques as before to get the wavelength of the absorbed radiation; this gives us (Figure), but this time for the positions of absorption lines in the hydrogen absorption spectrum. The main distinction is that in absorption, the quantum number m is the index of the electron's orbit before the transition (lower-energy orbit) and the quantum number n is the index of the orbit to which the electron makes the transfer (higher-energy orbit) (higher-energy orbit). The energy of the absorbed photon is the difference between the electron energies in these two orbits.
The spectra of several hydrogen-like ions are also well predicted by Bohr's model of the hydrogen atom. Hydrogen-like ions are atoms with an atomic number Z greater than one (Z=1 for hydrogen) that have all but one of their electrons removed. An electrically neutral helium atom, for example, has the atomic number Z=2. This indicates it has two electrons with a charge of q=+Ze orbiting the nucleus. When one of the orbiting electrons from a helium atom is removed (known as singly ionisation), a hydrogen-like atomic structure remains, with the remaining electron orbiting the nucleus with a charge of q=+Ze. The Bohr model describes this type of event. Assume that the nucleus' charge is +Ze rather than +e. To get the findings for a hydrogen-like ion, repeat all steps starting with (Figure):
rn = 
Where  , n is the Bohr orbit of hydrogen, and

Where E 0 is the hydrogen atom's ionisation limit. As long as the atomic number Z is not too big, these formulae are excellent approximations.
Because it was the first model to postulate the quantization of electron orbits in atoms, the Bohr model is significant. As a result, it is an early quantum theory that paved the way for the development of modern quantum theory. It was the first time a quantum number was used to describe atomic states. The early quantum theory has the constraint of being unable to describe atoms with more than one electron orbiting the nucleus. Because it blends the classical concept of electron orbits with the novel concept of quantization, the Bohr model of hydrogen is a semi-classical model. The model's exceptional success motivated many physicists to look for an explanation for why it worked at all, as well as an understanding of the physics behind early quantum theory's postulates. This quest resulted in the birth of a completely new notion known as "matter waves."
1.12.1 Introduction to Atomic Spectroscopy
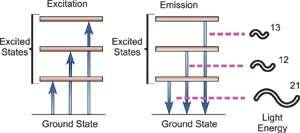
Fig. Energy Transitions
Atomic spectroscopy is the study of an element's electromagnetic or mass spectrum to determine its composition. Optical Atomic Spectroscopy is the study of an element's electromagnetic spectrum. Within an atom, electrons exist in different energy states. Electrons travelling between these levels must absorb or emit energy equal to the difference in their energies. The energy absorbed to shift an electron to a higher energetic energy level and/or the energy emitted as the electron goes to a less energetic energy level is measured in photons in optical spectroscopy. The electronic transition that has happened is closely related to the wavelength of the emitted radiant radiation. The wavelength of light emitted is a unique attribute of each individual element because each has its own electrical structure. Because a large atom's orbital structure can be complicated, several electronic transitions can occur, each of which results in the emission of a specific wavelength of light, as seen below.
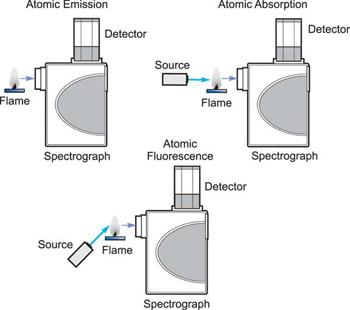
How the three techniques are implemented.
Three analytical approaches have emerged from the study of atomic spectroscopy: Atomic Absorption is a term that refers to the process of absorbing Emission of atoms. Fluorescence of atoms. In all three domains of atomic spectroscopy, the process of excitation and decay to the ground state is involved. The energy received in the excitation process or the energy emitted in the decay process is measured and analysed.
When a free, ground state atom is struck by light of just the correct wavelength, the atom may absorb the light as it transitions to an excited state, a process known as atomic absorption. On the right, you can see how this works. The amount of light at the resonant wavelength that is absorbed as it travels through a cloud of atoms is referred to as atomic absorption. The amount of light absorbed grows in a predictable manner as the number of atoms in the light path rises. A quantitative determination of the amount of analyte element present can be made by measuring the amount of light absorbed. Individual elements can be determined quantitatively in the presence of others using special light sources and careful wavelength selection. Providing enough heat energy to the sample to breakdown the chemical compounds into free atoms produces the atom cloud required for atomic absorption measurements. This is accomplished by aspirating a sample solution into a flame aligned with the light beam. Most atoms will remain in the ground state at the right flame conditions and will be able to absorb light at the analytical wavelength from a source lamp. Because of the ease and speed with which precise and accurate assessments can be produced, atomic absorption has become one of the most preferred methods for determining metals.

The atomic absorption process
A sample is exposed to a high-energy, thermal environment in order to develop excited state atoms capable of producing light in atomic emission. An electrical arc, a flame, or, more recently, a plasma can all be used as energy sources. Because of the discrete nature of the emitted wavelengths, the emission spectrum of an element exposed to such an energy source consists of a collection of the permissible emission wavelengths, generally referred to as emission lines. This emission spectrum can be used to qualitatively identify an element by its emission spectrum. In qualitative analysis, atomic emission utilising electrical arcs has been widely employed. Emission techniques can also be used to figure out how much of a particular element is in a sample. The intensity of light emitted at the wavelength of the element to be evaluated is measured for a "quantitative" analysis. As the number of atoms in the analyte element rises, the emission intensity at this wavelength increases. Flame photometry is a technology that uses atomic emission to do quantitative analysis.
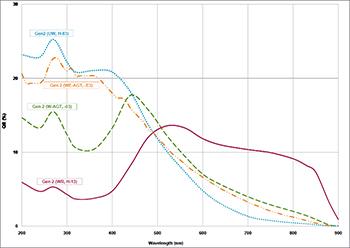
ICCD Quantum Efficiency relevant to Atomic spectroscopy
Atomic fluorescence is the third branch of atomic spectroscopy. Aspects of both atomic absorption and atomic emission are included in this approach. Ground state atoms generated in a flame are awakened by focussing a beam of light into the atomic vapour, similar to atomic absorption. The emission coming from the decay of the atoms stimulated by the source light is measured instead of the amount of light absorbed in the process. With increasing atom concentration, the intensity of this "fluorescence" increases, allowing for quantitative determination. The atomic fluorescence source lamp is angled away from the rest of the optical system, so the light detector only sees the fluorescence in the flame and not the light from the lamp. It is beneficial to optimise lamp intensity since sensitivity is directly related to the number of excited atoms which in turn is a function of the intensity of the exciting radiation.
While atomic absorption is the most extensively used of the three techniques and typically provides various advantages over the other two, in specific analytical conditions, emission or fluorescence may provide additional benefits.
1.12.2 Rydberg Formula
Using the Rydberg formula, it becomes easy to calculate the spectral lines. Following is the formula:

Where,
R is the Rydberg constant (1.09737*107 m-1)
Z is the atomic number
n is the upper energy level
n’ is the lower energy level
λ is the wavelength of light
Spectral series of single-electron atoms like hydrogen have Z = 1.
Following is the table for λ in vacuum:
Series | n | λ (nm) |
Lyman series with n’=1 | 2 | 121.57 |
3 | 102.57 | |
∞ | 91.175 | |
Pfund series with n’=5 | 6 | 7460 |
7 | 4654 | |
∞ | 2279 | |
Humphreys series with n’=6 | 7 | 12.37 |
8 | 7.503 | |
∞ | 3.282 |
Following is the table for λ in the air:
Series | n | λ (nm) |
Balmer series with n’=2 | 3 | 656.3 |
4 | 486.1 | |
∞ | 364.6 | |
Paschen series or Bohr series with n’=3 | 4 | 1875 |
5 | 1282 | |
∞ | 820.4 | |
Brackett series with n’=4 | 5 | 4051 |
6 | 2625 | |
∞ | 1458 |
1.12.3 Atomic Spectroscopy
The study of the electromagnetic radiation received or emitted by atoms is known as atomic spectroscopy. There are three different forms of atomic spectroscopy:
- The transfer of energy from the ground state to an excited state is the subject of atomic emission spectroscopy. Atomic emission can explain the electronic transition.
- Atomic absorption spectroscopy: For absorption to occur, the lower and higher energy levels must have the same energy difference. The notion that free electrons created in an atomizer can absorb radiation at a given frequency is used in the atomic absorption spectroscopy principle. It measures how much ground-state atoms absorb in the gaseous state.
- Atomic fluorescence spectroscopy combines atomic emission and atomic absorption since it involves both excitation and de-excitation radiation.
1.12.4 Uses of Atomic Spectroscopy
- It is used for identifying the spectral lines of materials used in metallurgy.
- It is used in pharmaceutical industries to find the traces of materials used.
- It can be used to study multidimensional elements.
1.13.1 Reduce Mass:
We assumed that the nucleus of a one-electron atom is infinitely massive and does not move when calculating the energy of the electron. Despite the fact that m em p/2000 is an acceptable approximation, spectroscopy is a very exact discipline, and the wavelength disparity owing to the infinite mass assumption can be noticed. As a result, we must account for the nucleus' finite mass and mobility in order to improve our formulations.
First, the hydrogen atom's centre of mass (CM) is unaccelerated since the net external force on the atom is zero. As a result, we can rest the CM in an appropriate inertial frame. Around the stationary CM, the proton and electron orbit. We suppose that the proton and electron orbit the CM rigidly, thus their angular velocity is the same. Let us also assume that the origin is at the proton's location.
(a) The position of the CM is given by


(b)
vp = rp ω. ve = re ω.
K = Ke + Kp = ½ me re2 ω2 + ½ mp rp2 ω2


Where

Is the reduced mass.
[Notice that the only difference between the above expression for K and the fixed-proton result is that µ has replaced me. Also, note that  for hydrogen.]
(c) The electrostatic force exerted on the proton is  2/r2
2/r2
The centripetal force

But

So


Equating the electrostatic force to the centripetal force gives

The same result is obtained for the electron
(d) The potential energy is given by

Using Eq. (iv), we can write


(e)
L = Le + Lp = mprpvp + mereve = mprp2 ω + mere2 ω

(f) It is clear that correcting the previously derived result only entails replacing me by µ . Thus, the Rydberg energy becomes

Despite the prominence of this interpretation in the physics literature, current Bohr scholars agree that Bohr did not mean his correspondence principle to indicate some form of general necessity that quantum mechanics retrieve the predictions of classical mechanics in the classical limit (see Section 6). There is less agreement, however, on which relationship between classical and quantum mechanics Bohr meant the correspondence principle to designate. In the literature, there are three main contenders, all of which are supported by Bohr's publications. The frequency interpretation, the intensity interpretation, and the selection rule interpretation are the three interpretations that can be labelled.
The correspondence principle is characterised by the frequency interpretation as a statistical asymptotic agreement between the (quantum) frequency, vn′Vn", of radiation released in a quantum leap of difference from state n′ to n′′ and the (classical) frequency () in the n′ stationary state, namely

Where, n′−n′′=τ
It's worth noting that this equality between the quantum frequency and one component of the classical frequency applies only in the case of large quantum numbers—it doesn't hold for low quantum-number transitions. Furthermore, there is only statistical agreement because classically all the frequencies will be given off together, whereas quantum mechanically only a single photon with a single frequency is emitted in any given transition between stationary states; thus, one must compare the classical spectrum with a statistical ensemble of atoms.
The correspondence principle, according to the intensity interpretation, is described as the agreement, in the limit of large quantum numbers, between the probability, Pn′n", of a transition between two stationary states separated by and the square of the amplitude, C, of the classical motion:

Thus in the limit of large nn the amplitudes of the harmonic components of the electron’s classical orbit can be used to calculate the intensities of the spectral lines. While the amplitude of radiation determines its intensity in classical physics, the number of photons released at a given frequency determines the intensity of a spectral line in quantum physics. As a result, the more likely a quantum transition is, the more photons will be emitted, and the higher the intensity. It's worth noting that, like the frequency interpretation, this is merely a statistical relationship that holds only in the case of big quantum numbers.
Bohr's correspondence principle is best understood as the assertion that each permissible quantum transition between stationary states corresponds to one harmonic component of classical motion, according to the selection rule interpretation. More precisely, Bohr’s selection rule states that the transition from a stationary state n′ to another stationary state n′′ is allowed if and only if there exists a τth harmonic in the classical motion of the electron in the initial stationary state; if there is no τth harmonic in the classical motion, then transitions between stationary states whose separation is τ are not allowed quantum mechanically. Figure 1 depicts the essence of Bohr's correspondence principle.

A classical periodic orbit, x(t)x(t), can be represented as a Fourier sum of “harmonics” which are integer multiples of the fundamental frequency, ωω, representing the periodicity of the motion. According to the selection rule interpretation, the correspondence principle is Bohr’s insight that each allowed transition between stationary states corresponds to one harmonic component of the classical motion. (Based on Fig. 3 of Fedak and Prentis 2002)
Bohr’s selection rule can be illustrated by the following simplified example. Suppose that the solution to Newton’s equation,  , and the quantum condition ∮pdx=nh is
x(t, n) = n cos (n1/2 t) + n1/2 cos (3n1/2 t),
This is the Fourier decomposition of the electron's classical periodic motion in a permitted stationary state nn. The fundamental frequency (i.e., periodicity of electron motion) for this stationary state nn is n12. Note that in the classical motion, only the first (=1) and third (=3) harmonics are present (Equation 6). According to Bohr's selection rule, quantum jumps between stationary states that are one or three stationary states away are possible. So, for example, transitions from the n=100 stationary state to the n=99 or n=97 stationary states are possible; however, transfers from the n=100 stationary state to the n=98 stationary state are not possible because the classical electron orbit lacks a second harmonic.
The selection rule interpretation, unlike the frequency and intensity interpretations of the correspondence principle, is not an asymptotic relation; it applies to all quantum number transitions, including small n.
It's important to remember that Bohr found and wrote about all of these correspondence relations; the debate among Bohr researchers is over which of these correspondence links (if any) Bohr intended to designate as the correspondence principle. Some experts have even questioned whether Bohr ever had a well-defined and consistent definition of the correspondence principle.
Key takeaways:
- Bohr's correspondence principle demands that classical physics and quantum physics give the same answer when the systems become large. ... The conditions under which quantum and classical physics agree are referred to as the correspondence limit, or the classical limit.
- The Bohr model can be summarized by the following four principles: Electrons occupy only certain orbits around the nucleus. Those orbits are stable and are called "stationary" orbits. Each orbit has an energy associated with it.
1.15.1 Bohr’s Theory – Bohr’s Atomic Model
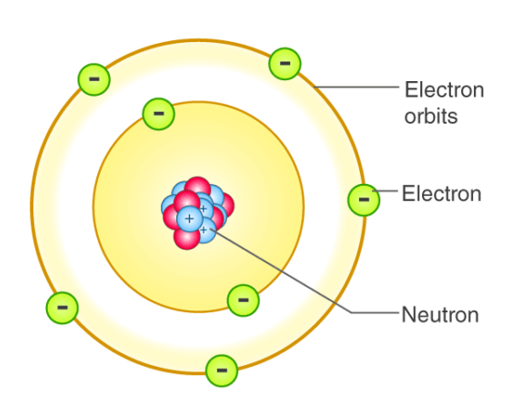
Thomson's and Rutherford's atomic models both failed to answer any problems about the energy and stability of an atom. Niels Bohr proposed an atomic structure model in 1913, describing an atom as a small, positively charged nucleus surrounded by electrons that travel in circular orbits around the positively charged nucleus like planets orbiting the sun in our solar system, with attraction provided by electrostatic forces. It was essentially an upgraded version of Rutherford's atomic model that addressed its flaws. He agrees with him on the majority of points, such as the notion of nucleus and electrons encircling it. Electrons revolve around the nucleus in stable orbits without emitting radiant energy, according to Niels Bohr's atomic model. Each orbit has a distinct energy level, which is referred to as an energy shell or energy level, and is denoted by the letters K, L, M, and N. The electron is said to be in the ground state when it is at its lowest energy level.
- When an electron jumps from one orbit or energy level to another, it emits or absorbs energy. It emits energy when it jumps from a higher to a lower energy level, while it absorbs energy when it goes from a lower to a higher energy level.
- Plank's equation determines the energy received or emitted as the difference between the energies of the two energy levels (E1, E2).
ΔE = E2-E1 = hv
Where,
ΔE = energy absorbed or emitted
h= Plank’s constant
v= frequency of electromagnetic radiation emitted or absorbed
- The angular momentum of an electron revolving in energy shells is given by:
mevr = nh/2π
Where,
n= number of corresponding energy shell; 1, 2, 3…
me= mass of the electron
v= velocity
r=radius
h= Plank’s constant
1.15.2 Limitations of Bohr Atomic Model Theory
- It goes against Heisenberg's Uncertainty Principle. According to the Bohr atomic model theory, electrons have both a known radius and orbit, i.e., known position and momentum at the same time, which Heisenberg claims is impossible.
- When it comes to smaller atoms like hydrogen, the Bohr atomic model theory makes accurate forecasts, but when it comes to larger atoms, it makes poor spectral predictions.
- When the spectral line is broken into numerous components in the presence of a magnetic field, it fails to explain the Zeeman effect.
- It was unable to account for the Stark effect, which occurs when a spectral line splits into fine lines in the presence of an electric field.
1.16.1 Discrete energy and radioactivity
Discrete energy and discrete energy levels
- An atom's electrons can occupy discrete atomic energy levels, and energy is received or released in the form of a photon as an electron jumps from one energy level to another. The difference between discrete atomic energy levels is equivalent to the amount of energy absorbed or emitted, and it is quantized. A photon's energy is proportional to its frequency. As a result, an atom can only absorb or release photons with frequencies that correspond to the disparities between the atomic energy levels. In the emission and absorption spectra, these frequencies appear as spectral lines.

- The existence of discrete energy levels called atomic energy levels can be supported by the emission spectra and the absorption spectra of atoms.
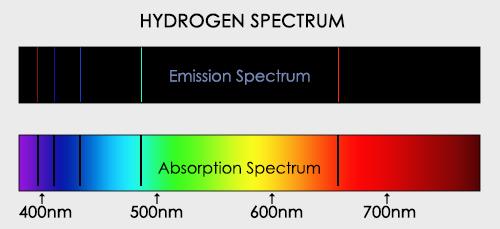
Transitions between energy levels
Energy is released in the form of light when electrons within an atom shift from one atomic energy level to a lower energy level. When electrons within an atom travel from one atomic energy level to a higher energy level, light is absorbed.
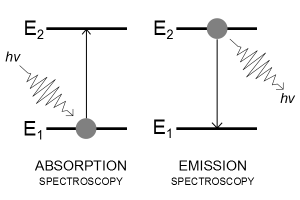
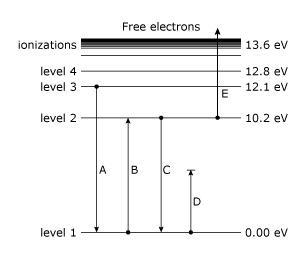
The difference in energy (eV) between the two energy levels can be used to compute the amount of energy received or released.
Radioactive decay
- The spontaneous random process by which particles or electromagnetic radiation are emitted from an unstable nucleus is known as radioactive decay. A daughter nucleus is the product nucleus of radioactive decay.
- The daughter nucleus is energetically unstable, and half-lives reveal the activity of radioactive decay.
Activity (half-life decay)

Half-life 
- The time it takes for half of a substance's radioactive nuclei to decay is known as its radioactive half-life.
- The decay curve is formed by plotting the amount of radioactive nuclei that have not yet decayed against time. It can be presented as follows.
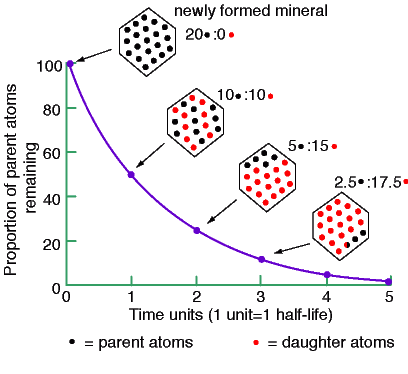
Fundamental forces and their properties


Alpha particles, beta particles and gamma rays
Alpha particles
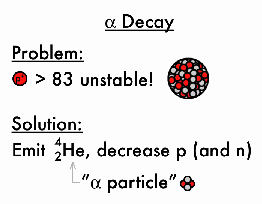
An alpha particle is a helium nucleus.
It has a relative charge of +2, has the lowest penetration power of the three types of particles, and can be prevented by a piece of paper or a few centimetres of air, and has the highest ionising power of the three types of particles.
Beta particles
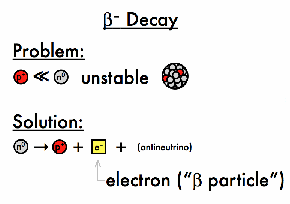
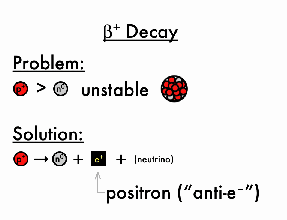
A beta particle is an electron or a positron.
It has a relative charge of -1 or +1, and its penetrating power is in the middle of the three types of particles. Its ionising power is in the middle of the three types of particles, and it may be prevented by a thin sheet of aluminium.
Gamma rays
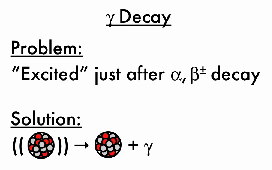
- Gamma rays are photons that do not have a charge and have the maximum penetration strength of the three types of particles, which can be prevented by several centimetres of lead.
- It has the lowest ionising power of the three types of particles.


Absorption characteristics of decay particles
Short-term effects | Long-term effects |
Radiation burn Nausea and vomiting Diarrhoea Headache | Cancer Genetic mutations |
Isotopes
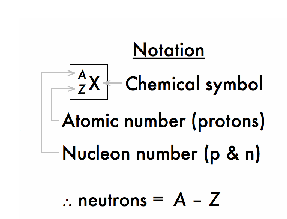
Distinct isotopes of the same element have the same atomic number (which determines the element's type) but differing mass numbers due to different neutron counts.
Background radiation
Background radiation comes from natural sources and artificial sources.
- Cosmic rays from space, radioactive rocks and soil, and living animals that have consumed radioactive compounds in the food chain are all natural sources.
- Radioactive waste from nuclear power plants, radioactive fallout from nuclear weapons, and medical x-rays are all examples of artificial sources.
Average composition and exposure of background radiation
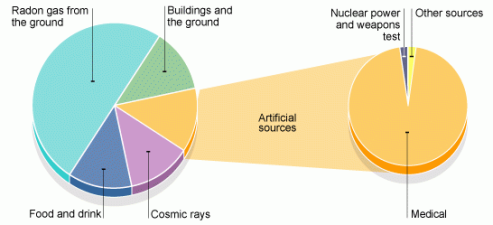

1.17.1 Introduction
The hydrogen atom's Bohr model was effective in that it accurately explained the spectrum of radiation emitted by these atoms. In essence, the model suggested the presence of discrete electronic energy levels in atoms, which could be estimated based on the assumption that the circling electrons' angular momentum was quantized. The spectrum of atomic hydrogen was explained using a combination of the concept of quantized energy levels and the idea that a quanta of radiation can only be released (with frequency determined by the Einstein relation) when an atom shifts its energy to a more tightly bound state. Other methods of obtaining more direct proof of the existence of distinct energy levels in atomic systems exist, though.
The effect of hitting mercury atoms with electrons will be investigated in this experiment. Because atoms are thought to have discrete energy levels, one would anticipate energy to be transferred to the atom in distinct amounts after collisions with electrons. Inelastic scattering is one proposed process, in which a defined quantity of transmitted electron energy is absorbed by the entire atom, raising it to an excited state. The mechanics of such a collision allow the atomic system to absorb practically all of the energy of the input electron, as long as the atom does not become ionised.
In 1914, Franck and Hertz attempted to validate these notions for the first time. Specifically, that atomic systems contain discrete energy levels that can be stimulated by bombardment electron collisions, and that the energy differences between the levels correspond to spectroscopic measurements. Using mercury vapour, we will perform the Franck-Hertz experiment. The wavelength of the spectral line detected in mercury discharges, which corresponds to the energy levels we will detect, is 2537. There are many additional lines in the mercury spectra, but using a Franck-Hertz setup, it is extremely difficult to excite these energy differences in the mercury atom.
1.17.2 Equipment
Figure shows a diagram of the equipment that will be used. It consists of a thermionic tube with a cathode, an anode, and a collector or counter electrode as the third electrode. A little blob of mercury is also present in the tube. The tube is grounded by the metal case that surrounds it. To keep a mercury vapour pressure in the tube, the mercury is heated to 180 degrees Celsius. Of course, pressure varies with temperature, and the amount of pressure is crucial to the experiment. There may be too few mercury atoms to create noticeable effects if the vapour density is too low. When the pressure is too high, the mean free path is reduced, and thermal agitation occurs.
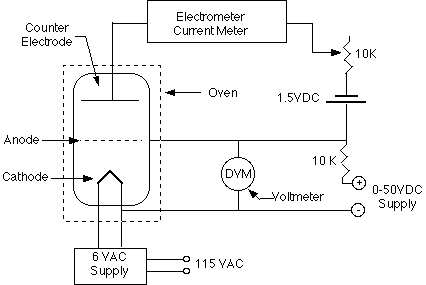
In relation to the cathode, the anode is connected to a variable voltage source (0 to +50 Volts). In relation to the anode, the counter electrode is kept at a voltage of 0.5 to 1.5 volts negative. A voltage divider and a 1.5 volt battery can be used to control the counter electrode voltage.
The cathode-anode system essentially functions as a diode. Some electrons can travel through the anode, which is a grid-like structure, and overcome the 0.5 - 1.5 Volts retarding potential to reach the counter electrode if they are energetic enough. The Keithley Electrometer, which is a very sensitive device capable of measuring the little current involved, can be used to measure the counter current.
However, we must evaluate how the presence of mercury vapour alters the system's behaviour. The mercury atoms will collide with electrons propelled from the cathode to the anode. When electrons gain enough energy to inelastically excite a mercury atom, they can lose the majority of their energy. It may therefore be unable to overcome the 0.5 - 1.5 Volts required to reach the counter electrode due to a lack of energy. As the anode voltage is increased, the counter current should drop sharply at the energy level where such collisions can occur. The counter current begins to grow again at greater voltages, but the electrons eventually accumulate enough energy to experience two or more inelastic collisions. As a result, the observed current-voltage curve should be continuously rising with a sequence of dips; the difference in energy between the ground state and first excited state in the mercury atoms will correspond to the interval of two dips.
1.17.3 Procedure
- The circuit in the illustration has already been set up for you, and the tube has been warmed up. Make sure the oven is set to 180 degrees Celsius. Make a note of the temperature. The ground of the electrometer should be the same as the ground of the thermionic tube's metal housing. Begin with a 0V anode voltage. Slowly increase the voltage while keeping the Keithley Electrometer on its most sensitive scale until you receive a distinct signal on the electrometer. Make a note of the voltage.
- Continue to progressively increase the anode voltage. Because the electrometer reacts slowly to these changes, provide plenty of time for it to react. Record the voltage and the related current at each local maximum and minimum in current.
- Raise the anode voltage to at least 50V. (do not exceed this voltage). When you've reached this point, reduce the voltage to zero and wait for the equipment to recuperate for at least five minutes. Check the temperature once more to ensure that it is maintaining a consistent level.
- Repeat steps 2-4 for a total of two times. Take at least one data point between the highest and minimum during your last run.
1.17.4 Data Analysis
For each data set, graph current vs. Voltage.
- Calculate the amount of energy transferred from an electron to a mercury atom in an inelastic collision using your graphs.
- Compare this to the projected energy from the spectral line 2537. Estimate Planck's constant using the energy given above and the 2537 spectral line (with associated uncertainty).
- To extract an electron from a metal, a specific minimum energy is required; this is referred to as the metal's "work function." The anode's work function is higher than the cathode's, resulting in a "contact-potential differential" between the anode and the cathode. It causes the entire Current vs. Voltage curve to change (why?). Calculate the difference in contact potential.
- Describe the characteristics of the detected counter current. Temperature, vapour pressure, accelerating voltage, space charge, and other physical events influence these characteristics. Make sure to bring these up in your conversation. One of the references given below may be of assistance to you.
1.18.1 Sommerfeld atom model and its Drawbacks
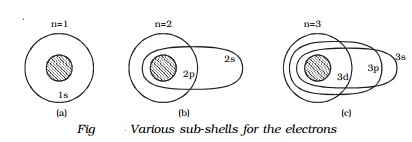
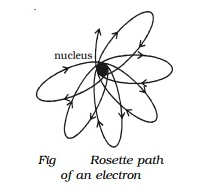
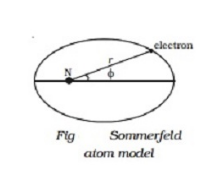
In order to explain the observed fine structure of spectral lines, Sommerfeld introduced two main modifications in Bohr's theory.
1.18.2 Sommerfeld atom model
Sommerfeld made two major changes to Bohr's theory in order to explain the observed fine structure of spectral lines.
I According to Sommerfeld, an electron's route around the nucleus is a general ellipse with the nucleus as one of its foci.
(ii) The electron's velocity in an elliptical orbit change at different points along the orbit. The mass of the travelling electron varies relativistically as a result of this.
When elliptical orbits are allowed, there are now two variables to consider.
(i) The electron's fluctuating distance from the nucleus (r).
(ii) The azimuthal angle, which describes the changing angular location of the electron with regard to the nucleus (Fig).
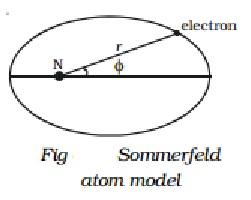
Two quantum numbers are introduced to cope with these two variables.
(i) In Bohr's theory, the primary quantum number n governs the energy of the electrons, and
(ii) an orbital (or azimuthal) quantum number (l) that has been introduced to characterise the angular momentum in an orbit, i.e., it determines the electron's orbital angular momentum. Its values range from zero to (n-1) in unity steps.
This orbital quantum number (l) can be used to calculate the number of potential elliptical orbits. The elliptical orbits that are possible are such that
b/a = l+1/n
Where a and b are the ellipse's semi-major and semi-minor axes, respectively.
Sommerfeld's model states that for any principal quantum number n, there are n potential sub-orbits or sub-shells with various eccentricities. One of the n subshells is circular, whereas the others (i.e., n-1) are elliptical
Because of the relativistic difference in electron mass, these hypothetical sub-orbits have slightly different energies
Take a look at the first energy level (n=1). When n = 1, l = 0, indicating that the electron has only one orbit or sub-shell at this energy level. The two axes of the ellipse are also identical when a = b. As a result, the orbit associated with n=1 is circular. This subshell is known as the s subshell. This sub-shell is referred to as 1s since it belongs to the n=1 group (Fig a).
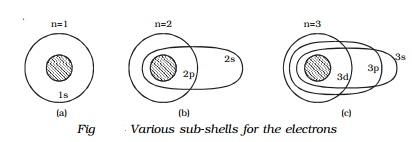
Similarly, for the second energy level n=2, there are two permissible sub-shells for the electrons. For n=2, l can take two values, 0 and 1.
When n = 2, l = 0.
b/a= 0+1/2 =1/2
Or
b=a/2
This subshell corresponding to l = 0 is elliptical in shape and is designated as 2s.
When n = 2, l = 1.
b/a= 1+1/2 =2/2 =1
Or
b=a
This sub-shell corresponding to l = 1 is circular in shape and is designated as 2p (Fig b).
For n = 3, l has three values 0, 1 and 2, i.e. there are three permissible sub-shells for the electrons.
When n = 3, l = 0.
b/a= (0+1)/3 =1/3 =1 or b=a/3
When n = 3, l = 1.
b/a= (1+1)/3 =2/3 =1 or b=2a/3
And when n = 3, l = 2.
b/a= (2+1)/3 =3/3 =1 or b=a
3s, 3p, and 3d are the sub-shells that correspond to l = 0, 1, and 2. The 3d shell is circular, while the other two are elliptical in shape (Fig c).
It is common practice to assign letters to l-values as given below:
Orbital quantum number l : 0 1 2 3 4
Electron state: s p d f g
Hence, electrons in the l = 0, 1, 2, 3 states are said to be in the s, p, d, f states.
1.18.3 Fine structure of spectral line
The total energy of an electron in an elliptical orbit can be calculated using the Sommerfeld atom model as follows:
En = (-me4Z2 ) / (8ε02h2n2)
This is the same expression that Bohr came up with. As a result, the addition of elliptical orbits results in no new energy levels and, as a result, no new transition. Sommerfeld's attempt to explain the fine structure of spectral lines so failed. Sommerfeld was able to solve the problem of the fine structure of the spectral lines soon after, based on the fluctuation of electron mass with velocity.
The electron's velocity is greatest when it is closest to the nucleus and lowest when it is farthest from the nucleus, according to Sommerfeld, since the electron's orbit is elliptical. This means that the electron's effective mass will vary depending on where it is in its orbit. Sommerfeld adjusted his theory to account for relativistic variations in electron mass and demonstrated that the electron's path is a precessing ellipse known as a rosette, rather than a simple ellipse (Fig).
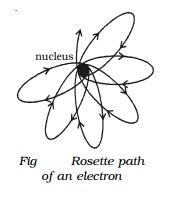
Sommerfeld was able to describe the fine structure of hydrogen atom spectral lines using this concept.
Drawbacks
I While Sommerfeld's modification provided a theoretical framework for the fine structure of hydrogen spectral lines, it was unable to predict the right number of fine structure lines seen.
(ii) It was unable to explain how electrons are distributed and arranged in atoms.
(iii) Sommerfeld's model failed to account for the spectra of alkali metals such as sodium and potassium
(iv) It was unable to explain the Zeeman and Stark effect.
(v) The intensities of the spectral lines are not explained by this hypothesis.
Key takeaways:
Arnold Sommerfeld, a German physicist, improved Bohr's theory by quantizing the shapes and orientations of orbits, resulting in the introduction of extra energy levels corresponding to tiny spectral lines. The atom was characterised in terms of two quantum numbers in the new and more broad Bohr–Sommerfeld theory, whereas Bohr had only employed one quantum number in his original theory. The Stark effect, the conventional Zeeman effect, and the fine structure of the hydrogen spectrum were all explained by this extension. The refinements were: (a) the addition of elliptic orbits; (b) the consideration of relativistic mass effects; and (c) the allowing for an orbiting motion of the nucleus.
References:
1.Quantum Mechanics: Theory and Applications, A.K.Ghatakand S. Lokanathan,(Macmillan)-2004
2. Introduction to Quantum Theory, David Park (Dover Publications)-1974
3. Theory and Problems of Modern Physics, Schaum‘s outline,R.Gautreau and W.Savin- (Tata McGraw-Hill) 2nd Edition
4. Physics for scientists and engineer with Modern Physics-Jewell and Serway -(CENGAGE Learnings) 2010.
5. Modern Physics of Atoms and Molecules Bransden and Joachim (PearsonIndia)-2003
Unit - 1
Atomic Spectra and Models
1.1.1 The inadequacy of Classical Mechanics is:
1] It is not valid in the atomic dimension range.
2] It was unable to explain the reported black body radiation spectra.
3] The diversity in metal and gas specific heats is also unaccounted for.
4] It was unable to explain the spectrum of black body radiation seen.
5] It was unable to explain the genesis of atoms' distinct spectra. This is because energy changes are always constant according to classical mechanics.
6] A huge number of phenomena could not be explained by classical mechanics. Photoelectric effect, Raman effect, and others are examples.
Quantum Mechanics arose from the weakness of Classical Mechanics.
1.1.2 THREE FAILURES OF CLASSICAL PHYSICS:
1. Blackbody Radiation
Light is emitted at all wavelengths by any object with a temperature greater than absolute zero. The light that comes from an object that is absolutely black (and so does not reflect any light) is known as blackbody radiation.
All wavelengths of light do not share the energy of blackbody radiation equally. The blackbody radiation spectrum (below) reveals that some wavelengths get more energy than others. Three spectra at three distinct temperatures are illustrated. (One of the curves represents the Sun's surface temperature, which is 5770 K.)
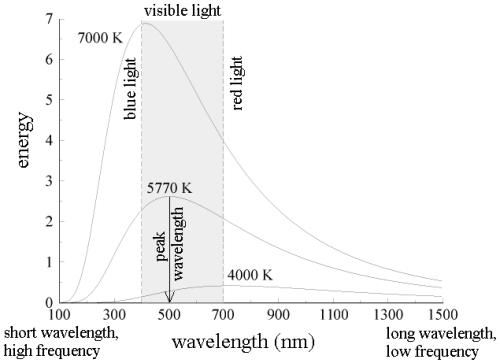
Here are some blackbody radiation experimental facts:
a. The blackbody spectrum is determined only by the object's temperature, not its composition. If their temperatures are the identical, an iron horseshoe, a ceramic vase, and a piece of charcoal will all radiate the same blackbody spectrum.
b. An object emits more blackbody energy at all wavelengths as its temperature rises.
c. As an object's temperature rises, the blackbody spectrum's peak wavelength becomes shorter (bluer). Blue stars, for example, are hotter than red stars.
d. The left-hand side of the blackbody spectrum is usually tiny (the short wavelength, high frequency side).
The explanation of classical physics: When an electric charge vibrates, it produces light, which is an electromagnetic wave. (The term "vibrates" refers to any change in the charge's motion, such as speeding up, slowing down, or changing direction.) Remember that heat is nothing more than the kinetic energy of random motion. Electrons vibrate in random directions in a heated object, producing light as a result. A hotter object produces more energetic vibrations, which results in more light being emitted —- it lights brighter. So far, everything has gone well. Classical physics, on the other hand, was unable to explain the form of the blackbody spectrum.
A heated object's electrons can vibrate at a variety of frequencies, from a few vibrations per second to thousands of vibrations per second. In reality, there is no limit to the frequency that can be used. According to classical physics, each vibration frequency should have the same energy. Because the frequency has no upper limit, the energy of the vibrating electrons at high frequencies has no upper limit. This indicates that, according to classical physics, the energy of light produced by electrons vibrating at high frequencies has no limit. The blackbody spectrum always becomes smaller on the left-hand side in experiments (short wavelength, high frequency).
Max Planck came up with the solution in 1900. He claimed that the traditional concept that each vibration frequency should have the same energy was incorrect. Instead, he claimed that electrons vibrating at various frequencies do not share energy evenly. Energy, according to Planck, arrives in clumps. A clump of energy was dubbed a quantum by him. The size of a clump of energy —- a quantum —- is determined by the vibration frequency. Planck's rule for a quantum of energy for a vibrating electron is as follows:
Quantum energy = (a calibration constant) x (frequency of vibration)
Or
Hf = E
The calibration constant, h, is now known as Planck's constant. It’s worth is approximately 6 x 10-34, which is quite small!
So, how does this explain the blackbody radiation spectrum? According to Planck, an electron vibrating at frequency f could only have an energy of 1 hf, 2 hf, 3 hf, 4 hf, and so on; that is, an electron vibrating at frequency f could only have an energy of 1 hf, 2 hf, 3 hf, 4 hf, and so on.
(Any integer) x hf = energy of a vibrating electron
If the electron is to vibrate, it must have at least one quantum of energy. If it doesn't have at least 1hf of energy, it won't vibrate and won't be able to create any light. Exclaimed Planck, "the amount of energy in a quantum, hf, is so great at high frequencies that the high-frequency vibrations can never get underway!" This is why the left-hand (high frequency) side of the blackbody spectrum is always narrow.
2. The Photoelectric Effect
When light shines on a metallic substance's surface, electrons in the metal absorb the light's energy and are able to escape through the metal's surface. The photoelectric effect is utilised to generate the electrical current that powers many solar-powered gadgets. Classical physicists predicted that when utilising very weak light, it would take some time for enough light energy to build up to eject an electron from a metallic surface, based on the assumption that light is a wave with energy spread uniformly across the wave. Experiments reveal that it doesn't matter how weak the light is if it can eject electrons from a metal if it has a specific frequency. There is no such thing as a time delay.
Albert Einstein came up with the solution in 1905. If Max Planck's theory of energy clumps (quanta) is right, light must be made up of a stream of clumps of energy. Einstein defined a photon as a clump of light energy with an energy equal to hf (Planck's constant multiplied by the frequency of the light). As a result, light energy is concentrated in photons rather than being distributed uniformly along the wave. A lower light intensity indicates fewer photons, yet lowering the light intensity (without changing the frequency) has no effect on the energy of individual photons. So, if a single photon has enough energy to eject one electron from a metallic surface for a given frequency light, electrons will always be ejected as soon as the light is turned on and the photons hit the metal.
3. The Hydrogen Atom
When a little hydrogen gas tube is heated, it glows and emits light. This light, unlike blackbody radiation from a heated dense solid or gas, has only a few colours (wavelengths): a red wavelength, a turquoise wavelength, and numerous violets. At the turn of the century, classical physicists assumed that because hydrogen is the simplest atom, they should be able to grasp it. A positively charged proton is at the heart of hydrogen, with a negatively charged electron surrounding it. The electron is kept in orbit by the electrical attraction between the positive proton and the negative electron, just as the Earth is kept in orbit by the gravitational force between the Sun and the Earth. There was only one issue. Because the circling electron's orientation is continually changing, classical physics predicted that it would generate electromagnetic radiation —- light. As a result, the electron should be losing energy all the time. Physicists calculated that the electron would lose all of its energy and spiral down into the proton in less than 0.000000000001 second! To put it another way, atoms should not exist for more than 10-12 seconds. INACCURATE!!
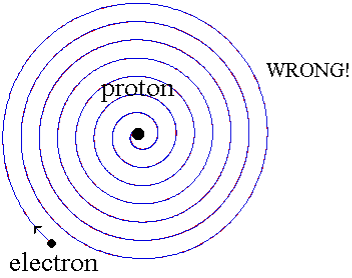
In 1913, Niels Bohr offered an explanation. The electron in the Bohr model of the hydrogen atom can't orbit the proton in any size orbit it wants. Only particular orbits are permitted, and each permitted orbit has a specific radius and energy. Bohr devised a formula for calculating the size and energy of each orbit. If you're interested, Bohr's rule stated that
2 x (electron mass) x (electron orbital speed) x (orbit radius) = (any integer) x h, which isn't really evident. (For the smallest orbit, the integer would be 1, for the following orbit out, and so on.) In order to explain why the hydrogen atom may last longer than 0.000000000001 second, Bohr devised a new criterion. According to him, when an electron is in an authorised orbit, it does not emit electromagnetic radiation. Bohr did not explain why; instead, he postulated a new natural law. Niels Bohr's theory was backed up by nature. His new hydrogen model produced wavelengths for hydrogen gas that were identical to what was measured.
Where does the light that comes from hydrogen come from if electrons do not create light while they are in their authorised stable orbits? According to Bohr, when electrons are in larger orbits, they have greater energy. An electron loses energy when it moves from a bigger to a smaller orbit. The energy lost by the electron must go somewhere, according to the rule of conservation of energy. A photon transfers away the lost energy from the hydrogen atom, according to Bohr.
(Electron energy in bigger orbit) - photon energy (electron energy in smaller orbit)
It works the other way, too. If a photon strikes an atom, the atom can absorb the photon and its energy if (and only if) the photon's energy is exactly equal to the difference between two orbital energies. In this case, an electron uses the photon's energy to jump from the smaller orbit up to the larger orbit. This is called a quantum jump.
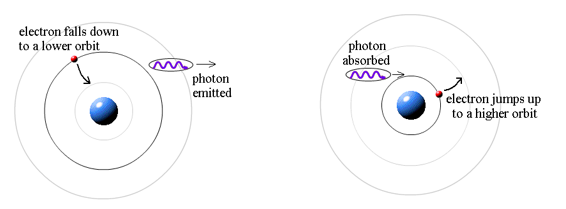
1.1.3 WAVES OR PARTICLES?
On a screen, light passing through a double-slit produces an interference pattern consisting of bright and dark bands. When the waves from one slit merge with the waves from the other slit, this occurs. When the crests of two waves meet on the screen, the waves combine to form a brilliant band. When a wave crest from one slit collides with a wave trough from the other, the waves cancel and a dark band result. This demonstrates that light is in fact a wave.
The photoelectric effect, on the other hand, reveals that light is made up of massless particles known as photons.
If you want to understand how light propagates and goes from one point to another, think of it as a wave. The wave characteristics of light must be used to describe how light travels from the double slits to the screen.
If you wish to understand how light interacts with matter, think of it as particles (photons). The particle characteristics of light must be used to describe how light interacts with electrons in a metal and how it ejects them from the metal's surface.
Light is said to have a wave-particle duality. Depending on the situation, it can behave like waves or particles (but not both at the same time).
Recalling the photoelectric effect, how can a photon (which has no mass) cause an electron to move? Even massless photons have momentum, according to Einstein's theory of relativity. For a massed particle, Newton defined momentum as (mass) x (velocity), but Einstein was able to establish that the momentum of a massless photon is determined by its wavelength:
The photon's momentum increases as the wavelength gets smaller.
Prince Louis de Broglie of France had an idea in 1923. Maybe everything in nature is governed by the wave-particle duality. Everything propagates like a wave, and everything interacts like a particle, according to him. De Broglie modified Einstein's formula for photon momentum and applied it to a mass particle:
We don't notice the wavelength of a thrown baseball, which is only about 10-35 metres, since Planck's constant, h, is so little! However, because an electron's mass is so little, its wavelength is around 10,000 times shorter than that of visible light. This is useful since electron-wave microscopes can see thousands of times more detail than light-wave microscopes!
Electrons were fed through a double slit and counted as they hit a screen, proving that they propagate like a wave. If the electrons had moved in a continuous stream, they would have simply piled up behind the two slits. They didn't, however. They displayed a double-slit interference pattern with bright and dark bars, precisely like light waves do. Without a doubt, electrons demonstrate nature's wave-particle duality. Every huge thing, in fact, demonstrates nature's wave-particle duality. It's just not evident on a grand scale in our daily lives.
1.1.4 The Problems with Classical Physics
By the late nineteenth century, the laws of physics were based on Mechanics and the law of Gravitation from Newton, Maxwell's equations describing Electricity and Magnetism, and on Statistical Mechanics describing the state of large collection of matter. Under most circumstances, these principles of physics accurately described nature; nonetheless, some measurements from the late 19th and early 20th centuries were difficult to comprehend. Quantum Mechanics and Special Relativity were developed in response to issues with classical physics.
Here are some of the issues that led to the development of Quantum Mechanics.
Black Body Radiation: Classical physics predicted that hot objects would instantly radiate away all their heat into electromagnetic waves. The calculation, which was based on Maxwell's equations and Statistical Mechanics, showed that the radiation rate went to infinity as the EM wavelength went to zero, The Ultraviolet Catastrophe''. Plank solved the problem by postulating that EM energy was emitted in quanta with
E = hv.
The Photoelectric Effect: When light was employed to knock electrons out of solids, the results were far from what Maxwell's equations predicted. If light is made up of particles with the energy Plank proposed, the measurements were simple to explain (for Einstein).
Classical physics anticipated that the atomic electrons orbiting the nucleus would radiate their energy away and spiral into the nucleus when Rutherford discovered that the positive charge in atoms was concentrated in a relatively small nucleus. Clearly, this did not occur. In contrast to classical physics assumptions, the energy radiated by atoms likewise came out in quantized proportions. The Bohr Atom proposed an angular momentum quantization rule for that yielded the correct answer for hydrogen, but it was later discovered to be incorrect because hydrogen's ground state has zero angular momentum. To explain the atomic energy spectra, a thorough understanding of quantum mechanics was required.
Compton Scattering: When light was scattered off electrons, it behaved like a particle but changed wave length; additional proof for light's particle nature and Plank's hypothesis.
Waves and Particles: Light was demonstrated to behave like a wave in diffraction tests, yet as a particle in experiments like the Photoelectric effect. Even though we can only detect an integer number of electrons, more harder diffraction experiments revealed that electrons (along with other particles) behave like a wave (or photons).
All of the following phenomena are explained by quantum mechanics, which involves a wave-particle duality. Quantum Mechanics fundamentally alters our knowledge of nature in this way. While conventional physics is deterministic, quantum mechanics is probabilistic. We can only anticipate the likelihood of a particle being discovered in a specific region of space.
Photons are particles that make up electromagnetic waves like light. Based on Plank's formula, Einstein hypothesised that the energy of light particles was related to their frequency.
E = hv
Quantum Mechanics' new theory is that the probability of each particle (as a function of position and time) is equal to the square of a probability amplitude function, and that these probability amplitudes obey a wave equation. This is similar to the situation in electromagnetism, where the energy density of the field is proportional to the square of the field, and thus the photon probability density is proportional to the square of the field, despite the fact that the field is made up of waves. In many ways, probability amplitudes are similar to the fields we know from electromagnetic.
DeBroglie assumed E = hv for photons and other particles and used Lorentz invariance (from special relativity) to derive the wavelength for particles like electrons.

The rest of wave mechanics was built around these ideas, giving a complete picture that could explain the above measurements and could be tested to very high accuracy, particularly in the hydrogen atom. We will spend several chapters exploring these ideas.
Unit - 1
Atomic Spectra and Models
Unit - 1
Atomic Spectra and Models
1.1.1 The inadequacy of Classical Mechanics is:
1] It is not valid in the atomic dimension range.
2] It was unable to explain the reported black body radiation spectra.
3] The diversity in metal and gas specific heats is also unaccounted for.
4] It was unable to explain the spectrum of black body radiation seen.
5] It was unable to explain the genesis of atoms' distinct spectra. This is because energy changes are always constant according to classical mechanics.
6] A huge number of phenomena could not be explained by classical mechanics. Photoelectric effect, Raman effect, and others are examples.
Quantum Mechanics arose from the weakness of Classical Mechanics.
1.1.2 THREE FAILURES OF CLASSICAL PHYSICS:
1. Blackbody Radiation
Light is emitted at all wavelengths by any object with a temperature greater than absolute zero. The light that comes from an object that is absolutely black (and so does not reflect any light) is known as blackbody radiation.
All wavelengths of light do not share the energy of blackbody radiation equally. The blackbody radiation spectrum (below) reveals that some wavelengths get more energy than others. Three spectra at three distinct temperatures are illustrated. (One of the curves represents the Sun's surface temperature, which is 5770 K.)
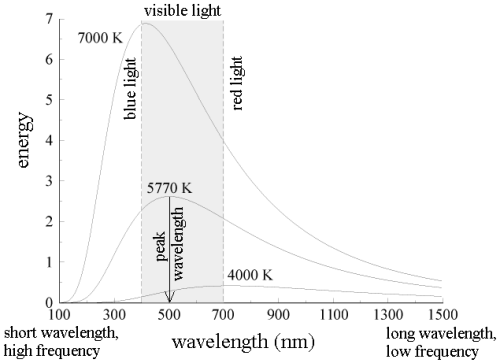
Here are some blackbody radiation experimental facts:
a. The blackbody spectrum is determined only by the object's temperature, not its composition. If their temperatures are the identical, an iron horseshoe, a ceramic vase, and a piece of charcoal will all radiate the same blackbody spectrum.
b. An object emits more blackbody energy at all wavelengths as its temperature rises.
c. As an object's temperature rises, the blackbody spectrum's peak wavelength becomes shorter (bluer). Blue stars, for example, are hotter than red stars.
d. The left-hand side of the blackbody spectrum is usually tiny (the short wavelength, high frequency side).
The explanation of classical physics: When an electric charge vibrates, it produces light, which is an electromagnetic wave. (The term "vibrates" refers to any change in the charge's motion, such as speeding up, slowing down, or changing direction.) Remember that heat is nothing more than the kinetic energy of random motion. Electrons vibrate in random directions in a heated object, producing light as a result. A hotter object produces more energetic vibrations, which results in more light being emitted —- it lights brighter. So far, everything has gone well. Classical physics, on the other hand, was unable to explain the form of the blackbody spectrum.
A heated object's electrons can vibrate at a variety of frequencies, from a few vibrations per second to thousands of vibrations per second. In reality, there is no limit to the frequency that can be used. According to classical physics, each vibration frequency should have the same energy. Because the frequency has no upper limit, the energy of the vibrating electrons at high frequencies has no upper limit. This indicates that, according to classical physics, the energy of light produced by electrons vibrating at high frequencies has no limit. The blackbody spectrum always becomes smaller on the left-hand side in experiments (short wavelength, high frequency).
Max Planck came up with the solution in 1900. He claimed that the traditional concept that each vibration frequency should have the same energy was incorrect. Instead, he claimed that electrons vibrating at various frequencies do not share energy evenly. Energy, according to Planck, arrives in clumps. A clump of energy was dubbed a quantum by him. The size of a clump of energy —- a quantum —- is determined by the vibration frequency. Planck's rule for a quantum of energy for a vibrating electron is as follows:
Quantum energy = (a calibration constant) x (frequency of vibration)
Or
Hf = E
The calibration constant, h, is now known as Planck's constant. It’s worth is approximately 6 x 10-34, which is quite small!
So, how does this explain the blackbody radiation spectrum? According to Planck, an electron vibrating at frequency f could only have an energy of 1 hf, 2 hf, 3 hf, 4 hf, and so on; that is, an electron vibrating at frequency f could only have an energy of 1 hf, 2 hf, 3 hf, 4 hf, and so on.
(Any integer) x hf = energy of a vibrating electron
If the electron is to vibrate, it must have at least one quantum of energy. If it doesn't have at least 1hf of energy, it won't vibrate and won't be able to create any light. Exclaimed Planck, "the amount of energy in a quantum, hf, is so great at high frequencies that the high-frequency vibrations can never get underway!" This is why the left-hand (high frequency) side of the blackbody spectrum is always narrow.
2. The Photoelectric Effect
When light shines on a metallic substance's surface, electrons in the metal absorb the light's energy and are able to escape through the metal's surface. The photoelectric effect is utilised to generate the electrical current that powers many solar-powered gadgets. Classical physicists predicted that when utilising very weak light, it would take some time for enough light energy to build up to eject an electron from a metallic surface, based on the assumption that light is a wave with energy spread uniformly across the wave. Experiments reveal that it doesn't matter how weak the light is if it can eject electrons from a metal if it has a specific frequency. There is no such thing as a time delay.
Albert Einstein came up with the solution in 1905. If Max Planck's theory of energy clumps (quanta) is right, light must be made up of a stream of clumps of energy. Einstein defined a photon as a clump of light energy with an energy equal to hf (Planck's constant multiplied by the frequency of the light). As a result, light energy is concentrated in photons rather than being distributed uniformly along the wave. A lower light intensity indicates fewer photons, yet lowering the light intensity (without changing the frequency) has no effect on the energy of individual photons. So, if a single photon has enough energy to eject one electron from a metallic surface for a given frequency light, electrons will always be ejected as soon as the light is turned on and the photons hit the metal.
3. The Hydrogen Atom
When a little hydrogen gas tube is heated, it glows and emits light. This light, unlike blackbody radiation from a heated dense solid or gas, has only a few colours (wavelengths): a red wavelength, a turquoise wavelength, and numerous violets. At the turn of the century, classical physicists assumed that because hydrogen is the simplest atom, they should be able to grasp it. A positively charged proton is at the heart of hydrogen, with a negatively charged electron surrounding it. The electron is kept in orbit by the electrical attraction between the positive proton and the negative electron, just as the Earth is kept in orbit by the gravitational force between the Sun and the Earth. There was only one issue. Because the circling electron's orientation is continually changing, classical physics predicted that it would generate electromagnetic radiation —- light. As a result, the electron should be losing energy all the time. Physicists calculated that the electron would lose all of its energy and spiral down into the proton in less than 0.000000000001 second! To put it another way, atoms should not exist for more than 10-12 seconds. INACCURATE!!
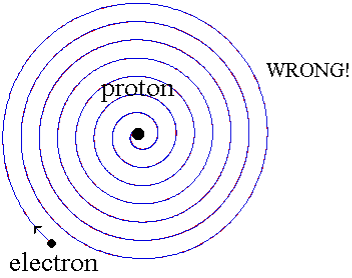
In 1913, Niels Bohr offered an explanation. The electron in the Bohr model of the hydrogen atom can't orbit the proton in any size orbit it wants. Only particular orbits are permitted, and each permitted orbit has a specific radius and energy. Bohr devised a formula for calculating the size and energy of each orbit. If you're interested, Bohr's rule stated that
2 x (electron mass) x (electron orbital speed) x (orbit radius) = (any integer) x h, which isn't really evident. (For the smallest orbit, the integer would be 1, for the following orbit out, and so on.) In order to explain why the hydrogen atom may last longer than 0.000000000001 second, Bohr devised a new criterion. According to him, when an electron is in an authorised orbit, it does not emit electromagnetic radiation. Bohr did not explain why; instead, he postulated a new natural law. Niels Bohr's theory was backed up by nature. His new hydrogen model produced wavelengths for hydrogen gas that were identical to what was measured.
Where does the light that comes from hydrogen come from if electrons do not create light while they are in their authorised stable orbits? According to Bohr, when electrons are in larger orbits, they have greater energy. An electron loses energy when it moves from a bigger to a smaller orbit. The energy lost by the electron must go somewhere, according to the rule of conservation of energy. A photon transfers away the lost energy from the hydrogen atom, according to Bohr.
(Electron energy in bigger orbit) - photon energy (electron energy in smaller orbit)
It works the other way, too. If a photon strikes an atom, the atom can absorb the photon and its energy if (and only if) the photon's energy is exactly equal to the difference between two orbital energies. In this case, an electron uses the photon's energy to jump from the smaller orbit up to the larger orbit. This is called a quantum jump.
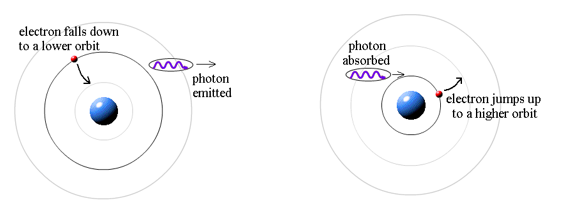
1.1.3 WAVES OR PARTICLES?
On a screen, light passing through a double-slit produces an interference pattern consisting of bright and dark bands. When the waves from one slit merge with the waves from the other slit, this occurs. When the crests of two waves meet on the screen, the waves combine to form a brilliant band. When a wave crest from one slit collides with a wave trough from the other, the waves cancel and a dark band result. This demonstrates that light is in fact a wave.
The photoelectric effect, on the other hand, reveals that light is made up of massless particles known as photons.
If you want to understand how light propagates and goes from one point to another, think of it as a wave. The wave characteristics of light must be used to describe how light travels from the double slits to the screen.
If you wish to understand how light interacts with matter, think of it as particles (photons). The particle characteristics of light must be used to describe how light interacts with electrons in a metal and how it ejects them from the metal's surface.
Light is said to have a wave-particle duality. Depending on the situation, it can behave like waves or particles (but not both at the same time).
Recalling the photoelectric effect, how can a photon (which has no mass) cause an electron to move? Even massless photons have momentum, according to Einstein's theory of relativity. For a massed particle, Newton defined momentum as (mass) x (velocity), but Einstein was able to establish that the momentum of a massless photon is determined by its wavelength:
The photon's momentum increases as the wavelength gets smaller.
Prince Louis de Broglie of France had an idea in 1923. Maybe everything in nature is governed by the wave-particle duality. Everything propagates like a wave, and everything interacts like a particle, according to him. De Broglie modified Einstein's formula for photon momentum and applied it to a mass particle:
We don't notice the wavelength of a thrown baseball, which is only about 10-35 metres, since Planck's constant, h, is so little! However, because an electron's mass is so little, its wavelength is around 10,000 times shorter than that of visible light. This is useful since electron-wave microscopes can see thousands of times more detail than light-wave microscopes!
Electrons were fed through a double slit and counted as they hit a screen, proving that they propagate like a wave. If the electrons had moved in a continuous stream, they would have simply piled up behind the two slits. They didn't, however. They displayed a double-slit interference pattern with bright and dark bars, precisely like light waves do. Without a doubt, electrons demonstrate nature's wave-particle duality. Every huge thing, in fact, demonstrates nature's wave-particle duality. It's just not evident on a grand scale in our daily lives.
1.1.4 The Problems with Classical Physics
By the late nineteenth century, the laws of physics were based on Mechanics and the law of Gravitation from Newton, Maxwell's equations describing Electricity and Magnetism, and on Statistical Mechanics describing the state of large collection of matter. Under most circumstances, these principles of physics accurately described nature; nonetheless, some measurements from the late 19th and early 20th centuries were difficult to comprehend. Quantum Mechanics and Special Relativity were developed in response to issues with classical physics.
Here are some of the issues that led to the development of Quantum Mechanics.
Black Body Radiation: Classical physics predicted that hot objects would instantly radiate away all their heat into electromagnetic waves. The calculation, which was based on Maxwell's equations and Statistical Mechanics, showed that the radiation rate went to infinity as the EM wavelength went to zero, The Ultraviolet Catastrophe''. Plank solved the problem by postulating that EM energy was emitted in quanta with
E = hv.
The Photoelectric Effect: When light was employed to knock electrons out of solids, the results were far from what Maxwell's equations predicted. If light is made up of particles with the energy Plank proposed, the measurements were simple to explain (for Einstein).
Classical physics anticipated that the atomic electrons orbiting the nucleus would radiate their energy away and spiral into the nucleus when Rutherford discovered that the positive charge in atoms was concentrated in a relatively small nucleus. Clearly, this did not occur. In contrast to classical physics assumptions, the energy radiated by atoms likewise came out in quantized proportions. The Bohr Atom proposed an angular momentum quantization rule for that yielded the correct answer for hydrogen, but it was later discovered to be incorrect because hydrogen's ground state has zero angular momentum. To explain the atomic energy spectra, a thorough understanding of quantum mechanics was required.
Compton Scattering: When light was scattered off electrons, it behaved like a particle but changed wave length; additional proof for light's particle nature and Plank's hypothesis.
Waves and Particles: Light was demonstrated to behave like a wave in diffraction tests, yet as a particle in experiments like the Photoelectric effect. Even though we can only detect an integer number of electrons, more harder diffraction experiments revealed that electrons (along with other particles) behave like a wave (or photons).
All of the following phenomena are explained by quantum mechanics, which involves a wave-particle duality. Quantum Mechanics fundamentally alters our knowledge of nature in this way. While conventional physics is deterministic, quantum mechanics is probabilistic. We can only anticipate the likelihood of a particle being discovered in a specific region of space.
Photons are particles that make up electromagnetic waves like light. Based on Plank's formula, Einstein hypothesised that the energy of light particles was related to their frequency.
E = hv
Quantum Mechanics' new theory is that the probability of each particle (as a function of position and time) is equal to the square of a probability amplitude function, and that these probability amplitudes obey a wave equation. This is similar to the situation in electromagnetism, where the energy density of the field is proportional to the square of the field, and thus the photon probability density is proportional to the square of the field, despite the fact that the field is made up of waves. In many ways, probability amplitudes are similar to the fields we know from electromagnetic.
DeBroglie assumed E = hv for photons and other particles and used Lorentz invariance (from special relativity) to derive the wavelength for particles like electrons.

The rest of wave mechanics was built around these ideas, giving a complete picture that could explain the above measurements and could be tested to very high accuracy, particularly in the hydrogen atom. We will spend several chapters exploring these ideas.
Now we'll look at another conundrum that physicists faced at the turn of the century (1900): how do hot bodies radiate? Heat was known to cause the molecules and atoms of a solid to vibrate, and the molecules and atoms were themselves intricate patterns of electrical charges, so the mechanism was well understood. (As usual, Newton was right on the money.) Maxwell's predictions that oscillating charges create electromagnetic radiation were confirmed, at least for basic antennas, by Hertz and others' experiments. The fact that this radiation travelled at the speed of light was discovered thanks to Maxwell's equations, and it was realised that light and the closely related infrared heat radiation were both electromagnetic waves. When a substance was heated, the resulting vibrations on a molecular and atomic scale unavoidably caused charge oscillations, according to the picture. Assuming that Maxwell's electromagnetic radiation theory, which worked so well in the macroscopic world, was also valid at the molecular level, these oscillating charges would radiate, presumably emitting the heat and light observed.
How is Radiation Absorbed?
What exactly does "black body" radiation imply? The argument is that the radiation emitted by a heated body is influenced by the body being heated to some amount. Let's take a step back for a moment and analyse how different materials absorb radiation. Some, such as glass, appear to absorb very little light and let it pass right through. A gleaming metallic surface does not absorb light; instead, it reflects it. Light and heat are almost fully absorbed by a black material like soot, and the material becomes warm. How can we explain these diverse behaviours in terms of light interacting with charges in the material, causing these charges to oscillate and absorb energy from the radiation? In the case of glass, this clearly does not occur, at least not frequently. What's to stop you? Quantum mechanics is required to fully comprehend why, but the fundamental notion is that there are charges—electrons—in glass that can oscillate in response to an applied external oscillating electric field, but these charges are strongly linked to atoms and can only oscillate at particular frequencies. (These charge oscillations occur as an electron jumps from one orbit to another, according to quantum experts.) Of course, in the 1890s, when the first precision work on black body radiation was being done, this was not understood.) Because none of these frequencies correlate to visible light in regular glass, there is no resonance with a light wave, and thus minimal energy is absorbed. As a result, glass is ideal for windows! That's a given. Glass, on the other hand, is opaque at frequencies outside the visual range (in general, both in the infrared and the ultraviolet). These are the natural oscillation frequencies of the electrical charge distributions in atoms or bonds.
How can we comprehend how a metal surface reflects light? Electrons in a piece of metal are free to move across the entire solid. This is what distinguishes a metal from other materials: it easily transmits both electricity and heat, which are conveyed by currents of freely moving electrons. (Well, vibrations do carry a small amount of heat.) Metals, on the other hand, are easily identifiable due to their lustrous appearance—why is that? Again, it's those free electrons: the electrical field of the incoming light wave drives them into enormous (compared to the atoms) oscillations, and this generated oscillating current radiates electromagnetically, exactly like a current in a transmitting antenna. The reflected light is the source of this radiation. Little of the incoming radiant energy is absorbed as heat by a polished metal surface; instead, it is reradiated, or reflected.
Consider a substance that absorbs light and does not transmit or reflect it. With soot, we're quite near to perfect absorption. It will conduct an electric current like a metal, but not nearly as effectively. Unattached electrons can flow across the entire solid, but they constantly collide with objects because they have a short mean free path. They create vibration when they bump, similar to balls hitting bumpers in a pinball machine, and hence release kinetic energy as heat. Although the electrons in soot have a shorter mean free path than those in a good metal, they travel far more freely than electrons attached to atoms (as in glass), allowing them to accelerate and absorb energy from the light wave's electric field. As a result, they are extremely efficient at converting energy from light waves to heat.
Relating Absorption and Emission
After seeing how soot absorbs radiation and converts it to heat, what about the other way around? When heated, why does it radiate? Imagine a pinball machine where the boundaries, etc., vibrate violently because they are supplied energy. At each collision, the balls (electrons) bouncing off them will accelerate suddenly, and these speeding charges will create electromagnetic waves. The electrons in a metal, on the other hand, have very long mean free pathways and are less affected by lattice vibrations, therefore they are less effective in collecting and radiating heat energy. It is clear from such considerations that good radiation absorbers are also good emitters.
In fact, we may be much more precise: a body emits radiation at a certain temperature and frequency in the same way that it absorbs it. Kirchhoff demonstrated this: if we assume a body can absorb better than it emits, then in a room full of objects all at the same temperature, it will absorb radiation from the other bodies better than it will radiate energy back to them. This means it will heat up as the rest of the room cools down, which is in direct violation of the second rule of thermodynamics. (With such a body, we could build a heat engine that extracts work as the room gets colder and colder!)
But why does a metal light when heated sufficiently? As the temperature rises, the atoms' lattice vibrates more and faster, scattering and speeding up the electrons. At high enough temperatures, even glass glows as the electrons loosen and vibrate.
The “Black Body” Spectrum: a Hole in the Oven
Any body that is above absolute zero will radiate to some extent, with the intensity and frequency distribution of the radiation varying depending on the body's detailed structure. To begin analysing heat radiation, we must first define the body that is radiating: the simplest feasible situation is an idealised entity that is a perfect absorber, and hence also a perfect emitter (based on the above logic). This is referred to as a "black body" for obvious reasons.
But we need to test our theories in the lab: how can we build a perfect absorber? OK, nothing is perfect, but Kirchhoff had a nice notion in 1859: any radiation that passes through a little hole in the side of a huge box bounces around inside, absorbing a lot of it on each bounce, and has little chance of ever getting out again. So, we can do it backwards: make an oven with a tiny hole on the side, and the radiation that comes out of the hole should be as close to a perfect emitter as we can get. Kirchhoff challenged theorists and experimentalists to calculate and measure the energy/frequency curve for this "cavity radiation," as he dubbed it (in German, of course: hohlraumstrahlung, where hohlraum means hollow room or cavity, strahlung is radiation). Kirchhoff's challenge in 1859, in fact, was the catalyst for quantum theory forty years later!
What Was Observed: Two Laws
Stefan's Law (1879) was the first quantitative conjecture based on experimental observation of hole radiation: the total power P radiated from one square metre of black surface at temperature T is proportional to the fourth power of the absolute temperature:
P=T4, =5.67108 watts/square meter/K4.
Boltzmann determined this T4 behaviour from theory five years later, in 1884: he used classical thermodynamic logic to apply to a box filled with electromagnetic radiation, utilising Maxwell's equations to relate pressure to energy density. (Of course, the minuscule quantity of energy escaping the hole would have the same temperature dependence as the intensity of the radiation inside.) Details of the derivation can be found in the appendices.
Wien's Law of Displacement (1893):
The frequency at which the emitted radiation is most strong varies with the oven temperature. The frequency is, in fact, directly related to the absolute temperature:
FmaxT is the maximum value of a function.
(This law was theoretically deduced by Wien in 1893, using Boltzmann's thermodynamic reasoning.) Langley, an American astronomer, had already observed it, at least semi-quantitatively.) The formula can be found in the appendices.
Indeed, everyone is aware with this upward shift in fmax with T: when an iron is burned in a fire, the initial visible radiation (at roughly 900K) is deep red, the lowest frequency visible light. At very high temperatures (10,000K or more), where the peak in radiation intensity has shifted beyond the visible into the ultraviolet, the hue changes to orange, yellow, and finally blue as T increases.
When it comes to harvesting solar energy, such as in a greenhouse, this shift in the frequency at which radiant power is at its peak is critical. The glass must allow solar radiation to pass through while blocking heat radiation. Because the two radiations have such distinct frequency ranges—5700K and, say, 300K—and because some materials are transparent to light but opaque to infrared radiation, this is possible. Only because fmax fluctuates with temperature do greenhouses work.
What Was Observed: the Complete Picture
By the 1890s, experimental techniques had advanced to the point where it was able to make reasonably precise measurements of the energy distribution in this cavity radiation, or black body radiation, as we'll call it. Wien and Lummer drilled a small hole in the side of an otherwise completely closed oven in 1895 at the University of Berlin, and began measuring the radiation that emerged.
The beam that emerged from the hole was passed through a diffraction grating, which transmitted the various wavelengths/frequencies in different directions, all of which were directed at a screen. The amount of radiant energy emitted in each frequency band was determined by moving a detector up and down the screen. (This is a theorist's model of the experiment; the actual experimental setup was far more complex.) For example, repeated reflections from quartz and other crystals were used to reduce higher frequency waves in order to make challenging infrared observations.) They discovered a radiation intensity/frequency curve that was nearly identical to this (correct one):
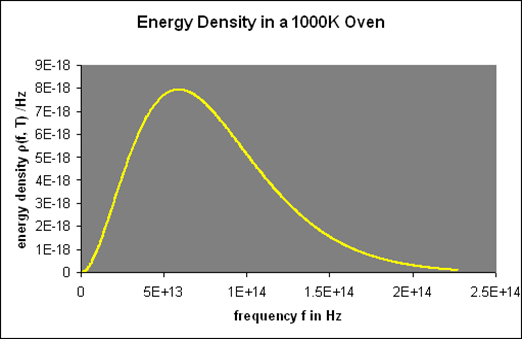
This oven glows bright red since the visible spectrum begins at roughly 4.31014 Hz.
One minor point: the energy density inside the oven is denoted by (f,T), which means that the energy in Joules/m3 in the frequency interval f,f+f is (f,T)f at temperature T.
Remember that the radiation within the oven contains waves going both directions, therefore only half of them will come out via the hole to locate the electricity pumped out. In addition, if the hole has area A, waves flowing in at an angle from the inside will view a smaller target area. As a result of these two influences, the
A=14Ac radiation power from a hole (f,T).
By analysing the black body curves at various temperatures, they were able to corroborate both Stefan's Law P=T4 and Wien's Displacement Law, for example:
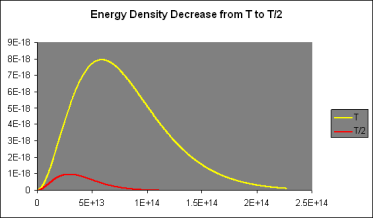
Let's take a closer look at these curves: For low frequencies, f, (f,T) was found to be proportional to f2, giving it a parabolic shape; however, as f grew beyond fmax, it fell below the parabola, peaking at fmax and then rapidly declining towards zero.
It was discovered that doubling the temperature doubled the strength of the radiation at low frequencies when (f,T) is parabolic. However, at 2T, the curve followed the doubled parabolic route for a significantly longer time before dropping away—in fact, twice as far, and fmax(2T)=2fmax (T).
The curve (f,2T) thus reaches eight times the height of the curve (f,1T) (f,T). (For further information, see the graph above.) It also spreads over twice the lateral extent, resulting in a sixteenfold rise in the area under the curve, which corresponds to the total energy radiated, when the temperature is doubled: P=T4 according to Stefan's Law.
Understanding the Black Body Curve
The key to a revolution was these exquisitely precise experimental data. Max Planck performed the first successful theoretical analysis of data in 1900. He focused on simulating the oscillating charges that must exist in the oven walls, radiating heat inwards while being driven by the radiation field in thermodynamic equilibrium.
The basic line is that he discovered he could account for the observed curve if he required these oscillators to lose or acquire energy in chunks, called quanta, of size hf for an oscillator of frequency f, rather than continuously, as the classical theory would require. The constant h is currently known as Planck's constant, with a value of 6.6261034 joulesec.
Planck computed the following formula for the radiation energy density within the oven based on this assumption:

The perfect agreement of this formula with exact observations, and the resulting need for energy quantization, was the most significant advancement in physics of the century.
But no one noticed for a long time! His black body curve was universally acknowledged as correct: more and more precise experiments proved it time and time again, but the quantum assumption's radical nature remained a mystery. Planck wasn't too bothered; he didn't believe it either, and he considered it as a technological remedy that would (he hoped) someday be obsolete.
Part of the problem was that Planck’s route to the formula was long, difficult and implausible—he even made contradictory assumptions at different stages, as Einstein pointed out later. But the result was right in any case, which is why we'll take a different, easier approach, which was started (but never completed) by Lord Rayleigh in England.
Rayleigh’s Sound Idea: Counting Standing Waves
Lord Rayleigh was taking a more direct approach to the radiation inside the oven in 1900, a few months before Planck's breakthrough work: he didn't even think about oscillators in the walls, he just took the radiation to be a collection of standing waves in a cubical enclosure: electromagnetic oscillators. These standing electromagnetic waves were absolutely clear, in contrast to the murky reality of the wall oscillators.
Rayleigh had solved an almost identical problem a quarter century before, an examination of stationary sound waves in a cubical room (page 267 of his book). The goal is to identify and count as many different standing waves as possible in the room/oven while staying within the boundary conditions. The amplitude of sound waves in a room decreases as they approach the walls. If the wall is a perfect conductor, the electric field parallel to it must go to zero for electromagnetic waves.
So, what are the standing waves that are permitted? Consider the several allowable modes of vibration, that is, standing waves, in a string of length a fixed at both ends as a warm-up exercise:
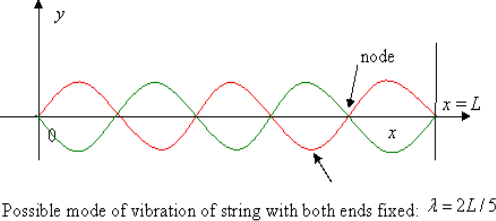
The possible values of wavelength are:
λ=2a, a, 2a/3, …
So the allowed frequencies are
f=c/λ=c/2a, 2(c/2a), 3(c/2a), …
These allowed frequencies are equally spaced c/2a apart. We define the spectral density by stating that
Number of modes between f and f+Δf=N(f)Δf
Where we assume that Δf is large compared with the spacing between successive frequencies. Evidently for this one-dimensional exercise N(f) is a constant equal to 2a/c, each mode corresponds to an integer point on the real axis in units c/2a.
The amplitude of oscillation as a function of time is:
y=Asin2πx/λsin2πft
More conveniently written
y=Asinkxsinωt, where k=2π/λ, ω=2πf, so ω=ck.
The allowed values of k (called the wave number) are:
k = 2π/λ = π/a, 2π/a, 3π/a, … f=ck/2π.
The generalization to three dimensions is simple: in a cubical box of side a, an allowed standing wave must satisfy the boundary conditions in all three directions. This means the choices of wave numbers are:
Kx = 2π/λx = π/a, 2π/a, 3π/a, …
Ky = 2π/λy = π/a, 2π/a, 3π/a,
Kz = 2π/λz = π/a, 2π/a, 3π/a, …
That is to say, each modes is labeled with three positive integers:

And the frequency of the mode is:
f = ck/2π = (c/2π) 
Frequency intervals measured experimentally for infrared and visible radiation in a moderately sized oven are significantly greater than the spacing c/2a of these integer points. These modes occupy the three-dimensional k -space uniformly, with density (a/)3, just as they did in the one-dimensional case, but now the mode density is not uniform as a function of frequency.
The volume in k-space, in units (/a)3, of the spherical shell of radius k=2f/c, thickness k=2f/c, and confined to all components of k being positive (like the integers), a factor of 1/8, is the number of them between f and f+f=N(f)f.
The density of states as a function of frequency in an oven of volume V=a3 is: Including a factor of 2 for the two polarisation states of the standing electromagnetic waves, the density of states as a function of frequency in an oven of volume V=a3 is:

Giving the density of radiation states in the oven

(This analyses' details can be found in the notes.) If you’re wondering why it’s OK to have an oven with essentially perfectly reflecting walls when we were previously insisting on absorbing walls, Kirchhoff proved long before that two such ovens at the same temperature will have the same radiation intensity—otherwise energy could be transferred from one to the other, violating the Second Law.)
What about Equipartition of Energy?
The energy equipartition is a key conclusion of classical statistical mechanics: for a system in thermal equilibrium, each degree of freedom has an average energy of 12kBT. (Boltzmann's constant is kB.) Thus molecules in a gas have average kinetic energy 32kBT, 12kBT for each direction, and a simple one-dimensional harmonic oscillator has total energy kBT: 12kBT kinetic energy and 12kBT potential energy.
Comparing now the formula for the number of modes N(f)Δf in a small interval Δf

With Planck’s formula for radiation energy intensity in the same interval:

For the low frequency modes hf≪kBT we can make the approximation

And it follows immediately that each mode has energy kBT, in line with classical predictions.
However, things go horribly wrong on a regular basis! The number of modes grows indefinitely, but the energy in these high-frequency modes decreases exponentially as the frequency rises. This was eventually termed the UV catastrophe by Ehrenfest. Rayleigh's sound strategy didn't appear to be that sound after all—something vital was lacking.
Planck never discussed equipartition, which is maybe unexpected. Of fact, as Rayleigh pointed out, equipartition was recognised to have issues, such as in the case of gas specific heat. In truth, Planck was unsure about the existence of atoms, writing subsequently that “I had been inclined to oppose atomism” in the 1890s (see notes). Even Boltzmann was unclear how successfully oscillators achieved thermal equilibrium with electromagnetic radiation—after all, it was well known that diatomic molecules oscillated with kinetic energy but did not achieve classical thermal equilibrium. (Maxwell observed that hot gases generate light at specific frequencies as early as 1877.) The oscillations must be simple harmonic because the frequencies do not change with temperature—but such an oscillator would surely be activated by collisions at low temperatures, so why wasn't energy delivered into this mode?)
Einstein Sees a Gas of Photons
As previously stated, there was a deafening hush on the matter for several years after Planck reported his result in December of 1900. No one, even Planck, grasped the significance of what he had accomplished—his work was widely regarded as merely a clever technical repair, despite the fact that it provided the correct answer (the curve itself was completely accepted as correct).
Then, in March of 1905, Albert Einstein became interested in the problem. He began by recalculating the Rayleigh result under the assumption of equipartition:

And observed that this made no sense at high frequencies. So he focused on Planck’s formula for high frequencies, hf≫kBT:

(Asymptotically identical for f→∞ to an earlier formula by Wien).
Einstein saw a parallel between this and the energy distribution in a classical gas.
Remember how the (normalised) probability distribution function for classical atoms as a function of speed v was in the previous lecture?

And the corresponding energy density in E is

The radiation formula at high frequencies is

If high frequency radiation is considered as a gas of independent particles with energy E=hf, Einstein pointed out that the energy density in frequency/energy in the radiation is

When compared to the expression for atoms, the analogy is close: remember that frequency is proportional to wave number and, after quantization, to momentum for radiation, and velocity is proportional to momentum for (nonrelativistic) atoms, so both these distributions are essentially in momentum space. Of course, the normalisation factors differ because, unlike total radiation, the total number of atoms does not change with temperature. Nonetheless, the analogy is convincing, leading Einstein to conclude that the radiation in the enclosure was quantized as well, rather than being a unique attribute of the wall oscillators, as Planck believed. Of course, the radiation quanta are photons, but that term wasn't coined until later.
Planck's derivation of his result had upset Einstein since it relied on a classical explanation of the interaction between the wall oscillator and radiation, followed by a declaration that the interaction was not at all like that. But the answer was correct, and Einstein was beginning to understand why. The electromagnetic standing wave oscillations in the oven, in contrast to the poorly known wall oscillators, were perfectly obvious.
Energy in an Oscillator as a Function of Temperature
The blackbody radiation curves have a straightforward interpretation in terms of Rayleigh's electromagnetic standing waves, according to Einstein: the average energy in an oscillator of frequency f at temperature T equals

Furthermore, Planck's work suggested that the material oscillators in the walls may be quantized in the same way.
The next step was taken by Einstein, who proposed that all oscillators, such as a vibrating atom in a solid, are quantized. This could explain why the Dulong Petit law, which gives 3kB of specific heat to each atom in a solid, fails at low temperatures: once kBThf, the modes are not activated and absorb little heat. As can be seen, the specific heat decreases. It also explains why diatomic gas molecules like oxygen and nitrogen don't seem to absorb heat into vibrational modes, which have a relatively low frequency.
Consider an oscillator in thermal equilibrium at temperature T and its continual energy exchange with the environment. The energy of random thermal fluctuations in a system is of order kBT, which is the amount of energy transmitted back and forth, roughly. However, if an oscillator has hf=5kBT, it can only take chunks of energy that are 5kBT in size, and will only be stimulated if five of these random kBT variations occur at the correct time and place. This minimum energy requirement essentially freezes out the high frequency modes. The exponential decrease off in excitation with frequency corresponds to the exponential decrease off in the likelihood of getting the proper number of fluctuations together, similar to the exponential drop off in the likelihood of flipping a coin n times in a row.
Simple Derivation of Planck’s Formula from the Boltzmann’s Distribution
Planck's formula was based on the assumption that the oscillators only exchange energy with the radiation in quanta hf. Standing electromagnetic waves, such as the radiation in an oven, have quantized energy, as Einstein demonstrated.
The likelihood of a system at temperature T containing energy E is proportional to eE/kBT, Boltzmann's formula, as covered in the last lecture. It turns out that this formula holds true in quantum systems as well. Now, at T, a classical simple harmonic oscillator will have a probability distribution proportional to, implying that the energy expectation value is

Just the classical equipartition of energy.
But we now know this isn’t true if the oscillator is quantized: the energies are now in steps hf apart. Taking the ground state as the zero of energy, allowed energies are0,hf, 2hf, 3hf…
And assuming the Boltzmann expression for relative probabilities is still correct, the relative probabilities of these states will be in the ratios:
e−hf/kBT, e−2hf/kBT, e−3hf/kBT…
To find the oscillator energy at this temperature, we use these probabilities weighted by the corresponding energy, and divide by a normalization factor to ensure that the probabilities add up to 1:


(The expression is evaluated as follows: write e−hf/kT=x, so the sum of the relative probabilities is 1+x+x2+x3+…=1/(1−x), and the numerator in the above expression for is hfx(1+2x+3x2+…)=hfx/(1−x)2, since the infinite series in parens is given by differentiating 1+x+x2+x3+… )
This is indeed the correct result from the black body experiments. Evidently Boltzmann’s relative probability function e−E/kBT is still valid in quantum systems.
A Note on Wien’s Displacement Law
Wien's Displacement Law is easily deduced from Planck's formula: the highest radiation per unit frequency range occurs at the frequency f for which the function f3/(ehf/kBT1) is at its maximum. Numerically, hfmax=2.82kBT is obtained.
The equation linking the frequency of maximum energy intensity in units of Joules/m3/Hz may be established theoretically (and is proven experimentally) as fmax=5.881010 T Hz/K.
The law is frequently expressed in terms of the wavelength at which the intensity, now measured in Joules/m3/m, or per unit interval of wavelength, and2.910-3 TmK is the maximum value.
The crucial thing to remember here is that these calculations do not produce the same result, as can be easily confirmed, because fmaxmax1.7108m/sec is not the same as the speed of light! Because the two measurements, per unit interval of frequency and per unit interval of wavelength, are distinct, a claim that, for example, sunlight is most intense in the yellow must explain which one is being utilised (actually it would be wavelength, frequency would give the near infrared).
An Excel spreadsheet was used to create the graphs of black body radiation as a function of temperature. You are invited to download and experiment with this spreadsheet to see how radiation varies with temperature. It's simple to use—all you have to do is enter the temperature and see the graph change.
Key takeaway:
1. We will regard the planets and stars (including the earth and the sun) to be blackbodies, despite the fact that a blackbody does not exist. A blackbody, according to the preceding description, will produce radiation in all portions of the electromagnetic spectrum, but we know from experience that it will not radiate in all wavelengths equally.
2. A blackbody is a physics term for a surface that absorbs all radiant radiation falling on it. The word comes from the fact that incident visible light is absorbed rather than reflected, making the surface appear black.
3. The blackbodies are utilised in applications such as lighting, heating, security, thermal imaging, and testing and measuring. The Planck Law of Radiation can be used to determine the intensity of energy at any temperature and wavelength.
1.3.1 Introduction: What is the photoelectric effect?
The photoelectric effect occurs when light shines on a metal and causes electrons to be expelled from the metal's surface. Photoemission is another name for this process, and photoelectrons are the electrons that are emitted from the metal. Photoelectrons behave and behave like other electrons in terms of behaviour and attributes. The prefix photo- merely indicates that incoming light has expelled electrons from a metal surface.
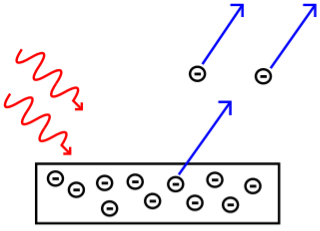
Fig. The photoelectric effect.
1.3.2 Predictions based on light as a wave
To explain the photoelectric effect, 19th-century physicists proposed that the incoming light wave's oscillating electric field heated the electrons, causing them to vibrate and eventually release them from the metal surface. This concept was founded on the idea that light travels across space solely as a wave. (For additional detail on light's fundamental qualities, see this article.) Scientists also believed that the light wave's energy was proportional to its brightness, which is connected to its amplitude. They conducted tests to examine the effect of light amplitude and frequency on the rate of electron ejection as well as the kinetic energy of photoelectrons in order to test their hypotheses.
They made the following predictions based on the classical description of light as a wave:
- The kinetic energy of released photoelectrons should increase as the light frequency increases, and the rate of electron emission, which is proportional to the measured electric current, should increase as well.
- We may compare a light wave to a water wave to better understand why they made these predictions. Consider some beach balls on a dock that stretches out into the sea. The dock is a metal surface, the beach balls are electrons, and the waves in the ocean are light waves.
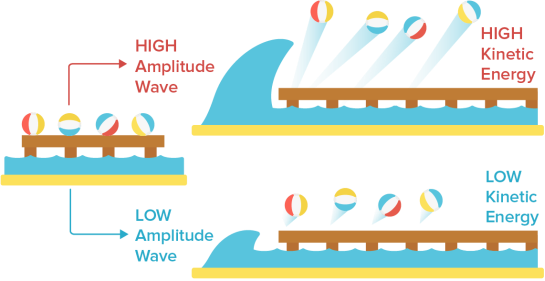
We would assume that if a single massive wave shook the dock, the energy from the enormous wave would send the beach balls flying off the pier with considerably more kinetic energy than a single, little wave. This is also what physicists predicted would happen if the intensity of the light was raised. Higher amplitude light was predicted to result in photoelectrons with more kinetic energy since light amplitude was proportional to light energy.
Classical physicists also predicted that increasing the frequency of light waves (while keeping the amplitude constant) would increase the rate of electron ejection, and therefore the measured electric current. Using our beach ball analogy, we would expect more beach balls to be knocked off the dock when waves of the same size strike the dock more frequently than waves of the same size striking the dock less frequently.
1.3.3 When intuition fails: photons to the rescue!
Experiments on the effect of light amplitude and frequency revealed the following findings: Photoelectrons' kinetic energy increases with light frequency, whereas electric current remains constant as light frequency increases.
The amplitude of light increases the electric current.
As the amplitude of light rises, the kinetic energy of photoelectrons remains constant.
These findings were diametrically opposed to predictions based on the traditional explanation of light as a wave! It turned out that an altogether new model of light was required to describe what was going on. That model was devised by Albert Einstein, who hypothesised that light may act as photons, which are electromagnetic energy particles. Planck's equation can be used to compute the energy of a photon:
Ephoton = hv
Where Ephoton is the photon's energy in joules h is Planck's constant (6.6261034 Js), and v is the light frequency in Hz. The energy of a photon is proportional to the frequency of light, according to Planck's equation. The number of photons with a specific frequency determines the amplitude of the light.
1.3.4 Applications
Photoelectric devices have a number of advantages, including creating a current that is precisely proportional to light intensity and having a very fast response time. The photoelectric cell, often known as a photodiode, is a simple device. This was originally a phototube, a vacuum tube with a metal cathode with a tiny work function that allowed electrons to be easily emitted. An anode held at a large positive voltage compared to the cathode would collect the current produced by the plate. Phototubes have been phased out in favour of semiconductor-based photodiodes, which can detect light, quantify its intensity, operate other devices in response to illumination, and convert light to electrical energy. These devices operate at low voltages, similar to their bandgaps, and are utilised in a variety of applications including industrial process control, pollution monitoring, light detection in fibre optic telecommunications networks, solar cells, imaging, and many more.
Semiconductors with bandgaps that correspond to the photon energy to be sensed make up photoconductive cells. Photographic exposure metres and automatic street lighting switches, for example, function in the visible spectrum and are often constructed of cadmium sulphide. Lead sulphide or mercury cadmium telluride can be used to make infrared detectors, such as night-vision sensors.
A semiconductor p-n junction is commonly used in photovoltaic devices. Solar cells are typically built of crystalline silicon and convert approximately 15% of incident light energy into electricity. Solar cells are frequently utilised in specialised contexts such as space satellites and remote telephone sites to produce very tiny amounts of power. Solar power may become economically viable for large-scale applications when cheaper materials and higher efficiency become available.
The photomultiplier tube is a very sensitive extension of the phototube, which contains a sequence of metal plates called dynodes and was first created in the 1930s. When light strikes the cathode, electrons are released. These are drawn to the first dynode, where they release more electrons, which then strike the second, and so on. The photocurrent is boosted so much after up to ten dynode stages that some photomultipliers can almost detect a single photon. In spectroscopic research, where it is frequently necessary to monitor extremely faint light sources, these devices, or solid-state counterparts of comparable sensitivity, are important. They're also employed in scintillation counters, which have a substance that creates light flashes when X-rays or gamma rays strike it, as well as a photomultiplier that counts and measures the strength of the flashes. These counters are employed for things like recognising certain isotopes for nuclear tracer analysis and detecting X-rays in computerised axial tomography (CAT) scans, which show a cross section of the body.
Photomultipliers and photodiodes are also used in image technologies. The fact that the electron emission from each place on a cathode is dictated by the number of photons arriving at that location is used in light amplifiers or image intensifiers, television camera tubes, and image-storage tubes. On the other side of a semitransparent cathode, an optical image falling on one side is translated into an analogous "electron current" image. The electrons are then focused onto a phosphor screen using electric and magnetic forces. Each electron striking the phosphor causes a flash of light, causing a cascade of electrons to be released from the cathode directly opposite the phosphor. The resulting intensified image can be displayed or stored after going through the same process to get even more amplification.
The examination of electrons emitted by X-rays at higher photon energies provides information about electronic transitions between energy levels in atoms and molecules. Because released electrons carry a specific energy that is distinctive of the atomic source, it also aids to the study of certain nuclear processes and plays a role in the chemical examination of materials. The Compton effect is also used to investigate material properties, and in astronomy, it is utilised to investigate cosmic gamma rays.
1.3.5 Dilemma
Light can be used to push electrons away from a solid's surface if the conditions are appropriate. The photoelectric effect (or photoelectric emission or photoemission) is a phenomena that occurs when electrons are ejected from a substance that is photoemissive. The ejected electrons are termed photoelectrons, though there is nothing that distinguishes them from other electrons. In terms of mass, charge, spin, and magnetic moment, all electrons are similar.
Heinrich Hertz discovered the photoelectric effect in 1887 while conducting tests with a spark gap generator (the earliest device that could be called a radio). Sparks generated between two small metal spheres in a transmitter cause sparks to bounce between two distinct metal spheres in a receiver in these studies. The spark gap generator was infamously difficult to deal with when compared to later radio equipment. For a receiver to reliably recreate the transmitter's spark, the air gap would frequently have to be less than a millimetre. Hertz discovered that exposing his spark gap device with visible or ultraviolet light increased its sensitivity. J.J. Thomson's later research revealed that the heightened sensitivity was due to light pushing on electrons, a particle he discovered in 1897.
While this is intriguing, it isn't really remarkable. All forms of electromagnetic radiation transfer energy, and it's easy to envisage this energy being used to drive tiny negative charge particles loose from the surface of a metal where they weren't all that tightly contained to begin with. However, the modern physics age is characterised by entirely unexpected and incomprehensible discoveries. The photoelectric effect was studied further, and the results contradicted the classical idea of electromagnetic radiation. Light didn't behave the way it was meant to when it came into contact with electrons. In principle, repairing this tear would necessitate more than simply a patch. It necessitated rewriting a significant amount of physics from the ground up.
Philipp Lenard, Hertz's assistant, was the one who carried out the first, definitive research of the photoelectric effect. Lenard used metal surfaces that were first cleaned and then held under vacuum so that the effect could be evaluated without being influenced by impurities or oxidation on the surface. A second metal plate was put at the other end of an evacuated glass tube containing the metal sample. The tube was then positioned or limited in some way so that only the first metal plate — the one constructed of the photoemissive substance under examination — received light. A photocell or an electric eye is the formal name for such a tube (informally). As illustrated in the schematic design below, Lenard linked his photocell to a circuit that included a variable power source, voltmeter, and microampmeter. He then used light of various frequencies and intensities to illuminate the photoemissive surface.
The photoemissive plate would get a little positive charge if electrons were knocked free. Because the wiring of the circuit connected the second plate to the first, it became positive as well, attracting the photoelectrons floating freely through the vacuum, where they would land and return to the plate from where they originated. Keep in mind that this experiment does not use light to make electrons; rather, it uses light's energy to push electrons that are already there around the circuit. Although the photoelectric current created by this method was modest, it could be measured using a microammeter (a sensitive galvanometer with a maximum deflection of only a few microamps). It also serves as a gauge for the pace at which photoelectrons leave the photoemissive material's surface.
Take note of how the power supply is linked to the circuit, with the negative end attached to the non-illuminated plate. The photoelectrons are then pushed back into the photoemissive surface by a potential difference. When the power supply is set to a low voltage, the least energetic electrons are trapped, resulting in a reduction in current through the microammeter. As the voltage is increased, more and more energetic electrons are driven back, until none can leave the metal surface and the microammeter reads zero. The stopping potential is the point at which this happens. It's a measurement of the electrons' maximum kinetic energy emitted as a result of the photoelectric effect.
The maximum kinetic energy of the photoelectrons was discovered to be unaffected by the intensity of the incident light, according to Lenard. Those who were ejected from a very bright light had the same amount of energy as those who were ejected from a very dim light of the same frequency. However, in accordance with the rule of conservation of energy, a bright source ejected more electrons than a dark source.
Others' tests, most notably that of American physicist Robert Millikan in 1914, discovered that light with frequencies below a particular cutoff value, known as the threshold frequency, would not release photoelectrons from a metal surface, regardless of how intense the source was. These results came as a complete shock. Given that light can transport electrons and that the energy in a beam of light is proportional to its intensity, classical physics would predict that a more intense beam of light, regardless of frequency, will release electrons with greater energy than a less intense beam. However, this was not the case.
Photoelectrons are not ejected by red light (even if it is very bright).
Photoelectrons are ejected by green light (even if it is very dim).
Photoelectrons ejected by blue light have greater energy than photoelectrons ejected by green light (even if it is very dim).
Actually, these outcomes may not be entirely normal. Most elements have ultraviolet threshold frequencies, and only a few, like the example above, dip low enough to be green or yellow. Semiconductors are the materials having the lowest threshold frequencies. The infrared part of the spectrum has threshold frequencies for some.
Light is described as a transverse electromagnetic wave in the classical model. There was little doubt about this by the end of the nineteenth century. When it was effectively employed to explain optical phenomena including diffraction, interference, polarisation, reflection, and refraction, the wave character of light was verified. If we can successfully visualise light as waves in an electromagnetic ocean, then we shouldn't have too much trouble visualising electrons in a metal surface as tethered buoys floating in an electromagnetic harbour. The waves (light) arrive, pulling and tugging at the buoys (electrons). Strong waves can rip a buoy from its mooring and send it adrift. Instead of the energy-frequency relationship indicated above, a wave model of light would predict an energy-amplitude relationship. Photoelectric experiments depict an electromagnetic ocean in which massive swells would not topple a canoe over, but tiny ripples would launch you into the air.
Not only that, but the photoelectrons appear to jump out of the surface far too soon. The rate at which energy is transferred to the surface is sluggish when light intensity are very low. It should take a long time for any one electron to collect enough of this dispersed energy to become free. It ought to work, but it doesn't. When light of the right frequency and intensity contacts a photoemissive surface, at least one electron always pops out (t 109 s). Using the ocean as an example, imagine a harbour filled of little boats (electrons). Except for a few small waves on the surface, the sea seems tranquil (low intensity, short wavelength light). The majority of the boats in the harbour are untouched by the waves, but one is ripped off the dock and launched into the sky like a jet. Something isn't quite right in this place. Light, unlike mechanical waves, behaves in this manner.
1.3.6 New idea
The frequency of incident radiation and the material on the surface are the two factors that influence the maximum kinetic energy of photoelectrons. Above the threshold, electron energy grows in a straightforward linear fashion, as seen in the graph below. The energy-frequency relationship is constant for all materials because all three curves have the same slope (Planck's constant). Photoemission does not occur below the threshold frequency. The energy axis has a distinct intercept for each curve, indicating that threshold frequency is a function of the material.
Albert Einstein, the world's most famous physicist, was the genius who worked out what was going on here. In 1905, Einstein observed that light behaved as if it were made up of small particles called quanta, which were later renamed photons, and that each particle's energy was proportional to the frequency of the electromagnetic radiation it was a part of. Remember from the last section of this book that Max Planck developed the concept of quantized electromagnetic radiation to solve a technical difficulty involving idealised electromagnetic radiation sources known as blackbodies. Remember that, contrary to his mathematical analysis, Planck did not believe that radiation was truly divided up into small bits. He assumed the whole event was a set-up to provide him with the correct answers. Einstein's brilliance lay in his recognition that Planck's concoction was, in fact, a plausible description of reality. We perceive electromagnetic radiation as a continuous wave, but it is actually a stream of distinct particles.
1.3.7 Equations
Einstein and Millikan described the photoelectric effect using a formula (in contemporary notation) that relates the maximum kinetic energy (Kmax) of the photoelectrons to the frequency of the absorbed photons (f) and the threshold frequency (f0) of the photoemissive surface.
Kmax = h(f − f0)
Or if you prefer, to the energy of the absorbed photons (E) and the work function (φ) of the surface
Kmax = E − φ
Where the first term is the energy of the absorbed photons (E) with frequency (f) or wavelength (λ)
E = hf = | Hc |
λ |
And the second term is the work function (φ) of the surface with threshold frequency (f0) or threshold wavelength (λ0)
φ = hf0 = | Hc |
λ0 |
The maximum kinetic energy (Kmax) of the photoelectrons (with charge e) can be determined from the stopping potential (V0).
V0 = | W | = | Kmax |
q | e |
Thus
Kmax = eV0
When charge (e) is given in coulombs, the energy will be calculated in joules. When charge (e) is given in elementary charges, the energy will be calculated in electron volts. This results in a lot of constants. Use the one that's most appropriate for your problem.
| SI units | Acceptable |
h | 6.63 × 10⁻³⁴ J s | 4.14 × 10⁻¹⁵ eV s |
Hc | 1.99 × 10⁻²⁵ J m | 1240 eV nm |
● Planck's constant with variations | ||
Lastly, the rate (n/t) at which photoelectrons (with charge e) are emitted from a photoemissive surface can be determined from the photoelectric current (I).
I = q/t |
| = ne/t |
|
|
|
Thus…
| n/t = I/e |
|
|
|
1.3.8 Technology
- "Electric eye," "light metre," and "movie film audio track" are some of the terms used.
- A nonmetallic solid's electrical conductivity increases when it is subjected to electromagnetic radiation, which is known as photoconductivity. The addition of free electrons liberated by collisions with photons results in an increase in conductivity. The quantity of the rise is determined by the pace at which free electrons are generated and the time they remain free.
- Photovoltaics: instead of going through a vacuum to an anode, the expelled electron goes through the emitting material to reach a solid electrode in contact with the photoemitter, resulting in direct conversion of radiant energy to electric energy photostatic duplication
Key Takeaway:
1. When a specific "threshold frequency" of light is incident on a metal surface. Iii — "When photoelectric materials absorb light with a high enough frequency, they produce electrons."
2. According to Einstein's renowned photoelectric effect explanation, the photon's energy is the sum of the energy required to remove the electron and the kinetic energy of the expelled electron. As a result, h nu= W + E.
3. This is how the photoelectric effect works. When a metal is exposed to high-energy light, electrons are emitted from the metal. No electrons are emitted by light below a specific threshold frequency, no matter how bright it is. Interactions with photons allow electrons to gain energy.
1.4.1 What is Compton Effect?
The Compton effect is the phenomenon that occurs when x-rays or gamma rays are scattered on a substance with increasing wavelength. In the year 1922, Arthur Compton investigated this phenomenon. Compton discovered that wavelength is unaffected by incident radiation intensity during his research. It is determined by the scattering angle as well as the wavelength of the incident beam. It is expressed mathematically as follows:
What is the location?
The angle at which light is scattered
m0: an electron's rest mass
h/m0c : The electron's Compton wavelength
The peaks of the radiation spectrum are denoted by the letters s and 0.
1.4.2 Derivation of Compton effect equation
Considering the elastic collide between a photon and an electron, following is the derivation:
hν0 : energy of photon
Pi=hν0/c :momentum of the photon
Pi=pfcosΘ+pecosϕ(1) (conservation of momentum in x direction)
0=−pfsinΘ+pesinϕ(2) (conservation of momentum in y direction)


Therefore, above is the Compton effect equation andhm0c≡λc is Compton wavelength of an electron.
1.4.3 Difference Between Compton Effect and Photoelectric Effect
Compton effect | Photoelectric effect |
This is the result of high-energy photons being bound to free electrons dispersing inelastically. | When electromagnetic radiation interacts with electrons, weakly bound electrons are expelled from the surface of the material, causing this effect. |
The effect was explained by Arthur Compton. | The effect was explained by Albert Einstein. |
The free electrons have a mid-energy level of energy. | The electrons have a low-energy associated with them. |
The dispersed photon has a longer wavelength than the incident photon. | The photon vanishes after interacting with the electrons, therefore the wavelength isn't visible. |
1.5.1 Important Topics Covering Dual Nature of Matter
Here are some of the most crucial points to remember while working with this concept.
Electronic Emission
The free electrons can be supplied with the lowest energy required to emit an electron from a metal's surface using one of the techniques listed below:
- Thermionic Emission: The required thermal energy is delivered to the free electrons by appropriately heating the metal to allow them to exit.
- Field Emission: Electrons are held under a strong electric field in order to emit electrons from the metal.
- Photo-electric Emission: Electrons are emitted from a metal surface when it is illuminated by light of the suitable frequency. Photoelectrons are electrons that are created by light.
Photoelectric Effect
The photoelectric effect is a phenomena in which electrons escape from a material's surface. The material's surface is usually made up of both positive and negative ions. When light is incident on a metal surface, some of the electrons near the surface absorb enough energy from the incident radiation to overcome the pull of the positive ions. Furthermore, after the electrons have accumulated enough energy, they will escape from the metal surface and into the surrounding vacuum. The Photoelectric Effect is founded on this.
The following are some terms that are related:
- The minimal energy necessary to expel an electron from a metal surface is known as the work function.
- The minimal frequency of light that can compel an electron to emit from a metal surface is called the threshold frequency.
- Threshold Wavelength: The longest wavelength of light capable of ejecting a photoelectron from a metal's surface.
- If, Work Function is denoted by Ɵ, Threshold Frequency by f, and Threshold Wavelength by ƛ; then we have Ɵ = hf =hc/ ƛ; where h is Planck’s Constant. E = hf
Concepts to understand:
Cut-off or Stopping Potential is the minimal negative or retarding potential V0 applied to a plate for which photoelectric current becomes zero.
For a fixed incidence frequency, the effect of incident light intensity is linear with photoelectric current, as shown in Figure.
The effect of potential on photoelectric current is that it rises with increasing potential supplied to the collector for a fixed frequency and intensity of incident light, eventually reaching its maximum current, which is known as Saturation Current.
1.5.2 Wave-Particle Duality
Early in the argument over whether light is made up of particles or waves, it was discovered that electrons have a wave-particle dual nature as well. When the photoelectric effect offered firm evidence of a particle nature, the evidence for the depiction of light as waves was well established at the turn of the century. The particle properties of electrons, on the other hand, were clearly documented when the DeBroglie hypothesis and subsequent investigations by Davisson and Germer revealed the electron's wave nature.
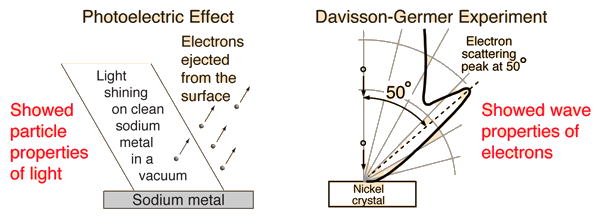
1.5.3 The Photoelectric Effect
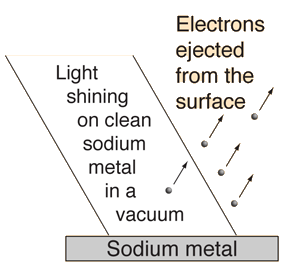
The details of the photoelectric effect were in direct contradiction to the expectations of very well developed classical physics.
The explanation marked one of the major steps toward quantum theory.The remarkable aspects of the photoelectric effect when it was first observed were:
1. The electrons were emitted immediately - no time lag!
2. Increasing the intensity of the light increased the number of photoelectrons, but not their maximum kinetic energy!
3. Red light will not cause the ejection of electrons, no matter what the intensity!
4. A weak violet light will eject only a few electrons, but their maximum kinetic energies are greater than those for intense light of longer wavelengths!
1.5.4 Wave-Particle Duality: Light
Does light consist of particles or waves? When one focuses upon the different types of phenomena observed with light, a strong case can be built for a wave picture:

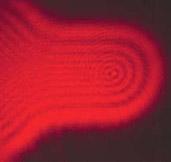
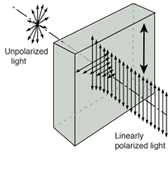
Fig. Interference Diffraction Polarization
Phenomenon | Can be explained in | Can be explained in |
Reflection |  |  |
Refraction |  |  |
Interference |  |  |
Diffraction |  |  |
Polarization |  |  |
Photoelectric effect |  |  |
Waves can explain the majority of regularly observed light phenomena. However, the photoelectric effect suggested that light has a particle nature. Then electrons were discovered to have multiple natures as well.
There is a lot of debate in the literature concerning whether light reflection and refraction can be represented in particle terms at an interface when the medium changes. Treating light as a wave phenomenon is sufficient for practical geometrical optics applications.
Newton's corpuscular theory: Light, according to Newton, is made up of corpuscles that travel in straight lines. Because the bouncing of particles or waves off a planar surface follows the same law of reflection, this worked great for reflection. However, he had to assume that the particles travelled quicker in a more optically dense substance to explain refraction. However, Foucault's 1850 experiment revealed that light travels more slowly through such material, requiring that version of the particle theory of light to be abandoned.
Huygens wave theory: Presuming that light was composed of waves, in 1678 Huygens proposed that each point of a light wavefront could be considered to be the source of a spherical wave. Huygens' idea aided in the development of light wave theory, which was further expanded by Fresnel and Kirchhoff.
Quantum view of light: On the quantum scale of atoms, the photoelectric effect provided proof that light has particle qualities. At the very least, light can localise enough energy to dislodge an electron off a metal surface. So, though a particle treatment of refraction of light may be indicated, the wave view of light is the practical approach in common optics.
1.5.5 Heisenberg’s Uncertainty Principle
According to Heisenberg's Uncertainty Principle, a particle's momentum and position cannot be determined at the same time.
It can be stated mathematically as x P (h / 4) where x represents position uncertainty and P represents momentum uncertainty.
1.5.6 Planck’s Quantum Theory
When heat is applied to a black body, distinct wavelengths or frequencies of thermal radiation are emitted. As a result, Max Planck proposed Planck's Quantum Theory to explain these radiations. The following are some of the theory's primary points:
- Energy is absorbed or radiated in a discontinuous manner by substances. This procedure is carried out in little packets.
- The above-mentioned process occurs in whole-number quantum multiples such as hf, 2hf, 3hf......nhfs, where n is a positive integer.
- Quantum energy is the tiniest packet of energy. In the case of light, it is referred to as a photon.
- The energy of a Quantum is related to the frequency of its radiation.
1.5.7 Electron Under An Electric Field
Consider an electron of mass m, with a charge q being accelerated through a potential V from rest. The kinetic energy K of the electron equals the work done on it by the electric field which equals to qV.
K = qV = ½ mv2 = P2/2m
P = √ 2mK = √ 2mqV
The de Broglie wavelength ƛ of the electron is given by;
ƛ = h / P = h / √2mK = h / √2mqV
Substituting the numerical values of h, m and e; we have ƛ=1.227/ nm; where V is the magnitude of accelerating potential in Volts.
1.5.8 Davisson And Germer Experiment
The Davisson and Germer Experiment established the wave nature of electrons and confirmed the de Broglie equation for the first time. The findings proved quantum mechanics for the first time in an experiment.
The Davisson and Germer Experiment is contained within a vacuum chamber. As a result, electron deflections and scattering by the medium are avoided. The following are the main components:
Electron Gun: Electrons are emitted from a Tungsten filament via thermionic emission.
Electrostatic Particle Accelerator: The electrons are accelerated at a known potential using two oppositely charged plates.
Collimator: The accelerator is encased in a cylinder with a narrow beam for the electrons running parallel to its axis.
The electron beam is fired over a Nickel crystal as the target.
The scattered electrons from the Ni Crystal are captured by the detector.
1.6.1 Definition:
An electron's spectrum of electromagnetic radiation released or absorbed as it moves between different energy levels within an atom.
When an electron moves from one energy level to the next, it emits or absorbs light of a given wavelength. The atomic spectra of atoms is the collection of all these unique wavelengths of the atom in a certain set of variables such as pressure, temperature, and so on. Emission spectra, absorption spectra, and continuous spectra are the three forms of atomic spectra.
1.6.2 Spectral Series of Hydrogen Atom
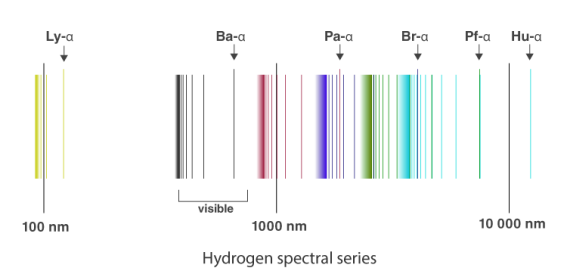
The atomic hydrogen emission spectrum is divided into a number of spectral lines with wavelengths determined by the Rydberg formula, as seen in the image above. The atomic transitions between different energy levels cause the observed spectral lines in the hydrogen emission spectrum. In astronomical spectroscopy, spectral series are crucial.
1.6.3 Continuous Spectrum
A continuous spectrum is exemplified by a rainbow. The colours used here are from the visible spectrum (between 380-760 nm). This wavelength range can be seen with the naked eye. Light of diverse wavelengths (see the electromagnetic spectrum below) is not visible, unlike light with the same wavelength. Take note of the varied zones of light in Figure 4.2.1. (or electromagnetic spectrum). On the left side of the spectrum are areas of light with short wavelengths. All wavelengths between UV (ultraviolet) and gamma (gamma) have the ability to ionise tissues and/or DNA. As a result, people who have been exposed to high doses of these forms of radiation over a short period of time may acquire cancer. Visible light (see the rainbow area in Figure 4.2.1) and radiation on the right side of the spectrum, on the other hand, has longer wavelengths and cannot ionise tissues or DNA. Nonionizing radiation includes visible, infrared (designated IR), microwave, and radio waves, which have not been related to cancer. It contains various frequencies (cycle/time) and wavelengths.
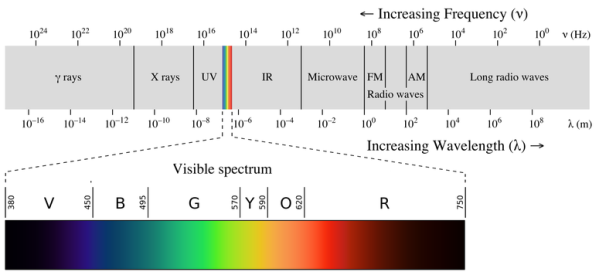
Please be mindful of the difference between ionising and nonionizing light. Do not memorise the electromagnetic spectrum's wavelengths or frequencies. The electromagnetic spectrum is an example of a continuous spectrum, which you should be aware of.
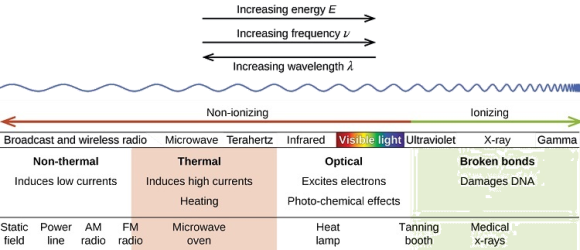
1.6.4 Atomic Emission Spectra
An atom's electrons tend to be grouped in such a way that the atom's energy is as low as possible. The lowest energy state of an atom is called the ground state. When energy is delivered to those atoms, the electrons absorb it and travel to a higher energy level. These electron energy levels in atoms are quantized, which means the electron must go from one energy level to the next in discrete stages rather than constantly. An atom's excited state is one in which its potential energy is higher than its ground state. The excited state of an atom is unstable. When it returns to the ground state, it releases the energy it had gained in the form of electromagnetic radiation that it had previously gained (although it can be released via heat).
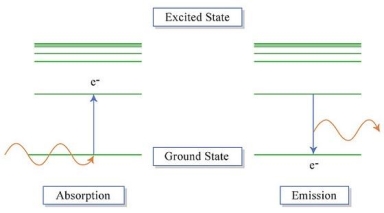
Atoms can obtain energy from a variety of sources to effect these changes. Electrical current has been used to stimulate the gases in the image below. Each noble gas's atoms produce various colours that can be used to identify the elements. Each of these species has a different number of electrons that can be excited in different ways. Each gas, in turn, produces a distinct colour.

Flames can also be used to excite atoms. Metal chlorides are directly thrown into a flame during a flame test experiment. The metal's electrons will be promoted to an excited state by the tremendous heat. This excess energy is released in the form of visible light when it is emitted. The flame colour can be utilised to identify a metal atom if a reference panel is available (Table).
Table: Flame colors corresponding to elements | ||||
Metal Ion | Flame Color |
| Metal Ion | Flame Color |
Li | Red |
| K | Light Purple |
Na | Orange |
| Ba | Light Green |
Ca | Orange-Red |
| Cu | Blue |
Sr | Red |
|
|
|
Experiments with flames are akin to fireworks. For these devices, fireworks producers choose specific metal atoms to produce desired colours. Individual detonators will detonate the metal compounds, releasing a rainbow of colours. On December 31, 2017, the world's largest aerial firework shell exploded over the United Arab Emirates, as seen in the video below. Compare the colours you see in the video to the chart above to figure out which atoms were used in the display.
1.6.5 Discontinous Spectra
Individual patterns of lines will appear if the light generated by the excited atoms is examined through a prism. These lines are known as spectra, and they correspond to a certain element's fingerprint wavelengths (the symbol for wavelength is λ). The light from excited electrons can be diffracted to generate line spectra for the elements hydrogen, helium, and iron, as shown in Figure. The specific elements create visible wavelengths (between 400 and 700 nm) that can be seen with the naked eye. One would need to use some sort of detector to get the numerical wavelengths (in nanometers).
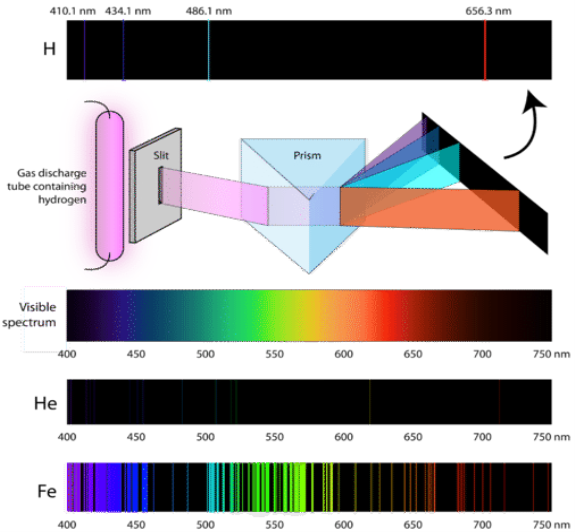
Figure: Light from a hydrogen gas discharge tube is split into four visible lines when it passes through a prism. Each spectral line represents an electron transition from a higher to a lower energy state. As the examples of helium (He)(He) and iron (Fe) indicate, each element has its own atomic emission spectrum (Fe).
1.6.6 Atomic Absorption Spectra
Chemists will utilise atomic absorption to identify and quantify in addition to emission investigations. Chemists can create another form of discontinuous spectrum by noting the energy shifts from ground to excited states (see image below). A fingerprint wavelength pattern is created once more, which can be used to identify an atom. Academia and Industry could employ either an AA (atomic absorption) or AE (atomic emission) spectrometer to analyze the atoms within a sample.
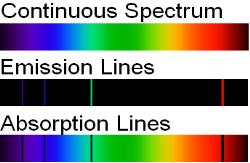
Figure: Spectral lines.
1.6.7 A Featureless Spectrum: Blackbody Radiation
Any item with a temperature higher than absolute zero will radiate energy as light. If you had a perfectly black box with a given temperature and monitored the intensity of light at various photon energies, you'd get a Blackbody Spectrum. This is significant because astronomical objects like as stars can often be treated as near-perfect blackbody emitters. As a result, we can model the continuum emission on which the absorption spectra are observed. This means that, in addition to observing a distant star's chemical composition, we can also measure its temperature near its surface.
The Blackbody Spectrum Simulator was created by the teaching department of the University of Colorado. Click the download button, and then open the downloaded file in your browser to see the applet, as seen below.
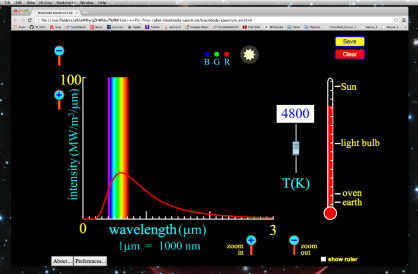
Let's talk about what we're seeing in the plot. The x-axis shows the wavelength of light emitted, while the y-axis shows the intensity, or strength, of blackbody radiation emission at a specific wavelength. Take note of the units! Almost always, blackbody radiation is expressed as energy per unit surface area of the item. On the x-axis, at the actual wavelengths of visible light, there is a rainbow.
You can adjust the temperature using the slide-bar to the left of the right-hand thermometer, or type a temperature (in Kelvin) into the white box above the slide-bar.
We can now click the "display ruler" option in the simulator's bottom-right corner. This displays a ruler, as shown below, that allows us to measure the height of the intensity at a specific wavelength of light. The scale of the ruler does not change when you use the zoom in or zoom out buttons. As a result, you won't be able to zoom in or out when examining the relative strength of a specific wavelength of light being radiated.
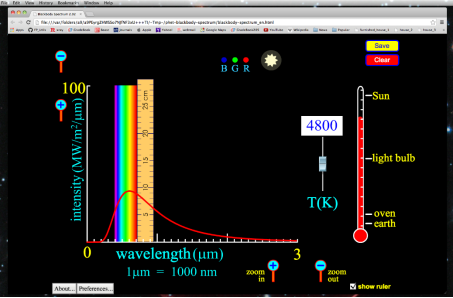
Key Takeaway:
There is an intimate connection between the atomic structure of an atom and its spectral characteristics.
1.7.1 What is Hydrogen spectrum?
The hydrogen spectrum is a crucial piece of evidence for demonstrating an atom's quantized electronic structure. When an electric discharge is conducted across a gaseous hydrogen molecule, the hydrogen atoms in the molecule dissociate. The energetically excited hydrogen atoms emit electromagnetic radiation as a result of this process. The hydrogen emission spectrum is made up of discrete frequency radiation. These radiation series bear the names of the scientists who discovered them.
The spectral lines of the hydrogen atomic emission spectrum are explained by Bohr's hypothesis. The energy of an atom's electron remains unaltered while it is in the ground state. The electron jumps from the ground state orbit to a more distant excited state orbit when the atom absorbs one or more quanta of energy. The variable n is used to identify energy levels. n = 1 is the ground state, n = 2 is the first excited state, and so on. The difference in energy between the two energy levels is equal to the energy obtained by the atom. When the atom relaxes back to a lower energy state, energy equal to the difference in energy between the two orbits is released (see Figure 1).
According to the equation E = hv, the change in energy, E, causes light of a specific frequency to be emitted. Remember that the atomic emission spectrum of hydrogen has four different frequency spectral lines? The finding that electron orbits are not evenly spaced is explained in the Bohr model. The spacing between the levels gets narrower and smaller as the energy travels further away from the nucleus.
Bohr was able to calculate the energies that the hydrogen electron would have in each of its permissible energy levels using the wavelengths of the spectral lines. The energy level transitions that corresponded to the spectral lines in the atomic emission spectrum were then mathematically demonstrated (Figure).
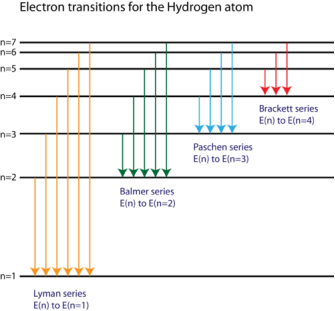
Figure. The electron energy level diagram for the hydrogen atom.
He discovered that the four visible spectral lines correlated to transitions from higher to lower energy levels (n = 2). The Balmer series is what it's named. The Lyman series refers to transitions that finish in the ground state (n = 1), but the energy released are so high that the spectral lines are all in the ultraviolet part of the spectrum. Because the energies are too small, the transitions known as the Paschen series and the Brackett series both produce spectral lines in the infrared region.
Bohr's concept was a huge achievement in understanding the hydrogen atom's spectrum. Unfortunately, when the model's mathematics were applied to atoms containing more than one electron, the frequencies of the spectral lines were incorrectly predicted. While Bohr's model was a significant step forward in atomic theory, and the concept of electron transitions between energy levels is still relevant, further work was required to completely comprehend all atoms and their chemical activity.
1.7.2 Emission Spectrum of Hydrogen:
A glass tube containing hydrogen gas at low pressure emits blue light when an electric current is sent through it. Four narrow bands of bright light against a black backdrop can be seen when this light is transmitted through a prism (as illustrated in the figure below).
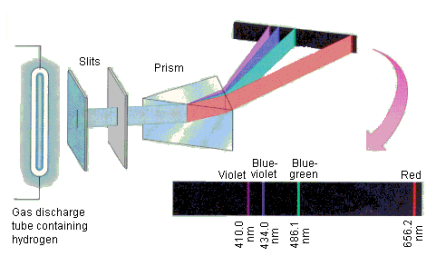
These narrow bands have the characteristic wavelengths and colors shown in the table below.
Wavelength |
|
| Color |
|
|
656.2 |
|
| Red |
|
|
486.1 |
|
| Blue-green |
|
|
434.0 |
|
| Blue-violet |
|
|
410.1 |
|
| Violet |
|
|
By examining the infrared spectrum at longer wavelengths and the ultraviolet spectrum at shorter wavelengths, four new series of lines in the hydrogen emission spectrum were uncovered. Each of these lines matches the same general equation, with numbers n1 and n2 and RH of 1.09678 x 10⁻² nm-1.

1.7.3 Explanation of the Emission Spectrum:
A theoretical explanation of the spectrum of radiation released by a glowing object was offered by Max Planck. He proposed that the walls of a glowing solid may be visualised as a set of resonators oscillating at various frequencies. These resonators absorb energy from the object's walls in the form of heat and release it in the form of electromagnetic radiation. At any given time, the energy of these resonators is proportional to the frequency with which they vibrate.
Planck had to postulate that the energy of these oscillators could only take on a restricted number of values in order to suit the observed spectrum. To put it another way, the energy spectrum for these oscillators was no longer continuous. These oscillators are theoretically "countable" since the number of possible energy levels is restricted. As a result, the energy of the oscillators in this system is quantized. To explain how light was emitted, Planck created the concept of quantization.
Planck's work was extended by Albert Einstein to include the light that had been emitted. Einstein proposed that light acted like a stream of little bundles, or packets, of energy, at a time when everyone accepted that light was a wave (and thus continuous). To put it another way, light was quantized as well. Einstein's model was predicated on two premises. To begin, he assumed that light was made up of photons, which are small, distinct energy bundles. He also assumed that a photon's energy is related to its frequency.
E = hv
In this equation, h is a constant known as Planck's constant, which is equal to 6.626 x 10⁻³⁴ J-s.
Calculate the energy of a single photon of red light with a wavelength of 700.0 nm and a mole of these photons as an example.
The frequency of red light with a wavelength of 700.0 nm is 4.283 x 10¹⁴ s-1. When this frequency is substituted into the Planck-Einstein equation, the following conclusion is obtained.
E = ( 6.626 × 10⁻³⁴ J-s)( 4.283 × 10¹⁴s-1) = 2.838 × 10⁻¹⁹ J
A single photon of red light carries an insignificant amount of energy. But a mole of these photons carries about 171,000 joules of energy, or 171 kJ/mol.

A mole of red light absorbed would thus give enough energy to raise the temperature of a litre of water by more than 40 degrees Celsius.
Because hydrogen atoms can only produce or absorb radiation at a restricted number of frequencies, they can only absorb radiation with a restricted range of energies. This indicates that the hydrogen atom contains a finite number of energy levels. These energy levels can be measured. The hydrogen atom's energy levels are quantized.
1.8.1 Principle:
It is feasible to detect pairs of spectral lines that have the property that the total of their wavenumbers is also an observable spectral line, according to the Rydberg-Ritz combination principle (Rydberg 1890, Ritz 1908)
When we understand that spectra are caused by transitions between energy levels, this idea becomes evident. An atom can either decay immediately from state 2 to ground state 0 or in two phases (21) and (10). Because E=hf, energy is conserved, the two frequencies (wave numbers) of the second route add to the frequency of the first.
In 1913, Niels Bohr showed this for the hydrogen atom,
E=13.6 eV/n2
We have
fnm = 13.6(1/n2 − 1/m2)
Similarly,
fml = 13.6(1/m2 − 1/l2)
Hence
fnm+fml = 13.6(1/n2 − 1/m2) +13.6(1/m2 − 1/l2) = 13.6(1/n2 − 1/l2) =fnl
1.8.2 Formula:
The Rydberg formula is a mathematical formula that may be used to calculate the wavelength of light emitted by an electron travelling between an atom's energy levels. The energy of an electron changes when it moves from one atomic orbital to another. A photon of light is produced when an electron moves from a high-energy orbital to a lower-energy orbital. When an electron transitions from a low-energy to a higher-energy state, a photon of light is absorbed by the atom. The Rydberg Formula is used to describe the spectra of various elements and is written as

Where,
n1 and n2 are integers and n2 is always greater than n1.
R is constant, called Rydberg constant and formula is usually written as

The modern value of Rydberg constant is known as 109677.57 cm-1 and it is the most accurate physical constant.

Key takeaway:
1. The Ritz wavelengths are the wavelengths generated from the transitions' lower and upper levels. They are only available if both transition levels are known. They are usually more precise than observed wavelengths if they are available, especially in the vacuum ultraviolet spectral area.
2. The Rydberg constant is not a universal constant. Its value is determined by the atomic number.
1.9.1 The Gold Foil Experiment
Rutherford, together with associates Hans Geiger and Ernest Marsden, began a series of revolutionary experiments in 1911 that would totally alter the accepted conception of the atom. They used fast moving alpha particles to assault very thin sheets of gold foil. Alpha particles are positively charged particles having a mass four times that of a hydrogen atom. They are a form of natural radioactive particle.
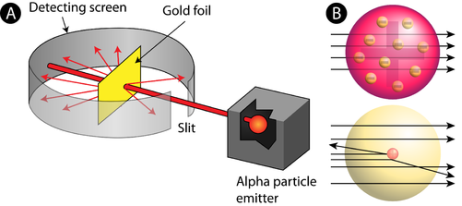
Figure: (A) The Rutherford gold foil experiment's experimental setup: A radioactive element that released alpha particles was aimed toward a thin sheet of gold foil surrounded by a screen that allowed the deflected particles to be detected. (B) All of the alpha particles should have passed through the gold foil with little or no deflection, according to the plum pudding model (top). Rutherford discovered that a small percentage of alpha particles were deflected at huge angles, which might be explained by an atom with a dense, positively charged nucleus at its centre (bottom).
The scientists expected all of the alpha particles to pass through the gold foil with only a tiny deflection or none at all, based on the recognised atomic model, in which an atom's mass and charge are uniformly distributed throughout the atom. Surprisingly, while the vast majority of alpha particles were undeflected, a small number (about 1 in 8000 particles) bounced off the gold foil at extreme angles. Some of the traffic was even rerouted back to the source. They had no prior awareness of what they were about to find. It was "as though you shot a 15-inch [artillery] shell at a piece of tissue paper and it came back and hit you," Rutherford cried in a famous quotation.
To explain his findings, Rutherford needed to create an altogether new model of the atom. He reasoned that most of the atom was empty space because the great majority of the alpha particles had passed through the gold. The particles that were highly deflected, on the other hand, must have been subjected to an enormously intense force within the atom. He came to the conclusion that the majority of the atom's mass and positive charge must be concentrated in a very small place within the atom's interior, which he named the nucleus. Protons and neutrons make up the nucleus, which is the atom's tiny, dense centre core.
The nuclear model was named after Rutherford's atomic model. Protons and neutrons, which make up virtually all of the mass of the nuclear atom, are found in the nucleus, which lies at the centre of the atom. The electrons are dispersed around the nucleus and take up the majority of the atom's volume. It's important to note how small the nucleus is in comparison to the remainder of the atom. The nucleus of an atom would be around the size of a marble if it were blown up to the size of a huge professional football stadium.
Rutherford's model was a crucial step toward a complete understanding of the atom. It did not, however, fully explain the nature of electrons and how they filled the huge area surrounding the nucleus. It took several years for a complete understanding of the electron to emerge. This proved to be the key to comprehending elemental chemical characteristics.
1.9.2 Rutherford's Scattering Experiment
Rutherford's model of an atom:
Ernest Rutherford was fascinated by the arrangement of electrons within an atom. For this, Rutherford devised an experiment. Fast moving alpha ()-particles were created to fall on a thin gold foil in this experiment.
- He used gold foil because he wanted the layer to be as thin as possible. The thickness of this gold foil was around 1000 atoms.
- Particles are helium ions with two charges. The fast-moving -particles have a lot of energy since they have a mass of four.
- The sub-atomic particles in gold atoms were expected to deflect -particles. He didn't anticipate to detect substantial deflections because the -particles were much heavier than the protons. The -particle scattering experiment, on the other hand, yielded completely unexpected findings.
Observations of Rutherford's scattering experiment:
As we can see in Fig.
- Most of the fast moving α-particles passed straight through the gold foil.
- Some of the α-particles were deflected by the foil by small angles.
- Surprisingly one out of every 12,000 alpha particles appeared to rebound.
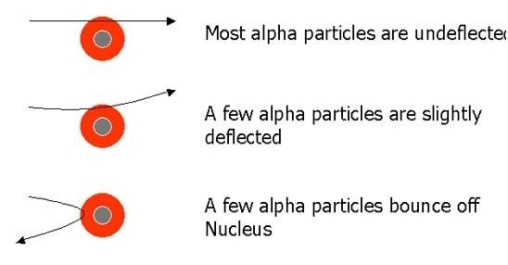
Conclusion of Rutherford's scattering experiment:
1. Because most -particles travelled through the gold foil without being deflected, most of the space inside the atom is unoccupied.
2. Only a few particles were deflected from their intended route, implying that the atom's positive charge takes up relatively little space.
3. Only a small percentage of -particles were deflected by significant angles, implying that the gold atom's positive charge and mass were concentrated in a limited volume within the atom.
He also computed that the radius of the nucleus is around 105 times smaller than the radius of the atom based on the data.
1.9.3 Rutherford's Nuclear Model Of Atom
On the basis of his experiment, Rutherford put forward the model of an atom, which had the following features:
1. Each atom has a nucleus, which is a positively charged centre. The nucleus contains nearly all of an atom's mass.
2. Electrons move in well-defined orbits around the nucleus.
3. In comparison to the size of the atom, the nucleus is quite small.
The presence of a nucleus in the atom is demonstrated by Rutherford's alpha particle scattering experiment.
It also gives the following important information about the nucleus of an atom:
1. An atom's nucleus is positively charged.
2. An atom's nucleus is extremely dense and rigid.
3. The nucleus of an atom is quite small in comparison to the overall size of the atom.
The Rutherford atom model is also known as the Nuclear atom model.
1.10.1 Rutherford model
The Rutherford model, also known as the Rutherford atomic model, nuclear atom, or planetary model of the atom, is a description of atom structure developed by Ernest Rutherford, a New Zealand-born scientist, in 1911. The model depicted the atom as a small, compact, positively charged centre called a nucleus, in which nearly all of the mass is concentrated, and around which the light, negative constituents known as electrons circle at a distance, similar to planets rotating around the Sun.
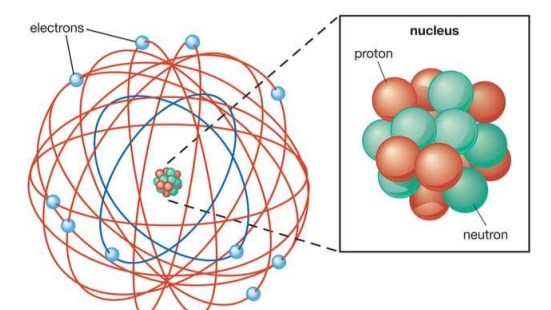
1.10.2 Rutherford atomic model
The atom, according to physicist Ernest Rutherford, is a miniature solar system with electrons orbiting a heavy nucleus and essentially empty space, with the nucleus occupying only a small proportion of the atom. When Rutherford suggested his concept, which featured a nucleus made entirely of protons, the neutron had not yet been identified.
To account for the scattering of alpha particles from thin gold foil reported in a series of experiments conducted by undergraduate Ernest Marsden under the direction of Rutherford and German scientist Hans Geiger in 1909, the nucleus was proposed as small and dense. Within a protective lead shield, a radioactive source generating alpha particles (positively charged particles equivalent to the helium atom nucleus and 7,000 times more heavy than electrons) was contained. After passing through a slit in a lead screen, the radiation was focussed into a narrow beam. To detect alpha particles, a thin section of gold foil was placed in front of the slit, and a screen coated with zinc sulphide to make it luminous acted as a counter. Each alpha particle created a scintillation when it hit the fluorescent screen, which was seen through a viewing microscope mounted to the rear of the screen. Rutherford and his colleagues were able to move the screen around to see if any alpha particles were being deflected by the gold foil.
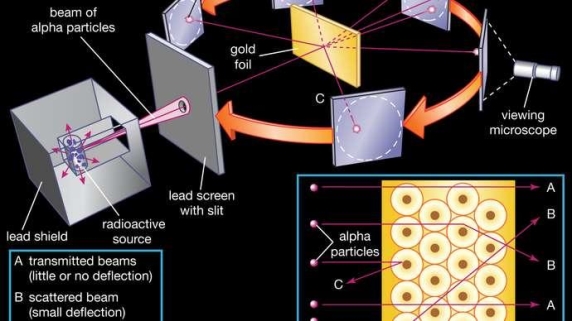
1.10.3 What are the limitations of Rutherford’s model of the atom?
Rutherford conducted an experiment in which he bombarded a thin sheet of gold with -particles and then analysed the trajectory of the particles after they collided with the gold foil.
Conclusions from the experiment
The following are the results of Rutherford's experiment:
- The majority of space in an atom is empty The space occupied by the positive charge is minuscule
- The atom's positive charges and mass were concentrated in a small space within the atom.
- The nucleus is the atom's central component.
- Electrons spin in a circular motion around the nucleus.
1.10.4 Limitations
The limitations of Rutherford's experiment are listed below.
- Rutherford's model was insufficient to explain the stability of an atom since it ignored the arrangement of electrons in orbit.
- According to Rutherford's idea, electrons travel in a circular path around the nucleus. However, particles travelling in a circular direction experience acceleration, and acceleration causes charged particles to emit energy. Electrons should eventually lose energy and fall into the nucleus.
Key takeaway:
1. The nucleus, which is located at the centre of the atom, contains the entire mass of the atom. The nucleus of an atom contains positively charged particles. The charge on an atom's nucleus is equal to (+z.e), where Z is the charge number and e is the proton charge.
2. In 1911, he was the first to discover that atoms contain a small charged nucleus surrounded by mostly empty space and surrounded by tiny electrons, resulting in the Rutherford model (or planetary model) of the atom.
1.11.1 Bohr’s Model of the Hydrogen Atom:
In terms of atomic structure, Bohr's model of the hydrogen atom is the first to correctly explain the radiation spectra of atomic hydrogen. The model holds a unique place in physics history since it introduced an early quantum theory, which sparked new scientific thought and eventually led to the development of quantum mechanics. To grasp the details of Bohr's model, it's necessary to first review the nineteenth-century discoveries that led to its creation.
Using a prism to investigate white light from the sun, we may see various dark lines in the solar spectrum ((Figure)). Fraunhofer lines are named after Joseph von Fraunhofer, who properly calculated the wavelengths of solar absorption lines. Gustav Kirchhoff and Robert Bunsen found that the line emission spectra of a chemical element exactly matches its line absorption spectrum between 1854 and 1861. The distinction between the absorption and emission spectra is described in (Figure). When light passes through a gas, it produces an absorption spectrum. On the background of the continuous spectrum of white light, this spectrum appears as black lines that only exist at certain wavelengths ((Figure)). The wavelengths that are lacking indicate which wavelengths of radiation are absorbed by the gas. When a gas emits light, the emission spectrum is detected. Colorful lines on a dark backdrop represent the spectrum (see (Figure) and (Figure)). The positions of the emission lines reveal the wavelengths of radiation the gas emits. Each chemical element emits a distinct spectrum of light. The positions of each element's emission lines are identical to the positions of its absorption lines. This means that atoms of a certain element absorb only specified wavelengths of radiation, and that radiation that does not have these wavelengths is not absorbed at all. This also means that the wavelengths of the radiation emitted by each element's atoms are identical to the wavelengths of the energy they absorb.
In the solar emission spectrum in the visible range from 380 nm to 710 nm, Fraunhofer lines are observed as vertical black lines at specific spectral positions in the continuous spectrum. Thousands of similar lines are detected by highly sensitive contemporary devices.

Line spectra observation: (a) absorption lines are observed; (b) emission lines are observed. (a) White light travels through a glass flask containing a chilly gas. The wavelengths of the passing light are separated using a prism. Some wavelengths in the spectrum of the passing light are missing, resulting in black absorption lines in the continuous spectrum on the viewing screen. (b) A gas is held in a glass discharge tube with electrodes on both ends. The gas glows when there is a large potential difference between the electrodes, and the light it emits passes through the prism that separates its wavelengths. Only specified wavelengths are present in the emitted light's spectrum, which are visible on the screen as multicoloured emission lines.
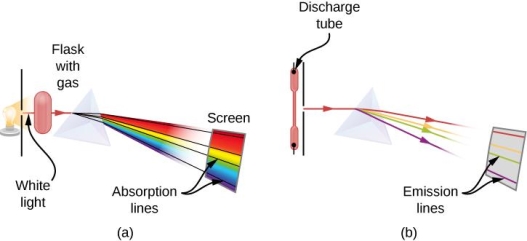
The emission spectrum of atomic hydrogen: The spectral positions of emission lines are characteristic for hydrogen atoms.

The emission spectrum of atomic iron: The spectral positions of emission lines are characteristic for iron atoms.

Emission spectra of elements feature complicated structures, which become even more complex as the atomic number of the element increases. The hydrogen atom has the simplest spectrum, as seen in (Figure). Only four lines may be seen with the naked eye. These lines are read from right to left in (Figure): red (656 nm), often known as the H- line; aqua (486 nm), blue (434 nm), and violet (434 nm) (410 nm). Lines with wavelengths less than 400 nm are visible to the naked eye and appear in the ultraviolet section of the spectrum (Figure, far left). In the series for hydrogen, there exists an unlimited number of invisible spectral lines.
Johann Balmer derived an empirical formula to characterise the locations (wavelengths) of the hydrogen emission lines in this series in 1885. The Balmer formula is as follows:

The constant  is called the Rydberg constant for hydrogen. In (Figure), the positive integer n takes on values
  for the four visible lines in this series. The series of emission lines given by the Balmer formula is called the Balmer series for hydrogen. Other emission lines of hydrogen that were discovered in the twentieth century are described by the Rydberg formula, which summarizes all of the experimental data:

The Lyman series is a set of spectral lines that exists when n f=1. The series is known as the Balmer series when n f=2, and the Rydberg formula agrees with the Balmer formula in this instance. The series is known as the Paschen series when n f=3. The series is known as the Brackett series when n f=4. The series is known as the Pfund series when n f=5. The Humphreys series appears when n f=6. Because n f can be any positive integer value, there are infinitely many such spectral bands in the spectrum of hydrogen.
The Rydberg formula for hydrogen yields the exact positions of the spectral lines as observed in a laboratory; yet, no one could explain why it worked so well at the turn of the twentieth century. Until 1913, when the first successful model of the hydrogen atom was proposed, the Rydberg formula remained unsolved.
-particles were impacted on a thin gold foil and scattered by gold atoms inside the foil in the Rutherford gold foil experiment (also known as the Geiger–Marsden experiment) (see Types of Collisions). A 360 scintillation screen surrounding the gold target detected the outgoing particles (for a detailed description of the experimental setup, see Linear Momentum and Collisions). A brief flash of light (scintillation) was noticed at the area where a scattered particle collided with the screen. The scientists were able to identify what percent of the incident particles were dispersed and what percent were not deflected at all by measuring the scintillations detected at various angles with regard to the direction of the incident beam. There would be no back-scattered -particles if the plum pudding model was right. The Rutherford experiment, on the other hand, revealed that, while a considerable portion of -particles came out the foil not dispersed at all, as if the foil had no effect on them, a considerable fraction of -particles were back-scattered toward the source. Only when the majority of the mass and the full positive charge of the gold atom were concentrated in a narrow region inside the atom was this kind of result conceivable.
Rutherford proposed the nuclear model of the atom in 1911. In Rutherford's conception, an atom had a positively charged nucleus that was almost the size of a point but held almost all of the atom's mass. Negative electrons were also present in the atom, although they were situated relatively far from the nucleus. Rutherford invented the terms proton and neutron to describe the nucleus of hydrogen and a hypothetical electrically neutral particle that would mediate the binding of positive protons in the nucleus ten years later (the neutron was discovered in 1932 by James Chadwick). The atomic nucleus was discovered by Rutherford, however the Rutherford model of atomic structure does not explain the Rydberg formula for hydrogen emission lines.
Niels Bohr proposed the Bohr model of the hydrogen atom in 1913, and it was the first quantum model to correctly explain the hydrogen emission spectrum. The quantum concept of photons is combined with the classical mechanics of planetary motion in Bohr's model. Bohr's intuition that the negative electron in the hydrogen atom must circle around the positive nucleus became a logical consequence of the inverse-square-distance law of electrostatic attraction after Rutherford demonstrated the existence of the atomic nucleus. Remember that Coulomb's law, which describes the attraction between two opposite charges, is analogous to Newton's universal law of gravitation in that both the gravitational and electrostatic forces decrease as 1/r2, where r is the distance between the bodies. The negative electron in the hydrogen atom can rotate around the positive nucleus in the same way as the Earth rotates around the sun. An accelerating charge, on the other hand, radiates its energy. If the electron travelled around the nucleus in a planetary pattern, it would be experiencing centripetal acceleration and so emitting energy, causing it to spiral down into the nucleus. Such a planetary hydrogen atom would not be stable, which contradicts what we know about non-disintegrating hydrogen atoms. Furthermore, the discrete emission spectra of hydrogen cannot be explained by the classical motion of the electron.
To circumvent these two difficulties, Bohr proposed the following three postulates of Bohr’s model:
In a circular orbit, the negative electron orbits the positive nucleus (proton). The nucleus is the core of all electron orbits. An electron bonded to the nucleus does not have access to all classically feasible orbits. The electron orbits that are permitted satisfy the first quantization condition: The electron's angular momentum L n can only take discrete values in the nth orbit:
Ln = nh, where n = 1, 2, 3, ...
The angular momentum of the electron is quantized, according to this assumption. The first quantization requirement can be stated explicitly as r n and u n, the radius of the nth orbit and the electron's speed in it, respectively.

Transitions from one orbit with E n energy to another orbit with E m energy are permitted for an electron. When a photon is absorbed by an atom, the electron moves to a higher-energy orbit. When a photon is emitted by an atom, the electron moves to a lower-energy orbit. Electron transitions with simultaneous photon absorption or emission occur in a split second. The second quantization criterion is satisfied by the allowed electron transitions:
Hf = | En – Em|
Where h f is the energy of a photon with frequency f that is either emitted or absorbed. The change in energy of an electron in the hydrogen atom is quantized, according to the second quantization condition.
These three postulates of the early quantum theory of the hydrogen atom allow us to deduce not only the Rydberg formula, but also the value of the Rydberg constant, as well as other essential aspects of the hydrogen atom like its energy levels, ionisation energy, and electron orbit sizes. The classical description of the electron as a particle exposed to the Coulomb force and whose motion must obey Newton's equations of motion is included in Bohr's model, along with two nonclassical quantization postulates. As an isolated system, the hydrogen atom must obey the rules of conservation of energy and momentum as we know them from classical physics. We can now proceed with our analysis with this theoretical framework in mind.
1.11.2 Electron Orbits
We use Newtonian mechanics to determine the radius r n of the electron's nth orbit and the electron's speed v n within it. The electron experiences an electric pull toward the positively charged nucleus at the centre of its circular orbit as a charged particle. The centripetal force causes the electron to move in a circle around the nucleus due to the electrostatic pull. As a result, the magnitude of centripetal force and the magnitude of electrostatic force are identical:

Here, denotes the value of the elementary charge. The negative electron and positive proton have the same value of charge, |q| = e When (Figure) is combined with the first quantization condition given by (Figure), we can solve for the speed,  and for the radius,


Because all other numbers in the preceding equations are basic constants, these results inform us that the electron's speed and orbit radius depend only on the index n that enumerates the orbit. The size of the orbit expands as the square of n, as shown in (Figure). This means the second orbit is four times the size of the first, the third orbit is nine times the size of the first, and so on. The electron's speed in the orbit reduces as the orbit size grows, as shown in (Figure). For n=1, the electron's speed is greatest in the first Bohr orbit, which is closest to the nucleus. The Bohr radius of hydrogen, represented as a=0, is the radius of the first Bohr orbit. Setting n=1 in (Figure) yields the following value:

We can substitute  in (Figure) to express the radius of the nth orbit in terms of
rn = a0 n2
This result means that the electron orbits in hydrogen atom are quantized because the orbital radius takes on only specific values of a0, 4a0, 9a0, 16a0, . . . given by (Figure), and no other values are allowed.
1.11.3 Electron Energies
The total energy  of an electron in the nth orbit is the sum of its kinetic energy
  and its electrostatic potential energy
  Utilizing (Figure), we find that

Recall that the electrostatic potential energy of interaction between two charges  and
and  that are separated by adistance
  is
is
(1/4πϵ0) q1 q2 / r12
Here, q1 = +e is the charge of the nucleus in the hydrogen atom (the charge of the proton), q2 = e is the charge of the electron and r12 = rn is the radius of the nth orbit. Now we use (Figure) to find the potential energy of the electron:

The total energy of the electron is the sum of (Figure) and (Figure):

Note that the energy depends only on the index n because the remaining symbols in (Figure) are physical constants. The value of the constant factor in (Figure) is

It is convenient to express the electron’s energy in the nth orbit in terms of this energy, as

We can now see that the electron energies in the hydrogen atom are quantized since they can only have discrete values of given by (Figure) and no other energy values are permitted. The energy spectrum of hydrogen ((Figure)) is a collection of permissible electron energies. The energy quantum number is the index n that enumerates energy levels in Bohr's model. We compare the energy of the hydrogen atom's electron to the energy of the hydrogen atom. Because n=1 yields the minimum value of energy, the hydrogen atom cannot have an energy lower than that. The ground state energy of the hydrogen atom is the minimum value of electron energy in the hydrogen atom, and its value is
E1 = E0 = - 13.6 eV
Other energies of the hydrogen atom may exist in addition to the ground state. The higher energy states of a hydrogen atom are known as excited energy states.
There is only one ground state, but there are an endless number of excited states due to the unlimited number of n values in the equation (Figure). When the electron's energy is E 2 (when n=2), the second excited state when its energy is E 3 (when n=3), and the nth exited state when its energy is E (n+1), we call it the "first exited state." There is no highest-of-all excited state, yet the sequence of excited states has a limit. If we keep increasing n in (Figure), we arrive at the following conclusion: The electron is no longer connected to the nucleus and becomes a free electron at this point. As long as an electron's energy is negative, it remains trapped in the hydrogen atom. In the ground state, an electron orbiting the nucleus in the first Bohr orbit, closest to the nucleus, has the minimum energy value. The electron is most tightly coupled to the nucleus in the ground state, and its energy is provided by (Figure). We must provide this electron with enough energy, E_, to balance out its ground state energy if we want to remove it from the atom. 1 (E 1)
E∞ + E1 = 0 E∞ = E1 = (E0) = E0 = 13.6 eV
The ionisation energy is the amount of energy required to remove an electron from an atom. The ionisation limit of the hydrogen atom is the ionisation energy E_ required to remove the electron from the first Bohr orbit. The measured result accords with the ionisation limit obtained in Bohr's model (Figure).
The hydrogen atom's energy spectrum. The bound states of an electron in an atom are shown by energy levels (horizontal lines). There is just one ground state with n=1 quantized excited states, and there are infinite quantized excited states. The quantum number n=1,2,3,4,.... Enumerates the states. The allowable electron transitions between the states are represented by vertical lines. Transitions involving an emission of a photon with a wavelength in the designated spectral band are depicted by downward arrows.
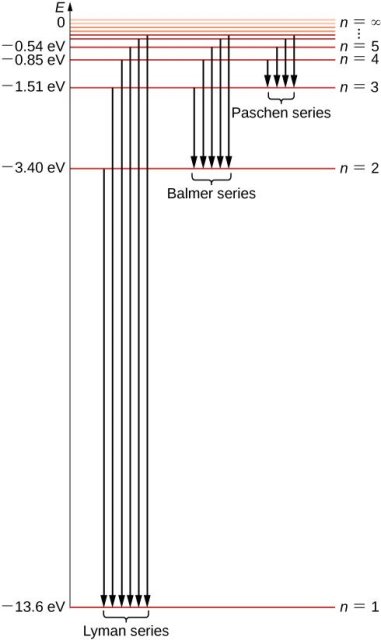
1.11.4 Spectral Emission Lines of Hydrogen
We utilise the second of Bohr's quantization conditions and (Figure) for energies to get the wavelengths of the emitted radiation when an electron transitions from the nth to the mth orbit. Only when an electron transitions from an excited state to a lower-energy state can energy be emitted from the atom. The difference in energy between the states involved in the transition is carried away by the emitted photon during such a transition. Because a photon's energy cannot be negative, the transition cannot occur in the other direction, requiring E n>E m and >m for emission. As a result, the third of Bohr's postulates results in

Now we express the photon’s energy in terms of its wavelength, hf = hc/λ and divide both sides of (Figure) by  The result is

The value of the constant in this equation is

The Rydberg constant R H in the Rydberg heuristic formula is exactly this value (Figure). In reality, because we have n=m+1,m+2,.... For a given m, (Figure) is equal to the Rydberg formula. In this method, we can deduce the experimental Rydberg constant from first principles and describe it in terms of basic constants using the Bohr quantum model of the hydrogen atom. Transitions between the permitted electron orbits are depicted in the diagram (Figure).
We may use the same techniques as before to get the wavelength of the absorbed radiation; this gives us (Figure), but this time for the positions of absorption lines in the hydrogen absorption spectrum. The main distinction is that in absorption, the quantum number m is the index of the electron's orbit before the transition (lower-energy orbit) and the quantum number n is the index of the orbit to which the electron makes the transfer (higher-energy orbit) (higher-energy orbit). The energy of the absorbed photon is the difference between the electron energies in these two orbits.
The spectra of several hydrogen-like ions are also well predicted by Bohr's model of the hydrogen atom. Hydrogen-like ions are atoms with an atomic number Z greater than one (Z=1 for hydrogen) that have all but one of their electrons removed. An electrically neutral helium atom, for example, has the atomic number Z=2. This indicates it has two electrons with a charge of q=+Ze orbiting the nucleus. When one of the orbiting electrons from a helium atom is removed (known as singly ionisation), a hydrogen-like atomic structure remains, with the remaining electron orbiting the nucleus with a charge of q=+Ze. The Bohr model describes this type of event. Assume that the nucleus' charge is +Ze rather than +e. To get the findings for a hydrogen-like ion, repeat all steps starting with (Figure):
rn = 
Where  , n is the Bohr orbit of hydrogen, and

Where E 0 is the hydrogen atom's ionisation limit. As long as the atomic number Z is not too big, these formulae are excellent approximations.
Because it was the first model to postulate the quantization of electron orbits in atoms, the Bohr model is significant. As a result, it is an early quantum theory that paved the way for the development of modern quantum theory. It was the first time a quantum number was used to describe atomic states. The early quantum theory has the constraint of being unable to describe atoms with more than one electron orbiting the nucleus. Because it blends the classical concept of electron orbits with the novel concept of quantization, the Bohr model of hydrogen is a semi-classical model. The model's exceptional success motivated many physicists to look for an explanation for why it worked at all, as well as an understanding of the physics behind early quantum theory's postulates. This quest resulted in the birth of a completely new notion known as "matter waves."
1.12.1 Introduction to Atomic Spectroscopy
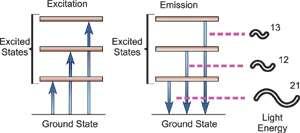
Fig. Energy Transitions
Atomic spectroscopy is the study of an element's electromagnetic or mass spectrum to determine its composition. Optical Atomic Spectroscopy is the study of an element's electromagnetic spectrum. Within an atom, electrons exist in different energy states. Electrons travelling between these levels must absorb or emit energy equal to the difference in their energies. The energy absorbed to shift an electron to a higher energetic energy level and/or the energy emitted as the electron goes to a less energetic energy level is measured in photons in optical spectroscopy. The electronic transition that has happened is closely related to the wavelength of the emitted radiant radiation. The wavelength of light emitted is a unique attribute of each individual element because each has its own electrical structure. Because a large atom's orbital structure can be complicated, several electronic transitions can occur, each of which results in the emission of a specific wavelength of light, as seen below.
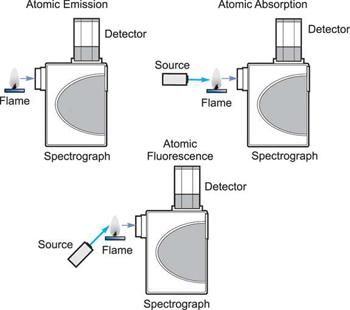
How the three techniques are implemented.
Three analytical approaches have emerged from the study of atomic spectroscopy: Atomic Absorption is a term that refers to the process of absorbing Emission of atoms. Fluorescence of atoms. In all three domains of atomic spectroscopy, the process of excitation and decay to the ground state is involved. The energy received in the excitation process or the energy emitted in the decay process is measured and analysed.
When a free, ground state atom is struck by light of just the correct wavelength, the atom may absorb the light as it transitions to an excited state, a process known as atomic absorption. On the right, you can see how this works. The amount of light at the resonant wavelength that is absorbed as it travels through a cloud of atoms is referred to as atomic absorption. The amount of light absorbed grows in a predictable manner as the number of atoms in the light path rises. A quantitative determination of the amount of analyte element present can be made by measuring the amount of light absorbed. Individual elements can be determined quantitatively in the presence of others using special light sources and careful wavelength selection. Providing enough heat energy to the sample to breakdown the chemical compounds into free atoms produces the atom cloud required for atomic absorption measurements. This is accomplished by aspirating a sample solution into a flame aligned with the light beam. Most atoms will remain in the ground state at the right flame conditions and will be able to absorb light at the analytical wavelength from a source lamp. Because of the ease and speed with which precise and accurate assessments can be produced, atomic absorption has become one of the most preferred methods for determining metals.

The atomic absorption process
A sample is exposed to a high-energy, thermal environment in order to develop excited state atoms capable of producing light in atomic emission. An electrical arc, a flame, or, more recently, a plasma can all be used as energy sources. Because of the discrete nature of the emitted wavelengths, the emission spectrum of an element exposed to such an energy source consists of a collection of the permissible emission wavelengths, generally referred to as emission lines. This emission spectrum can be used to qualitatively identify an element by its emission spectrum. In qualitative analysis, atomic emission utilising electrical arcs has been widely employed. Emission techniques can also be used to figure out how much of a particular element is in a sample. The intensity of light emitted at the wavelength of the element to be evaluated is measured for a "quantitative" analysis. As the number of atoms in the analyte element rises, the emission intensity at this wavelength increases. Flame photometry is a technology that uses atomic emission to do quantitative analysis.
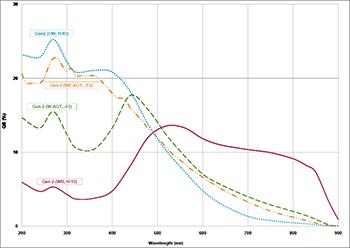
ICCD Quantum Efficiency relevant to Atomic spectroscopy
Atomic fluorescence is the third branch of atomic spectroscopy. Aspects of both atomic absorption and atomic emission are included in this approach. Ground state atoms generated in a flame are awakened by focussing a beam of light into the atomic vapour, similar to atomic absorption. The emission coming from the decay of the atoms stimulated by the source light is measured instead of the amount of light absorbed in the process. With increasing atom concentration, the intensity of this "fluorescence" increases, allowing for quantitative determination. The atomic fluorescence source lamp is angled away from the rest of the optical system, so the light detector only sees the fluorescence in the flame and not the light from the lamp. It is beneficial to optimise lamp intensity since sensitivity is directly related to the number of excited atoms which in turn is a function of the intensity of the exciting radiation.
While atomic absorption is the most extensively used of the three techniques and typically provides various advantages over the other two, in specific analytical conditions, emission or fluorescence may provide additional benefits.
1.12.2 Rydberg Formula
Using the Rydberg formula, it becomes easy to calculate the spectral lines. Following is the formula:

Where,
R is the Rydberg constant (1.09737*107 m-1)
Z is the atomic number
n is the upper energy level
n’ is the lower energy level
λ is the wavelength of light
Spectral series of single-electron atoms like hydrogen have Z = 1.
Following is the table for λ in vacuum:
Series | n | λ (nm) |
Lyman series with n’=1 | 2 | 121.57 |
3 | 102.57 | |
∞ | 91.175 | |
Pfund series with n’=5 | 6 | 7460 |
7 | 4654 | |
∞ | 2279 | |
Humphreys series with n’=6 | 7 | 12.37 |
8 | 7.503 | |
∞ | 3.282 |
Following is the table for λ in the air:
Series | n | λ (nm) |
Balmer series with n’=2 | 3 | 656.3 |
4 | 486.1 | |
∞ | 364.6 | |
Paschen series or Bohr series with n’=3 | 4 | 1875 |
5 | 1282 | |
∞ | 820.4 | |
Brackett series with n’=4 | 5 | 4051 |
6 | 2625 | |
∞ | 1458 |
1.12.3 Atomic Spectroscopy
The study of the electromagnetic radiation received or emitted by atoms is known as atomic spectroscopy. There are three different forms of atomic spectroscopy:
- The transfer of energy from the ground state to an excited state is the subject of atomic emission spectroscopy. Atomic emission can explain the electronic transition.
- Atomic absorption spectroscopy: For absorption to occur, the lower and higher energy levels must have the same energy difference. The notion that free electrons created in an atomizer can absorb radiation at a given frequency is used in the atomic absorption spectroscopy principle. It measures how much ground-state atoms absorb in the gaseous state.
- Atomic fluorescence spectroscopy combines atomic emission and atomic absorption since it involves both excitation and de-excitation radiation.
1.12.4 Uses of Atomic Spectroscopy
- It is used for identifying the spectral lines of materials used in metallurgy.
- It is used in pharmaceutical industries to find the traces of materials used.
- It can be used to study multidimensional elements.
1.13.1 Reduce Mass:
We assumed that the nucleus of a one-electron atom is infinitely massive and does not move when calculating the energy of the electron. Despite the fact that m em p/2000 is an acceptable approximation, spectroscopy is a very exact discipline, and the wavelength disparity owing to the infinite mass assumption can be noticed. As a result, we must account for the nucleus' finite mass and mobility in order to improve our formulations.
First, the hydrogen atom's centre of mass (CM) is unaccelerated since the net external force on the atom is zero. As a result, we can rest the CM in an appropriate inertial frame. Around the stationary CM, the proton and electron orbit. We suppose that the proton and electron orbit the CM rigidly, thus their angular velocity is the same. Let us also assume that the origin is at the proton's location.
(a) The position of the CM is given by


(b)
vp = rp ω. ve = re ω.
K = Ke + Kp = ½ me re2 ω2 + ½ mp rp2 ω2


Where

Is the reduced mass.
[Notice that the only difference between the above expression for K and the fixed-proton result is that µ has replaced me. Also, note that  for hydrogen.]
(c) The electrostatic force exerted on the proton is  2/r2
2/r2
The centripetal force

But

So


Equating the electrostatic force to the centripetal force gives

The same result is obtained for the electron
(d) The potential energy is given by

Using Eq. (iv), we can write


(e)
L = Le + Lp = mprpvp + mereve = mprp2 ω + mere2 ω

(f) It is clear that correcting the previously derived result only entails replacing me by µ . Thus, the Rydberg energy becomes

Despite the prominence of this interpretation in the physics literature, current Bohr scholars agree that Bohr did not mean his correspondence principle to indicate some form of general necessity that quantum mechanics retrieve the predictions of classical mechanics in the classical limit (see Section 6). There is less agreement, however, on which relationship between classical and quantum mechanics Bohr meant the correspondence principle to designate. In the literature, there are three main contenders, all of which are supported by Bohr's publications. The frequency interpretation, the intensity interpretation, and the selection rule interpretation are the three interpretations that can be labelled.
The correspondence principle is characterised by the frequency interpretation as a statistical asymptotic agreement between the (quantum) frequency, vn′Vn", of radiation released in a quantum leap of difference from state n′ to n′′ and the (classical) frequency () in the n′ stationary state, namely

Where, n′−n′′=τ
It's worth noting that this equality between the quantum frequency and one component of the classical frequency applies only in the case of large quantum numbers—it doesn't hold for low quantum-number transitions. Furthermore, there is only statistical agreement because classically all the frequencies will be given off together, whereas quantum mechanically only a single photon with a single frequency is emitted in any given transition between stationary states; thus, one must compare the classical spectrum with a statistical ensemble of atoms.
The correspondence principle, according to the intensity interpretation, is described as the agreement, in the limit of large quantum numbers, between the probability, Pn′n", of a transition between two stationary states separated by and the square of the amplitude, C, of the classical motion:

Thus in the limit of large nn the amplitudes of the harmonic components of the electron’s classical orbit can be used to calculate the intensities of the spectral lines. While the amplitude of radiation determines its intensity in classical physics, the number of photons released at a given frequency determines the intensity of a spectral line in quantum physics. As a result, the more likely a quantum transition is, the more photons will be emitted, and the higher the intensity. It's worth noting that, like the frequency interpretation, this is merely a statistical relationship that holds only in the case of big quantum numbers.
Bohr's correspondence principle is best understood as the assertion that each permissible quantum transition between stationary states corresponds to one harmonic component of classical motion, according to the selection rule interpretation. More precisely, Bohr’s selection rule states that the transition from a stationary state n′ to another stationary state n′′ is allowed if and only if there exists a τth harmonic in the classical motion of the electron in the initial stationary state; if there is no τth harmonic in the classical motion, then transitions between stationary states whose separation is τ are not allowed quantum mechanically. Figure 1 depicts the essence of Bohr's correspondence principle.

A classical periodic orbit, x(t)x(t), can be represented as a Fourier sum of “harmonics” which are integer multiples of the fundamental frequency, ωω, representing the periodicity of the motion. According to the selection rule interpretation, the correspondence principle is Bohr’s insight that each allowed transition between stationary states corresponds to one harmonic component of the classical motion. (Based on Fig. 3 of Fedak and Prentis 2002)
Bohr’s selection rule can be illustrated by the following simplified example. Suppose that the solution to Newton’s equation,  , and the quantum condition ∮pdx=nh is
x(t, n) = n cos (n1/2 t) + n1/2 cos (3n1/2 t),
This is the Fourier decomposition of the electron's classical periodic motion in a permitted stationary state nn. The fundamental frequency (i.e., periodicity of electron motion) for this stationary state nn is n12. Note that in the classical motion, only the first (=1) and third (=3) harmonics are present (Equation 6). According to Bohr's selection rule, quantum jumps between stationary states that are one or three stationary states away are possible. So, for example, transitions from the n=100 stationary state to the n=99 or n=97 stationary states are possible; however, transfers from the n=100 stationary state to the n=98 stationary state are not possible because the classical electron orbit lacks a second harmonic.
The selection rule interpretation, unlike the frequency and intensity interpretations of the correspondence principle, is not an asymptotic relation; it applies to all quantum number transitions, including small n.
It's important to remember that Bohr found and wrote about all of these correspondence relations; the debate among Bohr researchers is over which of these correspondence links (if any) Bohr intended to designate as the correspondence principle. Some experts have even questioned whether Bohr ever had a well-defined and consistent definition of the correspondence principle.
Key takeaways:
- Bohr's correspondence principle demands that classical physics and quantum physics give the same answer when the systems become large. ... The conditions under which quantum and classical physics agree are referred to as the correspondence limit, or the classical limit.
- The Bohr model can be summarized by the following four principles: Electrons occupy only certain orbits around the nucleus. Those orbits are stable and are called "stationary" orbits. Each orbit has an energy associated with it.
1.15.1 Bohr’s Theory – Bohr’s Atomic Model
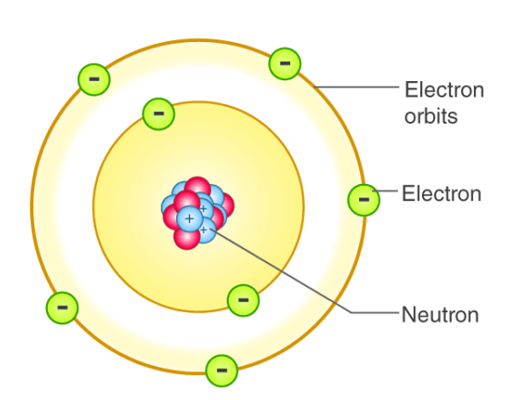
Thomson's and Rutherford's atomic models both failed to answer any problems about the energy and stability of an atom. Niels Bohr proposed an atomic structure model in 1913, describing an atom as a small, positively charged nucleus surrounded by electrons that travel in circular orbits around the positively charged nucleus like planets orbiting the sun in our solar system, with attraction provided by electrostatic forces. It was essentially an upgraded version of Rutherford's atomic model that addressed its flaws. He agrees with him on the majority of points, such as the notion of nucleus and electrons encircling it. Electrons revolve around the nucleus in stable orbits without emitting radiant energy, according to Niels Bohr's atomic model. Each orbit has a distinct energy level, which is referred to as an energy shell or energy level, and is denoted by the letters K, L, M, and N. The electron is said to be in the ground state when it is at its lowest energy level.
- When an electron jumps from one orbit or energy level to another, it emits or absorbs energy. It emits energy when it jumps from a higher to a lower energy level, while it absorbs energy when it goes from a lower to a higher energy level.
- Plank's equation determines the energy received or emitted as the difference between the energies of the two energy levels (E1, E2).
ΔE = E2-E1 = hv
Where,
ΔE = energy absorbed or emitted
h= Plank’s constant
v= frequency of electromagnetic radiation emitted or absorbed
- The angular momentum of an electron revolving in energy shells is given by:
mevr = nh/2π
Where,
n= number of corresponding energy shell; 1, 2, 3…
me= mass of the electron
v= velocity
r=radius
h= Plank’s constant
1.15.2 Limitations of Bohr Atomic Model Theory
- It goes against Heisenberg's Uncertainty Principle. According to the Bohr atomic model theory, electrons have both a known radius and orbit, i.e., known position and momentum at the same time, which Heisenberg claims is impossible.
- When it comes to smaller atoms like hydrogen, the Bohr atomic model theory makes accurate forecasts, but when it comes to larger atoms, it makes poor spectral predictions.
- When the spectral line is broken into numerous components in the presence of a magnetic field, it fails to explain the Zeeman effect.
- It was unable to account for the Stark effect, which occurs when a spectral line splits into fine lines in the presence of an electric field.
1.16.1 Discrete energy and radioactivity
Discrete energy and discrete energy levels
- An atom's electrons can occupy discrete atomic energy levels, and energy is received or released in the form of a photon as an electron jumps from one energy level to another. The difference between discrete atomic energy levels is equivalent to the amount of energy absorbed or emitted, and it is quantized. A photon's energy is proportional to its frequency. As a result, an atom can only absorb or release photons with frequencies that correspond to the disparities between the atomic energy levels. In the emission and absorption spectra, these frequencies appear as spectral lines.

- The existence of discrete energy levels called atomic energy levels can be supported by the emission spectra and the absorption spectra of atoms.
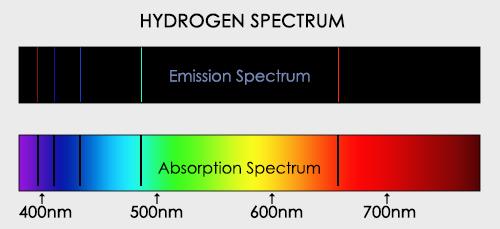
Transitions between energy levels
Energy is released in the form of light when electrons within an atom shift from one atomic energy level to a lower energy level. When electrons within an atom travel from one atomic energy level to a higher energy level, light is absorbed.
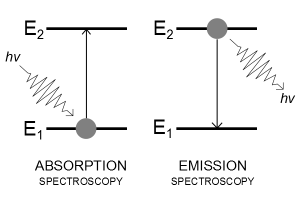
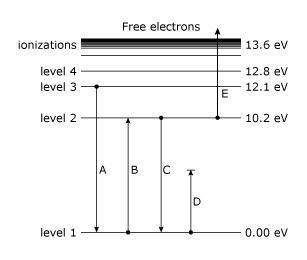
The difference in energy (eV) between the two energy levels can be used to compute the amount of energy received or released.
Radioactive decay
- The spontaneous random process by which particles or electromagnetic radiation are emitted from an unstable nucleus is known as radioactive decay. A daughter nucleus is the product nucleus of radioactive decay.
- The daughter nucleus is energetically unstable, and half-lives reveal the activity of radioactive decay.
Activity (half-life decay)

Half-life 
- The time it takes for half of a substance's radioactive nuclei to decay is known as its radioactive half-life.
- The decay curve is formed by plotting the amount of radioactive nuclei that have not yet decayed against time. It can be presented as follows.
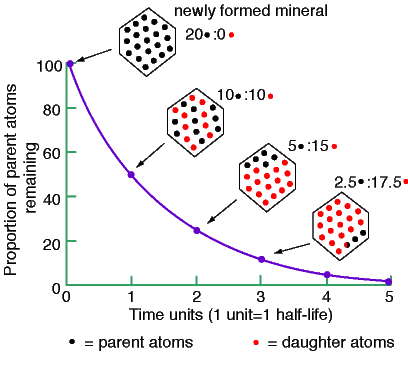
Fundamental forces and their properties


Alpha particles, beta particles and gamma rays
Alpha particles
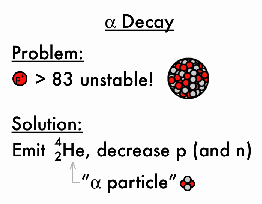
An alpha particle is a helium nucleus.
It has a relative charge of +2, has the lowest penetration power of the three types of particles, and can be prevented by a piece of paper or a few centimetres of air, and has the highest ionising power of the three types of particles.
Beta particles
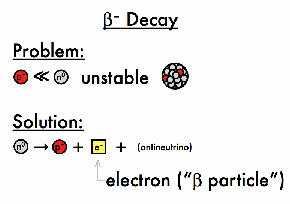
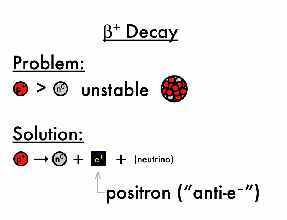
A beta particle is an electron or a positron.
It has a relative charge of -1 or +1, and its penetrating power is in the middle of the three types of particles. Its ionising power is in the middle of the three types of particles, and it may be prevented by a thin sheet of aluminium.
Gamma rays
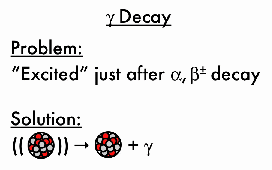
- Gamma rays are photons that do not have a charge and have the maximum penetration strength of the three types of particles, which can be prevented by several centimetres of lead.
- It has the lowest ionising power of the three types of particles.


Absorption characteristics of decay particles
Short-term effects | Long-term effects |
Radiation burn Nausea and vomiting Diarrhoea Headache | Cancer Genetic mutations |
Isotopes
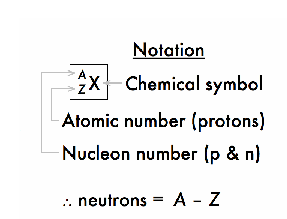
Distinct isotopes of the same element have the same atomic number (which determines the element's type) but differing mass numbers due to different neutron counts.
Background radiation
Background radiation comes from natural sources and artificial sources.
- Cosmic rays from space, radioactive rocks and soil, and living animals that have consumed radioactive compounds in the food chain are all natural sources.
- Radioactive waste from nuclear power plants, radioactive fallout from nuclear weapons, and medical x-rays are all examples of artificial sources.
Average composition and exposure of background radiation
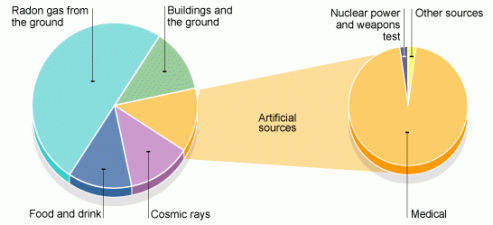

1.17.1 Introduction
The hydrogen atom's Bohr model was effective in that it accurately explained the spectrum of radiation emitted by these atoms. In essence, the model suggested the presence of discrete electronic energy levels in atoms, which could be estimated based on the assumption that the circling electrons' angular momentum was quantized. The spectrum of atomic hydrogen was explained using a combination of the concept of quantized energy levels and the idea that a quanta of radiation can only be released (with frequency determined by the Einstein relation) when an atom shifts its energy to a more tightly bound state. Other methods of obtaining more direct proof of the existence of distinct energy levels in atomic systems exist, though.
The effect of hitting mercury atoms with electrons will be investigated in this experiment. Because atoms are thought to have discrete energy levels, one would anticipate energy to be transferred to the atom in distinct amounts after collisions with electrons. Inelastic scattering is one proposed process, in which a defined quantity of transmitted electron energy is absorbed by the entire atom, raising it to an excited state. The mechanics of such a collision allow the atomic system to absorb practically all of the energy of the input electron, as long as the atom does not become ionised.
In 1914, Franck and Hertz attempted to validate these notions for the first time. Specifically, that atomic systems contain discrete energy levels that can be stimulated by bombardment electron collisions, and that the energy differences between the levels correspond to spectroscopic measurements. Using mercury vapour, we will perform the Franck-Hertz experiment. The wavelength of the spectral line detected in mercury discharges, which corresponds to the energy levels we will detect, is 2537. There are many additional lines in the mercury spectra, but using a Franck-Hertz setup, it is extremely difficult to excite these energy differences in the mercury atom.
1.17.2 Equipment
Figure shows a diagram of the equipment that will be used. It consists of a thermionic tube with a cathode, an anode, and a collector or counter electrode as the third electrode. A little blob of mercury is also present in the tube. The tube is grounded by the metal case that surrounds it. To keep a mercury vapour pressure in the tube, the mercury is heated to 180 degrees Celsius. Of course, pressure varies with temperature, and the amount of pressure is crucial to the experiment. There may be too few mercury atoms to create noticeable effects if the vapour density is too low. When the pressure is too high, the mean free path is reduced, and thermal agitation occurs.
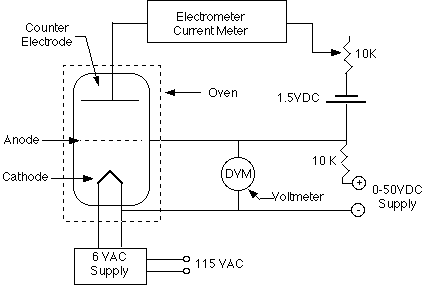
In relation to the cathode, the anode is connected to a variable voltage source (0 to +50 Volts). In relation to the anode, the counter electrode is kept at a voltage of 0.5 to 1.5 volts negative. A voltage divider and a 1.5 volt battery can be used to control the counter electrode voltage.
The cathode-anode system essentially functions as a diode. Some electrons can travel through the anode, which is a grid-like structure, and overcome the 0.5 - 1.5 Volts retarding potential to reach the counter electrode if they are energetic enough. The Keithley Electrometer, which is a very sensitive device capable of measuring the little current involved, can be used to measure the counter current.
However, we must evaluate how the presence of mercury vapour alters the system's behaviour. The mercury atoms will collide with electrons propelled from the cathode to the anode. When electrons gain enough energy to inelastically excite a mercury atom, they can lose the majority of their energy. It may therefore be unable to overcome the 0.5 - 1.5 Volts required to reach the counter electrode due to a lack of energy. As the anode voltage is increased, the counter current should drop sharply at the energy level where such collisions can occur. The counter current begins to grow again at greater voltages, but the electrons eventually accumulate enough energy to experience two or more inelastic collisions. As a result, the observed current-voltage curve should be continuously rising with a sequence of dips; the difference in energy between the ground state and first excited state in the mercury atoms will correspond to the interval of two dips.
1.17.3 Procedure
- The circuit in the illustration has already been set up for you, and the tube has been warmed up. Make sure the oven is set to 180 degrees Celsius. Make a note of the temperature. The ground of the electrometer should be the same as the ground of the thermionic tube's metal housing. Begin with a 0V anode voltage. Slowly increase the voltage while keeping the Keithley Electrometer on its most sensitive scale until you receive a distinct signal on the electrometer. Make a note of the voltage.
- Continue to progressively increase the anode voltage. Because the electrometer reacts slowly to these changes, provide plenty of time for it to react. Record the voltage and the related current at each local maximum and minimum in current.
- Raise the anode voltage to at least 50V. (do not exceed this voltage). When you've reached this point, reduce the voltage to zero and wait for the equipment to recuperate for at least five minutes. Check the temperature once more to ensure that it is maintaining a consistent level.
- Repeat steps 2-4 for a total of two times. Take at least one data point between the highest and minimum during your last run.
1.17.4 Data Analysis
For each data set, graph current vs. Voltage.
- Calculate the amount of energy transferred from an electron to a mercury atom in an inelastic collision using your graphs.
- Compare this to the projected energy from the spectral line 2537. Estimate Planck's constant using the energy given above and the 2537 spectral line (with associated uncertainty).
- To extract an electron from a metal, a specific minimum energy is required; this is referred to as the metal's "work function." The anode's work function is higher than the cathode's, resulting in a "contact-potential differential" between the anode and the cathode. It causes the entire Current vs. Voltage curve to change (why?). Calculate the difference in contact potential.
- Describe the characteristics of the detected counter current. Temperature, vapour pressure, accelerating voltage, space charge, and other physical events influence these characteristics. Make sure to bring these up in your conversation. One of the references given below may be of assistance to you.
1.18.1 Sommerfeld atom model and its Drawbacks
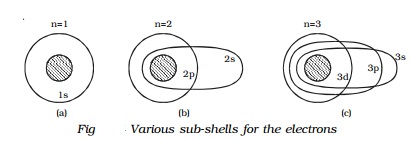
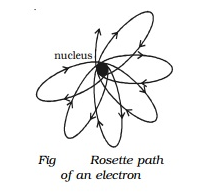
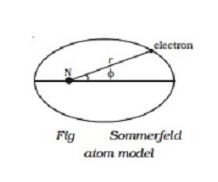
In order to explain the observed fine structure of spectral lines, Sommerfeld introduced two main modifications in Bohr's theory.
1.18.2 Sommerfeld atom model
Sommerfeld made two major changes to Bohr's theory in order to explain the observed fine structure of spectral lines.
I According to Sommerfeld, an electron's route around the nucleus is a general ellipse with the nucleus as one of its foci.
(ii) The electron's velocity in an elliptical orbit change at different points along the orbit. The mass of the travelling electron varies relativistically as a result of this.
When elliptical orbits are allowed, there are now two variables to consider.
(i) The electron's fluctuating distance from the nucleus (r).
(ii) The azimuthal angle, which describes the changing angular location of the electron with regard to the nucleus (Fig).
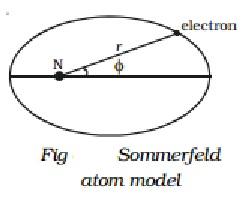
Two quantum numbers are introduced to cope with these two variables.
(i) In Bohr's theory, the primary quantum number n governs the energy of the electrons, and
(ii) an orbital (or azimuthal) quantum number (l) that has been introduced to characterise the angular momentum in an orbit, i.e., it determines the electron's orbital angular momentum. Its values range from zero to (n-1) in unity steps.
This orbital quantum number (l) can be used to calculate the number of potential elliptical orbits. The elliptical orbits that are possible are such that
b/a = l+1/n
Where a and b are the ellipse's semi-major and semi-minor axes, respectively.
Sommerfeld's model states that for any principal quantum number n, there are n potential sub-orbits or sub-shells with various eccentricities. One of the n subshells is circular, whereas the others (i.e., n-1) are elliptical
Because of the relativistic difference in electron mass, these hypothetical sub-orbits have slightly different energies
Take a look at the first energy level (n=1). When n = 1, l = 0, indicating that the electron has only one orbit or sub-shell at this energy level. The two axes of the ellipse are also identical when a = b. As a result, the orbit associated with n=1 is circular. This subshell is known as the s subshell. This sub-shell is referred to as 1s since it belongs to the n=1 group (Fig a).
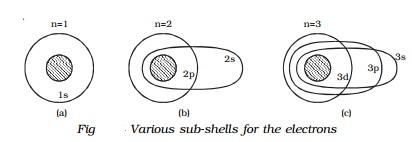
Similarly, for the second energy level n=2, there are two permissible sub-shells for the electrons. For n=2, l can take two values, 0 and 1.
When n = 2, l = 0.
b/a= 0+1/2 =1/2
Or
b=a/2
This subshell corresponding to l = 0 is elliptical in shape and is designated as 2s.
When n = 2, l = 1.
b/a= 1+1/2 =2/2 =1
Or
b=a
This sub-shell corresponding to l = 1 is circular in shape and is designated as 2p (Fig b).
For n = 3, l has three values 0, 1 and 2, i.e. there are three permissible sub-shells for the electrons.
When n = 3, l = 0.
b/a= (0+1)/3 =1/3 =1 or b=a/3
When n = 3, l = 1.
b/a= (1+1)/3 =2/3 =1 or b=2a/3
And when n = 3, l = 2.
b/a= (2+1)/3 =3/3 =1 or b=a
3s, 3p, and 3d are the sub-shells that correspond to l = 0, 1, and 2. The 3d shell is circular, while the other two are elliptical in shape (Fig c).
It is common practice to assign letters to l-values as given below:
Orbital quantum number l : 0 1 2 3 4
Electron state: s p d f g
Hence, electrons in the l = 0, 1, 2, 3 states are said to be in the s, p, d, f states.
1.18.3 Fine structure of spectral line
The total energy of an electron in an elliptical orbit can be calculated using the Sommerfeld atom model as follows:
En = (-me4Z2 ) / (8ε02h2n2)
This is the same expression that Bohr came up with. As a result, the addition of elliptical orbits results in no new energy levels and, as a result, no new transition. Sommerfeld's attempt to explain the fine structure of spectral lines so failed. Sommerfeld was able to solve the problem of the fine structure of the spectral lines soon after, based on the fluctuation of electron mass with velocity.
The electron's velocity is greatest when it is closest to the nucleus and lowest when it is farthest from the nucleus, according to Sommerfeld, since the electron's orbit is elliptical. This means that the electron's effective mass will vary depending on where it is in its orbit. Sommerfeld adjusted his theory to account for relativistic variations in electron mass and demonstrated that the electron's path is a precessing ellipse known as a rosette, rather than a simple ellipse (Fig).
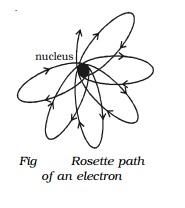
Sommerfeld was able to describe the fine structure of hydrogen atom spectral lines using this concept.
Drawbacks
I While Sommerfeld's modification provided a theoretical framework for the fine structure of hydrogen spectral lines, it was unable to predict the right number of fine structure lines seen.
(ii) It was unable to explain how electrons are distributed and arranged in atoms.
(iii) Sommerfeld's model failed to account for the spectra of alkali metals such as sodium and potassium
(iv) It was unable to explain the Zeeman and Stark effect.
(v) The intensities of the spectral lines are not explained by this hypothesis.
Key takeaways:
Arnold Sommerfeld, a German physicist, improved Bohr's theory by quantizing the shapes and orientations of orbits, resulting in the introduction of extra energy levels corresponding to tiny spectral lines. The atom was characterised in terms of two quantum numbers in the new and more broad Bohr–Sommerfeld theory, whereas Bohr had only employed one quantum number in his original theory. The Stark effect, the conventional Zeeman effect, and the fine structure of the hydrogen spectrum were all explained by this extension. The refinements were: (a) the addition of elliptic orbits; (b) the consideration of relativistic mass effects; and (c) the allowing for an orbiting motion of the nucleus.
References:
1.Quantum Mechanics: Theory and Applications, A.K.Ghatakand S. Lokanathan,(Macmillan)-2004
2. Introduction to Quantum Theory, David Park (Dover Publications)-1974
3. Theory and Problems of Modern Physics, Schaum‘s outline,R.Gautreau and W.Savin- (Tata McGraw-Hill) 2nd Edition
4. Physics for scientists and engineer with Modern Physics-Jewell and Serway -(CENGAGE Learnings) 2010.
5. Modern Physics of Atoms and Molecules Bransden and Joachim (PearsonIndia)-2003