Unit - 2
Transition Elements
2.1.1 What are Transition Elements?
Transition elements are elements with partially filled d orbitals (also known as transition metals). Transition elements are described by IUPAC as elements with a partially filled d subshell or elements that have the ability to form stable cations with an incompletely filled d orbital.
Any element that corresponds to the d-block of the modern periodic table (which includes groups 3-12) is called a transition element in general. Also, the lanthanides and actinides, which make up the f-block, are called transition metals.
The f-block elements are also referred to as inner transition elements or inner transition metals because their f-orbitals are incompletely filled. The role of transition metals on the periodic table, as well as their general electronic configurations, are depicted in the diagram below.
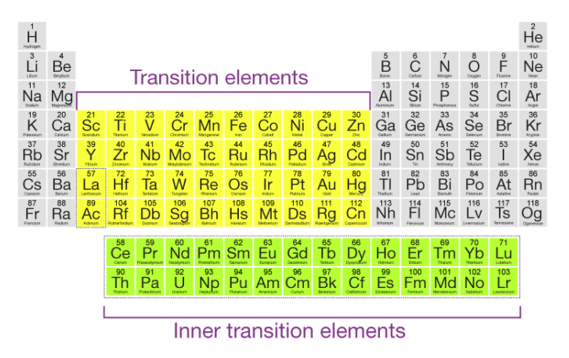
Because of their electronic structures, which correspond to (n-1) d10 ns2, mercury, cadmium, and zinc are not considered transition elements.
In their ground states and also in some of their oxidation states, these elements have fully filled d orbitals. The +2-oxidation state of mercury, which corresponds to an electronic configuration of (n-1) d10, is one such example.
2.1.2 Electronic Configuration of Transition Elements
The first two rows of transition elements are mentioned below, along with the electronic configurations that correspond to them. It should be noted that the electron configuration in some of these elements corresponds to (n-1) d5 ns1 or (n-1) d10 ns1. This is due to the stability offered by electron orbitals that are half-filled or fully filled.
Transition Elements | Atomic Number | Electronic Configuration |
Sc | 21 | [Ar] 3d1 4s2 |
Ti | 22 | [Ar] 3d2 4s2 |
V | 23 | [Ar] 3d3 4s2 |
Cr | 24 | [Ar] 3d5 4s1 |
Mn | 25 | [Ar] 3d5 4s2 |
Fe | 26 | [Ar] 3d6 4s2 |
Co | 27 | [Ar] 3d7 4s2 |
Ni | 28 | [Ar] 3d8 4s2 |
Cu | 29 | [Ar] 3d10 4s1 |
Zn | 30 | [Ar] 3d10 4s2 |
Y | 39 | [Kr] 4d1 5s2 |
Zr | 40 | [Kr] 4d2 5s2 |
Nb | 41 | [Kr] 4d4 5s1 |
Mo | 42 | [Kr] 4d5 5s1 |
Tc | 43 | [Kr] 4d5 5s2 |
Ru | 44 | [Kr] 4d7 5s1 |
Rh | 45 | [Kr] 4d8 5s1 |
Pd | 46 | [Kr] 4d10 |
Ag | 47 | [Kr] 4d10 5s1 |
Cd | 48 | [Kr] 4d10 5s2 |
Many transition elements, such as chromium, do not seem to obey the Aufbau theory. The low energy difference between the 3d and 4s orbitals, as well as the 4d and 5s orbitals, is thought to be the explanation for this.
2.1.3 General Properties of Transition Elements
Zinc, cadmium, and mercury are not called transition elements because their electronic structures vary from that of other transition metals, as previously mentioned. The rest of the d-block elements, on the other hand, have properties that are very similar, and this similarity can be seen along each row of the periodic table. The transition elements' properties are described below.
Colored compounds and ions are formed by these elements. The d-d electron transition is responsible for this colour.
2.1.4 Atomic Ionic Radii
Because of the weak shielding provided by the small number of d-electrons, the transition elements' atomic and ionic radii decrease from group 3 to group 6. Those in groups 7 and 10 have atomic radii that are very similar, while those in groups 11 and 12 have larger radii. This is due to the electron-electron repulsions, which balance out the nuclear charge.
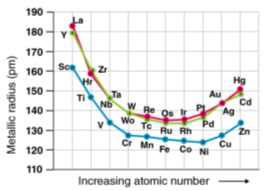
As you progress down the group, you'll notice a rise in the atomic and ionic radii of the elements. The existence of a larger number of subshells may explain the increase in radius.
2.1.5 Ionization Enthalpy
The amount of energy required to remove a valence electron from an element is referred to as ionisation enthalpy. The ionisation potential of an element is proportional to the effective nuclear charge acting on electrons. This is why transition elements' ionisation enthalpies are normally higher than those of s-block elements.
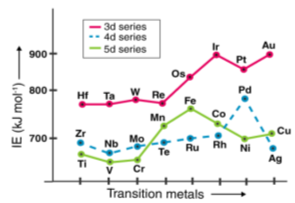
In certain ways, an element's ionisation energy is linked to its atomic radius. Ionization enthalpies are higher in atoms with smaller radii than in atoms with larger radii. The transition metals' ionisation energies increase as they move down the lines (due to the increase in atomic number).
2.1.6 General Trends among the Transition Metals:
Transition metals, which are found in groups 3–12 of the periodic table, have partially filled d subshells in their free elements or cations. (Although group 12 metals do not have partially filled d shells, their chemistry is close to that of the preceding groups in several respects, so they are included in our discussion.) In contrast to the s-block and p-block elements, the transition metals share major horizontal as well as vertical chemistry similarities.
Electronic Structure and Reactivity of the Transition Metals
The valence electron configurations of the first-row transition metals are given in Table 11. As we go across the row from left to right, electrons are added to the 3d subshell to neutralize the increase in the positive charge of the nucleus as the atomic number increases. With two important exceptions, the 3d subshell is filled as expected based on the aufbau principle and Hund’s rule. Unexpectedly, however, chromium has a 4s13d5 electron configuration rather than the 4s23d4 configuration predicted by the aufbau principle, and copper is 4s13d10 rather than 4s23d9. In Chapter 7, we attributed these anomalies to the extra stability associated with half-filled subshells. Because the ns and (n − 1) d subshells in these elements are similar in energy, even relatively small effects are enough to produce apparently anomalous electron configurations.
Table 11: Valence Electron Configurations of the First-Row Transition Metals | |||||||||
Sc | Ti | V | Cr | Mn | Fe | Co | Ni | Cu | Zn |
4s23d1 | 4s23d2 | 4s23d3 | 4s13d5 | 4s23d5 | 4s23d6 | 4s23d7 | 4s23d8 | 4s13d10 | 4s23d10 |
Electron–electron repulsions inside the 4d subshell in second-row transition metals cause additional abnormalities in electron configurations that are difficult to predict. Nb and Tc, with atomic numbers 41 and 43, have a half-filled 5s subshell, with valence electron configurations of 5s14d4 and 5s14d6, respectively. Further problems arise in third-row transition metals, where the energies of the 4f, 5d, and 6s orbitals are extremely similar. While La has a valence electron configuration of 6s25d1, the next part, Ce, has a valence electron configuration of 6s25d04f2. Added electrons join the 4f subshell from this point via element 71, giving rise to the 14 elements known as the lanthanides. Following the filling of the 4f subshell, the 5d subshell is occupied, resulting in the third row of transition metals. The actinides have three subshells (7s, 6d, and 5f) that are so close in energy that their electron configurations are even more unstable in the seventh century.
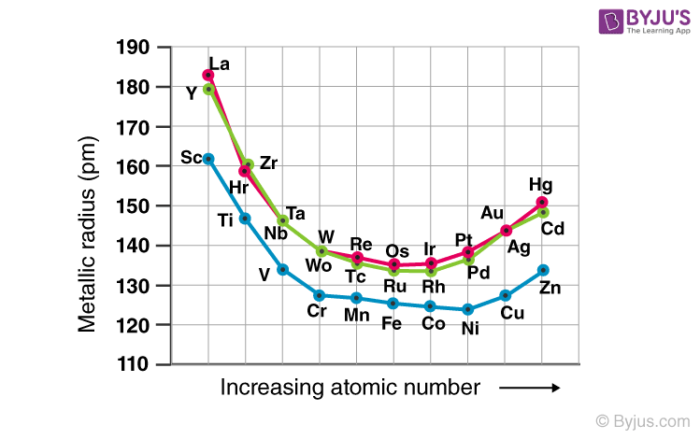
The size of neutral atoms in the d-block elements gradually decreases from left to right across a row, as seen in the s-block and p-block elements, due to an increase in the effective nuclear charge (Zeff) with increasing atomic number. Furthermore, as with the s and p blocks, the atomic radius increases as one moves down the group. The increase in size between the 3d and 4d metals, however, is much greater than the increase in size between the 4d and 5d metals due to lanthanide contraction (Figure 23.1). Ionic radii show the results of lanthanide contraction, which explains why, for example, there is only a small rise in radius from Mo3+ to W3+.
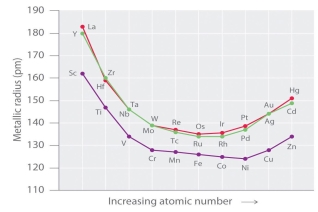
Figure: The Metallic Radii of Transition Metals in the First, Second, and Third Rows. The second- and third-row transition metals are very close in size due to lanthanide contraction.
Since electrons in the (n 1) d and (n 2) f subshells are only marginally efficient at shielding the nuclear charge, the effective nuclear charge encountered by valence electrons in the d-block and f-block elements does not change significantly as the nuclear charge increases across a row. As a result, the ionisation energies of these elements gradually increase over a row (Figure 22). Furthermore, as we move from the top left to the bottom right corner of the d block, electronegativities rise, densities and electrical and thermal conductivities rise, and enthalpies of hydration of metal cations fall, as shown in Figure 22. From left to right across a row, the transition metals become increasingly less reactive and more "noble" in character, following this pattern. The noble character of metals like Pt and Au is largely due to their high ionisation energies and electronegativities, as well as their low hydration enthalpies.
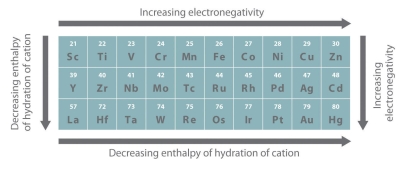
Some Property Trends in Transition Metals. From left to right and top to bottom of the d block, the electronegativity of the elements increases while the Figure: hydration energies of the metal cations decrease. As a result, the metals in the d block's lower right corner are known as the "noble metals" because they are so inert.
Trends in Transition Metal Oxidation States
For several transition metals, the similarity in ionisation energies and the relatively small rise in successive ionisation energies leads to the formation of metal ions of the same charge. This leads to extensive horizontal chemistry similarities, which are most evident in the first-row transition metals, lanthanides, and actinides. As a result, all first-row transition metals except Sc form stable compounds containing the 2+ ion, and all except Zn form stable compounds containing the 3+ ion due to the slight difference between their second and third ionisation energies. Many transition metals have several oxidation states divided by a single electron due to the slight rise in successive ionisation energies. Manganese, for example, forms compounds in all oxidation states from 3 to 7. High oxidation states become increasingly less stable for the elements on the right side of the d block as ionisation potentials increase slowly but steadily over a chain. Many, if not most, transition metal compounds are paramagnetic, with one to five unpaired electrons, due to the existence of several oxidation states separated by a single electron. This behaviour contrasts sharply with that of the p-block elements, where the presence of two oxidation states separated by two electrons is typical, making nearly all p-block element compounds diamagnetic.
Due to a small increase in successive ionization energies, most of the transition metals have multiple oxidation states separated by a single electron.
The majority of transition metal compounds are paramagnetic, while nearly all p-block element compounds are diamagnetic.
From Sc (1.4) to Cu (1.9), the electronegativities of the first-row transition metals increase smoothly. As a result, Sc is a very active metal, while Cu is much less so. The normal reduction potentials for the reaction M2+(aq) + 2e M0(s) become gradually less negative from Ti (E° = 1.633 V) to Cu (E° = +0.34 V), reflecting the steady increase in electronegativity: thus E° for the reaction M2+(aq) + 2e M0(s) becomes progressively less negative from Ti (E° = 1.633 V) to Cu (E° = +0.34 V). Exceptions to the overall patterns are popular, and many of them can be attributed to the stability associated with filled and half-filled subshells. Zinc, for example, has a strong propensity to shape the stable Zn2+ ion, which has a 3d10 electron configuration, while Cu+, which has a 3d10 electron configuration as well, is the only stable monocation created by a first-row transition metal. Similarly, Mn2+ (3d5) is much more difficult to oxidise than Fe2+ with a half-filled subshell (3d6). The chemistry of manganese is thus dominated by the Mn2+ ion, while the chemistry of iron is dominated by both the Fe2+ and Fe3+ ions.
The loss of the metal's ns electrons causes the transition metals to form cations, despite the fact that the ns orbital has a lower energy than the (n 1) d subshell in neutral atoms. The slight energy difference between the ns and (n 1) d orbitals, as well as screening effects, cause this obvious inconsistency. The relative energies of the ns and (n 1) d subshells are reversed when one or more electrons are lost, making the latter have a lower energy. As a result, as shown in Table 23.2 for the 2+ ions of the first-row transition metals, all transition-metal cations have dn valence electron configurations.
All transition-metal cations have dn electron configurations; the ns electrons are always lost before the (n − 1) d electrons.
Table 11: d-Electron Configurations of the Dictations of the First-Row Transition Metals | ||||||||
Ti2+ | V2+ | Cr2+ | Mn2+ | Fe2+ | Co2+ | Ni2+ | Cu2+ | Zn2+ |
d2 | d3 | d4 | d5 | d6 | d7 | d8 | d9 | d10 |
Table 33 shows the most common oxidation states of the first-row transition metals. Transition metals in the second and third rows behave similarly, but there are three main differences:
1. For the second- and third-row transition metals in groups 3–8, the maximal oxidation states increase from +3 for Y and La to +8 for Ru and Os, corresponding to the formal loss of both ns and (n 1) d valence electrons. The maximal oxidation state gradually decreases as we move further to the right, eventually reaching +2 for group 12 elements (Zn, Cd, and Hg), which corresponds to a filled (n 1) d subshell.
2. As a group progresses, higher oxidation states become more stable. The chromate ion ([CrO4]2), for example, is a strong oxidant, while the tungstate ion ([WO4]2) is highly stable and has no ability to behave as an oxidant.
3. Second- and third-row transition metal cations in lower oxidation states (+2 and +3) are far more readily oxidised than their first-row counterparts. The most stable chromium compounds are Cr (III), while the corresponding Mo (III) and W(III) compounds are highly reactive. In reality, they are often pyrophoric, igniting when exposed to oxygen in the air. As we'll see, the heavier elements in each group form stable compounds in higher oxidation states that don't have analogues in the group's lightest member.
As we progress from group 3 to group 8, the highest possible oxidation state, which corresponds to the formal loss of all valence electrons, becomes increasingly unstable, and it is never observed in later classes.
The stability of higher oxidation states increases down a column in transition metals.
Table 3: Common Oxidation States of the First-Row Transition Metals* | ||||||||||
| Sc | Ti | V | Cr | Mn | Fe | Co | Ni | Cu | Zn |
*The convention of using roman numerals to indicate the oxidation states of a metal is used here. | ||||||||||
electronic structure | s2d1 | s2d2 | s2 d3 | s1d5 | s2d5 | s2d6 | s2d7 | s2d8 | s1d10 | s2d10 |
oxidation states |
|
|
| I |
|
|
|
| I |
|
| II | II | II | II | II | II | II | II | II | |
III | III | III | III | III | III | III | III | III |
| |
| IV | IV | IV | IV | IV | IV | IV |
|
| |
|
| V | V | V | V | V |
|
|
| |
|
|
| VI | VI | VI |
|
|
|
| |
|
|
|
| VII |
|
|
|
|
| |
Binary transition-metal compounds, such as oxides and sulphides, are mostly written with idealised stoichiometries, such as FeO or FeS, but they are usually cation deficient and almost never have a 1:1 cation: anion ratio. As a result, a substance like ferrous oxide is a nonstoichiometric compound with a wide variety of compositions.
The acid–base character of transition-metal oxides is highly influenced by the metal's oxidation state and ionic radius. Lower oxidation state metal oxides (less than or equal to +3) have a significant ionic character and appear to be basic. Higher oxidation state metal oxides, on the other hand, are more covalent and acidic, often dissolving in solid bases to form oxoanions.
Key Takeaways
2.2.1 Catalytic properties of transition metals and its application:
Catalysts are substances that change the rate of a chemical reaction without changing themselves. As compared to the amount of reactants, the amount of catalyst used for any given reaction is usually very small. Catalysts are divided into two categories: positive catalysts that speed up reactions and negative catalysts that slow down reactions. Transition metals and their oxides are used as catalysts in a variety of chemical reactions. Transition metals and their derivatives, such as iron, cobalt, nickel, platinum, chromium, and manganese, are commonly used catalysts in today's industries. Here is a representation of transition metals in the periodic table:

2.2.2 Explanation for behaviour of catalyst
Transition metals exhibit catalytic behaviour for a variety of reasons:
1. The existence of unoccupied d orbitals.
2. They have the ability to display a wide range of valencies.
3. They have a proclivity for forming complicated compounds.
Since transition metals have a propensity to exhibit variable valency and form complexes, they form unstable intermediates with their reactants. The reaction will take a different direction with a lower activation energy because of the unstable intermediate produced during the reaction. The rate of the reaction increases as the activation energy is reduced. Later in the reaction, these unstable intermediates decompose to give the final product, and the catalyst is regenerated. Finely divided catalysts are often used because they have a larger surface area for the reaction to take place. The reactant molecules are absorbed on the surface due to the wide surface area, which provides free valencies. A large surface allows more reactant molecules to travel closer together and combine, increasing the rate of reaction.
2.2.3 Applications
Catalysts are used in almost every reaction that is used in industry for industrial purposes. Catalysts are used in the following reactions:
1. Finely divided nickel is used as a catalyst in hydrogenation reactions. The catalyst is primarily used to hydrogenate oil for the production of vegetable ghee.
2. Finely divided iron is used as a catalyst in Haber's method to synthesise ammonia.
3. V2O5 is used in the Contact phase to produce H2SO4.
4. TiCl4 is used in the production of high-density polyethylene (HDPE).
We've learned about transition elements' catalytic properties, how they're used in the production of different materials, and why they behave this way. Download BYJU'S – The Learning App for any more questions on any subject and have fun learning.
2.2.4 Magnetic Properties of Coordination Compounds
The ability of transition metals to form magnets is an intriguing property. Unpaired electrons in metal complexes make them magnetic. This magnetism may be due to the presence of unpaired d electrons, since the last electrons are in the d orbitals. Unpaired electrons occur in monometallic complexes when the complex has an odd number of electrons or when electron pairing is destabilised.
Monomeric Ti (III) species, for example, have one d electron and must be (para)magnetic, regardless of ligand geometry or existence. Ti (II) forms certain complexes with two unpaired electrons and others with none when it has two d electrons.
Fe, for instance, tends to live as Fe3+ and has a coordination number of six. Since Fe3+ has five d electrons in its structure, we can expect to see five unpaired spins in Fe complexes. This is correct for [FeF6]3-, but [Fe (CN)6]3- has only one unpaired electron, rendering it a weaker magnet. The properties of the ligands can be used to clarify this pattern. Since we expect CN to have a stronger electric field than F, the energy differences in the d orbitals for the cyanide complex should be greater.

Crystal field theory splitting diagram
Electronic properties of ligands influence d orbital splitting in this example. This diagram illustrates the difference between low-spin and high-spin electrons.
There must be some kind of energy gain of providing paired spins for our cyanide complex in order for this to make sense. That is, the difference in energy levels must be greater than the repulsive energy of electron pairing. Since systems aim for the lowest possible energy, electrons can pair up before progressing to higher orbitals. Low spin refers to an electron moving down before pairing, while high spin refers to an electron moving up before pairing.
Since none of the ligands are in the plane of the orbitals, tetrahedral complexes have inherently weaker splitting. As a result, they have either too many or too few d electrons to be concerned with low or high spin. Transition metals with eight d electrons, on the other hand, are the only source of square planar compounds. [Pt (NH3)3Cl] +, [PtCl4]2-, and [Ni (CN)4]2- are all diamagnetic.
We may infer that square planar compound are always low spin and thus weakly magnetic since this covers the entire range of ligand strength. The condition is more complicated in bi- and polymetallic complexes where the individual centres have an odd number of electrons or the electrons are high-spin.
The electrons may pair, resulting in a weak magnet, or they may reinforce each other if the two (or more) metal centres interact. The two (or more) individual metal centres behave as if they are two different molecules when there is no interaction.
Key takeaway:
They have the potential to exhibit variable valencies and a propensity to shape complex compounds due to the existence of vacant d orbitals.
In addition to Pourbaix diagrams, Latimer and Frost diagrams are two other types of redox stability diagrams. While both of these diagrams contain similar details, one might be more useful in a particular situation than the others.
Latimer and Frost diagrams are used to estimate stability in higher and lower oxidation states, usually at a single pH. Pourbaix diagrams aid in the comprehension of pH-dependent equilibria, which are often linked to solubility equilibria and corrosion (which will be talked about more later).
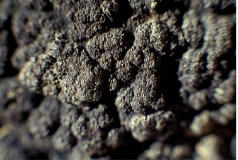
Manganese nodules on the sea floor contain Mn in oxidation states 2+, 3+, and 4+.
2.3.1 Latimer diagrams:
For substances with multiple oxidation states, latimer diagrams are the simplest and most compact way to describe electrochemical equilibria. For successive redox reactions (from highest to lowest oxidation state), electrochemical potential values are written under normal conditions in either strong acid ([H+] = 1 M, pH 0) or strong base ([OH-] = 1 M, pH 14). In a Latimer diagram, the oxidation states of successive substances may differ by one or more electrons. Difference determines the oxidation state of the element undergoing redox; we give the oxygen atoms an oxidation state of -2 and the hydrogen atoms an oxidation state of +1.
Example:
Mn in Acid

The Latimer diagram for Mn illustrates its standard reduction potentials (in 1 M acid) in oxidation states from +7 to 0.
The Latimer diagram compresses into shorthand notation all the standard potentials for redox reactions of the element Mn. For example, the entry that connects Mn2+ and Mn gives the potential for the half-cell reaction:
Mn2+(aq) +2e−⟶Mn(s) E1/2° = -1.18V
and the entry connecting Mn4+ and Mn3+ represents the reaction:
MnO2(s)+4H+(aq) +e−⟶Mn3+(aq) +2H2O(l)
MnO2(s)+4H(aq)++e−⟶Mn(aq)3++2H2O (l), E1/2° = +0.95V
We can also calculate values for multi-electron reactions by first adding ΔG°(=-nFE°) values and then dividing by the total number of electrons
For example, for the 5-electron reduction of MnO4- to Mn2+, we write
Eo=1(0.564) +1(0.274) +1(4.27) +1(0.95) +1(1.51)5=+1.51V
and for the three-electron reduction of MnO4-(aq) to MnO2(s),
Eo=1(0.564) +1(0.274) +1(4.27)3=+1.70V
Remember to divide by the number of electrons involved in the oxidation number change (5 and 3 for the above equations).
2.3.2 Thermodynamically stable and unstable oxidation states
An unstable species on a Latimer diagram will have a lower standard potential to the left than to the right.
Example:
2MnO4-3⟶MnO2+MnO4-2 the MnO43- species is unstable
Eo=+4.27−0.274=3.997V (spontaneous disproportionation)
Which Mn species are unstable with respect to disproportionation?
MnO43- 5+ → 6+,4+
Mn3+ 3+ → 4+,2+
So stable species are: MnO4-, MnO42-, MnO2, Mn2+, and Mn0.
But MnO42- is also unstable - why?
MnO2-4⟶MnO2−⟶MnO2
2MnO2-4⟶2MnO-4+MnO-2⟶2MnO4-+MnO2 E° = 2.272 - 0.564 = +1.708 V
Moral: All possible disproportionation reactions must be considered in order to determine stability (this is often more convenient with a Frost diagram).
2.3.3 Frost diagrams:
We plot G°F (= nE°) vs. oxidation number in a Frost diagram. The nE° value for the zero-oxidation state is zero.
The plot clearly distinguishes between stable and unstable oxidation states. The line connecting unstable compounds to their neighbours is higher on the plot than the line connecting stable compounds to their neighbours. This is only a graphical representation of how we used the Latimer diagram to figure out which oxidation states were stable and which were unstable.
The slope of the line connecting the two species on a Frost diagram determines the normal potential for any electrochemical reaction. On the Frost diagram, the line connecting Mn3+ and MnO2 has a slope of +0.95, which is the normal potential of MnO2 reduction to Mn3+. In the Latimer diagram for Mn, this is the number written above the arrow. By connecting the dots in a Frost diagram, multielectron potentials can be easily measured.
Key takeaway:
References:
1. J. M. Chilton and J. J. Fardy, J. Inorg. Nucl. Chem., Vol. 31, 1171-1177, (1969).
2. N. A. Talvitie, Anal. Chem., Vol. 43, p 1827, (1971).
3. N. Shinohara and N. Kohno, J. Nucl. Sci. & Techol., Vol. 34(4), 398-401, (1997).
5. M. Y. Suh, et al. KAERI/TR-2354/2003, (2003).
5. M. V. Ramaniah, et al., BARC-736, (1974).
6. F. Nelson et al., J. Chromatog. 14, 258-260 (1964).