Unit - 2
Boolean algebra
2.1.1 De Morgan’s Theorem
The equivalency of the NAND and NOR gates may be determined using De Morgan's Theorem and Laws.
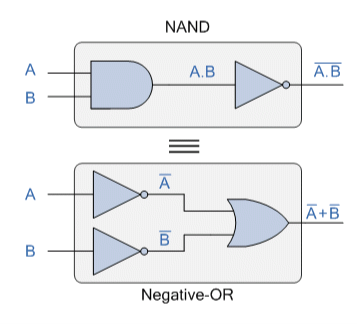
As we've seen, Boolean Algebra employs a collection of laws and rules to define the operation of a digital logic circuit, with "0's" and "1's" representing digital input and output conditions, respectively. These zeros and ones are used in Boolean Algebra to generate truth tables and mathematical formulas that explain the digital operation of logic AND, OR, and NOT (or inversion), as well as other logical operations like the XOR (Exclusive-OR) function.
While George Boole's set of laws and rules enable us to analyse and simplify a digital circuit, two of them are attributed to Augustus DeMorgan (a nineteenth-century English mathematician) and treat the logical NAND and NOR operations as separate NOT AND and NOT OR functions.
But, before we go into DeMorgan's Theory, let's review the fundamental logical operations. A and B are logic (or Boolean) input binary variables whose values can either be "0" or "1," resulting in four potential input combinations: 00, 01, 10, and 11.
Truth Table for Each Logical Operation
Input Variable | Output Conditions | ||||||
A | B | AND | NAND | OR | NOR |
|
|
0 | 0 | 0 | 1 | 0 | 1 |
|
|
0 | 1 | 0 | 1 | 1 | 0 |
|
|
1 | 0 | 0 | 1 | 1 | 0 |
|
|
1 | 1 | 1 | 0 | 1 | 0 |
|
|
The following table lists typical logic functions and their Boolean equivalents, where a “.” (dot) indicates an AND (product) operation, a “+” (plus sign) indicates an OR (sum) action, and a bar over a variable indicates the complement or inverse of the variable.
Logic Function | Boolean Notation |
AND | A.B |
OR | A+B |
NOT | A |
NAND | A .B |
NOR | A+B |
2.1.2 De Morgan’s Theory
De Morgan's Theorems are two sets of rules or laws derived from Boolean expressions for AND, OR, and NOT with two input variables A and B. The input variables can be negated and transferred from one form of a Boolean function to the other form using these two principles or theorems.
The first theorem of De Morgan states that two (or more) variables NORed together are equivalent to two variables inverted (Complement) and ANDed, whereas the second theorem claims that two (or more) variables NAND together are equivalent to two terms inverted (Complement) and ORed. That is, all OR operators should be replaced with AND operators, and all AND operators should be replaced with OR operators.
De Morgan’s First Theorem
De Morgan's First Theorem states that the OR of the complements of two (or more) input variables is equivalent to the OR of the complements of the individual variables. As a result, the negative-OR function will be the equivalent of the NAND function, proving that A.B = A+B. The following table can be used to demonstrate this process.
Verifying De Morgan’s First Theorem using Truth Table
Inputs | Truth Table Outputs for Each Term | ||||||
B | A | A.B | A.B | A | B | A + B |
|
0 | 0 | 0 | 1 | 1 | 1 | 1 |
|
0 | 1 | 0 | 1 | 0 | 1 | 1 |
|
1 | 0 | 0 | 1 | 1 | 0 | 1 |
|
1 | 1 | 1 | 0 | 0 | 0 | 0 |
|
We can also show that A.B = A+B using logic gates as shown.
De Morgan’s First Law Implementation using Logic Gates
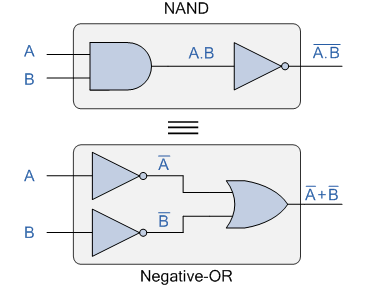
A normal NAND gate with inputs A and B can be used to build the top logic gate layout of: A.B. The two inputs are first inverted by the lower logic gate arrangement, resulting in A and B. These are then used as the OR gate's inputs. As a result, the OR gate's output becomes: A+B.
Then we can see that a NAND gate function is similar to a regular OR gate function with inverters (NOT gates) on each of its inputs. The equivalent of a NAND gate is a negative-OR, therefore an individual NAND gate may be expressed in this fashion.
De Morgan’s Second Theorem
De Morgan's Second Theorem states that the AND of the complements of two (or more) input variables is equivalent to the AND of the complements of the individual variables. As a result, the negative-AND function is the equivalent of the NOR function, establishing that A+B = A.B, which we can demonstrate using the truth table below.
Verifying De Morgan’s Second Theorem using Truth Table
Inputs | Truth Table Outputs for Each Term | ||||||
B | A | A+B | A+B | A | B | A . B |
|
0 | 0 | 0 | 1 | 1 | 1 | 1 |
|
0 | 1 | 1 | 0 | 0 | 1 | 0 |
|
1 | 0 | 1 | 0 | 1 | 0 | 0 |
|
1 | 1 | 1 | 0 | 0 | 0 | 0 |
|
We can also show that A+B = A.B using the following logic gates example.
De Morgan’s Second Law Implementation using Logic Gates
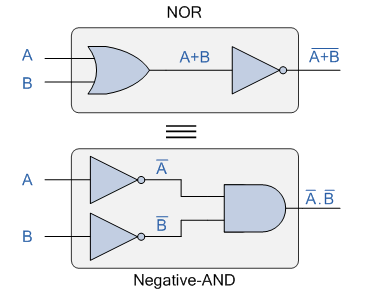
With inputs A and B, the top logic gate arrangement of: A+B can be accomplished using a normal NOR gate function. The two inputs are first inverted by the lower logic gate arrangement, resulting in A and B. As a result, the AND gate's inputs are formed. As a result, the AND gate's output becomes: A.B.
Then we can see that a conventional AND gate function with inverters (NOT gates) on each of its inputs generates an equivalent output state to a typical NOR gate function, and thus an individual NOR gate can be represented in this way as a negative-AND equivalency.
Although we have only utilised DeMorgan's theorems with two input variables A and B, they are equally true when applied to expressions with three, four, or more input variables, such as:
For a 3-variable input
A.B.C = A+B+C
And also
A+B+C = A.B.C
For a 4-variable input
A.B.C.D = A+B+C+D
And also
A+B+C+D = A.B.C.D
And so on.
2.1.3 De Morgan’s Equivalent Gates
We've shown that using De Morgan's Theorems, we can replace all of the AND (.) operators with an OR (+) and vice versa, and then complement each of the terms or variables in the expression by inverting it, converting 0s to 1s and 1s to 0s before inverting the entire function.
To make a De Morgan equivalent of an AND, NAND, OR, or NOR gate, just add inverters (NOT-gates) to all inputs and outputs, and change an AND symbol to an OR symbol or an OR symbol to an AND symbol, as indicated in the table below.
DeMorgan’s Equivalent Gates
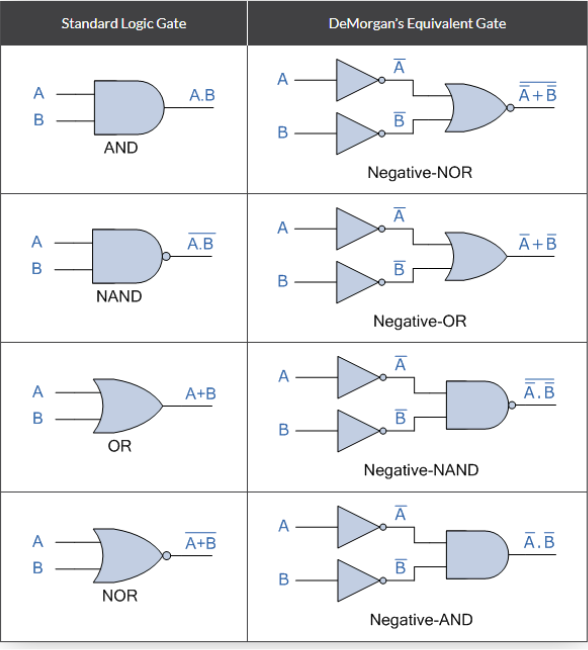
The complement of two (or more) AND'ed input variables is equivalent to the OR of the complements of these variables, and the complement of two (or more) OR'ed variables is equivalent to the AND of the complements of the variables as defined by DeMorgan, as we saw in this tutorial about DeMorgan's Thereom.
2.1.4 Boolean algebra laws
Most students are perplexed by the subject of Boolean algebra. However, if you understand the logic, it's quite straightforward. Boolean algebra is a field of mathematics in which the variables' values are either true or false, symbolised by 1 and 0 accordingly. In elementary algebra, the variables' values are represented by numbers, and the basic operations are addition and multiplication. Let's have a look at the laws of Boolean algebra in a more straightforward manner.
Boolean algebra laws are divided into six categories. They are as follows:
Commutative law, associative law, and distributive law are all terms used to describe how laws work.
AND THE LAW
OR the law
The law of inversion
These six statutes are detailed in this article.
Commutative Law
A commutative operation is defined as any binary operation that meets the following expression. The commutative law states that changing the order of the variables has no influence on the logic circuit's output.
- B = B. A
- A + B = B + A\
Associative Law
It states that the order in which the logic operations are performed is irrelevant as their effect is the same.
- ( A. B ). C = A . ( B . C )
- ( A + B ) + C = A + ( B + C)
Distributive Law
The following conditions are stated in distributive law:
- ( B + C) = (A. B) + (A. C)
- A + (B. C) = (A + B) . ( A + C)
AND Law
The AND operation is used in these laws. As a result, they're known as AND laws.
- A .0 = 0
- A . 1 = A
- A = A
- A.A¯=0
OR Law
The OR operation is used in these laws. As a result, they are known as OR laws.
- A + 0 = A
- A + 1 = 1
- A + A = A
- A+A¯=1
Inversion Law
The NOT operation is used in this law. According to the inversion law, double inversion of a variable results in the original variable.
- A+A¯¯=1
2.1.5 Boolean Algebra Rules
These Boolean algebra laws can be used to solve Boolean algebra issues. When addressing problems, there are a few boolean algebra rules to remember.
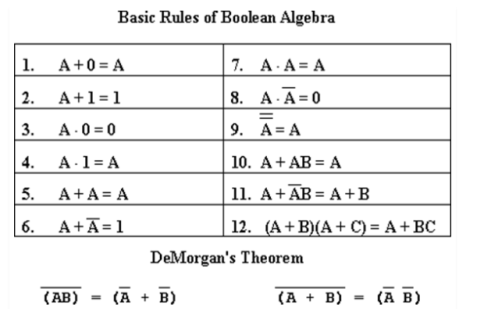
Applications of Boolean Algebra
Examples of these particular laws of Boolean algebra, rules and theorems for Boolean Algebra are given in the following table
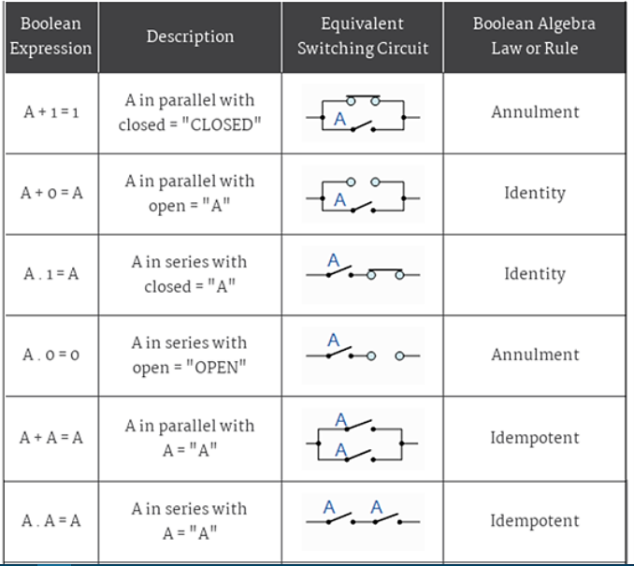
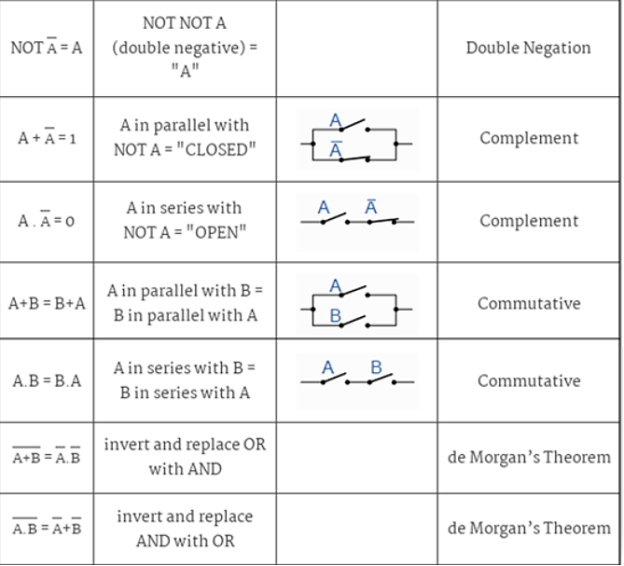
The following are some of the most important laws in Boolean algebra.
- Only two values are allowed for the variable. Binary 1 denotes HIGH, while Binary 0 denotes LOW.
- An overbar is used to represent a variable's complement. As a result, the complement of variable B is written as B. As a result, if B = 0 then B = 1, and if B = 1 then B = 0.
- A plus (+) sign between the variables indicates that they are ORed. OR-ing A, B, and C, for example, is represented as A + B + C.
- When two or more variables are logically ANDed, a dot is written between them, as in A.B.C. In some cases, such as ABC, the dot may be omitted.
Truth Table | Tautology |
Conjunction | Mathematical Logic |
Key Takeaway:
● To represent truths, Boolean variables are expressed as binary numbers: 1 = true and 0 = false. Boolean algebra deals with logistical activities, while elementary algebra deals with numerical operations.
● 1 + 1 equals 1 (since "true OR true" is true). 1 x 1 x 1 x 1 x 1 x 1 x 1 (since "true AND true" is true). A x is not equal to zero (since "true AND false" is false).
● The k-map method is used to decrease the number of logic gates necessary to realise a logical expression to the smallest achievable value. The K-map approach will be implemented in two methods, which will be discussed more in the section on Boolean expression simplification.
2.2.1 Boolean Algebra Examples
Boolean Algebra examples of how to reduce the number of digital gates using Boolean Algebra Laws
In a digital logic design, Boolean Algebra and the Laws of Boolean Algebra can be used to detect unneeded logic gates, lowering the number of gates required and saving power and money.
Digital logic functions can be defined and shown as either a Boolean Algebra expression or a logic gate truth table, as we've seen throughout this section. So here are a few instances of how we might simplify larger digital logic circuits with Boolean Algebra.
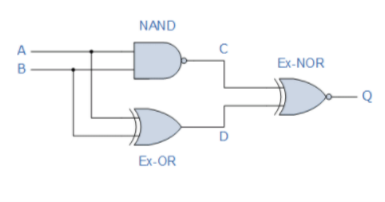
Boolean Algebra Example No1
Create a Truth Table for the logical functions at points C, D, and Q in the circuit below, and find a single logic gate that can replace the entire circuit.
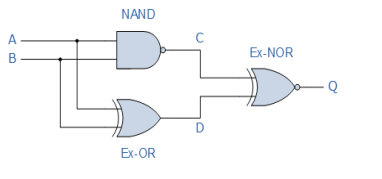
According to our initial observations, the circuit consists of a two-input NAND gate, a two-input EX-OR gate, and a two-input EX-NOR gate at the output. Because the circuit only has two inputs, A and B, there can only be four potential input combinations ( 22 ), which are 0-0, 0-1, 1-0, and 1-1. The following truth table for the entire logic circuit can be obtained by tabulating the logical functions from each gate.
Inputs | Output at | |||
A | B | C | D | Q |
0 | 0 | 1 | 0 | 0 |
0 | 1 | 1 | 1 | 1 |
1 | 0 | 1 | 1 | 1 |
1 | 1 | 0 | 0 | 1 |
Column C in the truth table above indicates the NAND gate's output function, whereas column D represents the Ex-OR gate's output function. Both of these output expressions are then used as inputs for the Ex-NOR gate at the output.
The truth table shows that when either of the two inputs A or B is at logic 1, an output at Q is present. An OR Gate is the only truth table that meets this requirement. As a result, the entire circuit above can be replaced by a single 2-input OR Gate.
Boolean Algebra Example No2
Find the Boolean algebra expression for the following system.
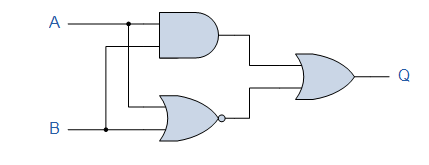
An AND Gate, a NOR Gate, and eventually an OR Gate make up the system. The AND gate's expression is A.B, while the NOR gate's expression is A+B. Both of these statements are separate inputs to the OR gate, which is denoted by the letters A+B. As a result, the final output expression is:

The system's output is Q = (A.B) + (A+B), but the notation A+B is the same as De Morgan's notation A.B. Substituting A.B into the output expression gives us Q = (A.B)+(A.B), which is the Boolean notation for an Exclusive-NOR Gate as shown in the previous section.
Inputs | Intermediates | Output | ||
B | A | A.B | A + B | Q |
0 | 0 | 0 | 1 | 1 |
0 | 1 | 0 | 0 | 0 |
1 | 0 | 0 | 0 | 0 |
1 | 1 | 1 | 0 | 1 |
The entire circuit above can therefore be replaced by a single Exclusive-NOR Gate, which is actually made up of these individual gate functions.
Boolean Algebra Example No3
For the given system, find the Boolean algebra expression.
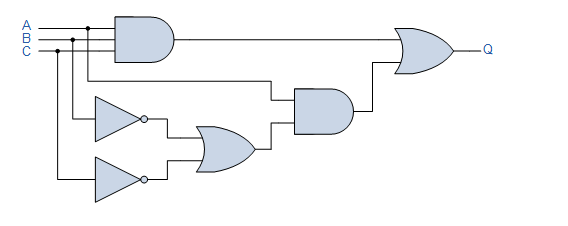
This system may appear to be more difficult to decipher than the others, but the logic circuit is made up of simple AND, OR, and NOT gates coupled together.
We may simplify the circuit by writing down the Boolean notation for each logic gate function in turn, as we did in the previous Boolean examples, to get a final expression for the output at Q.
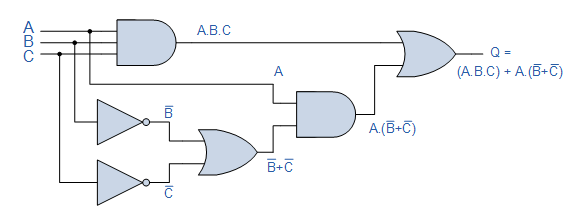
The 3-input AND gate's output is only logic "1" when ALL of the gate's inputs are HIGH at logic level "1." (A.B.C). When one or both of the lower OR gate's inputs B or C are at logic level "0," the output is just a "1." When input A is a “1” and inputs B or C are both “0,” the output of the 2-input AND gate is a “1.” The output at Q is only a "1" when the inputs A.B.C are all "1" or when A is "1" and both B and C are "0," A.(B+C).
Inputs B and C cancel out using "de Morgan's theorem," resulting in an output at Q that can be either a logic "1" or a logic "0." Then, as indicated in the table below, input A is the only input required to produce an output at Q.
Inputs | Intermediates | Output | ||||||
C | B | A | A.B.C | B | C | B+C | A.(B+C) | Q |
0 | 0 | 0 | 0 | 1 | 1 | 1 | 0 | 0 |
0 | 0 | 1 | 0 | 1 | 1 | 1 | 1 | 1 |
0 | 1 | 0 | 0 | 0 | 1 | 1 | 0 | 0 |
0 | 1 | 1 | 0 | 0 | 1 | 1 | 1 | 1 |
1 | 0 | 0 | 0 | 1 | 0 | 1 | 0 | 0 |
1 | 0 | 1 | 0 | 1 | 0 | 1 | 1 | 1 |
1 | 1 | 0 | 0 | 0 | 0 | 0 | 0 | 0 |
1 | 1 | 1 | 1 | 0 | 0 | 0 | 0 | 1 |
The complete logic circuit can then be replaced by just one single input labelled "A," resulting in a circuit of six individual logic gates being reduced to just one single piece of wire (or Buffer). This sort of circuit analysis, which uses Boolean Algebra, can quickly detect any unneeded logic gates in a digital logic design, decreasing the number of gates required, the circuit's power consumption, and, of course, the cost.
2.2.2 Boolean Algebra Operations
The following are the basic operations of Boolean algebra:
- AND operation (conjunction)
- OR or disjunction operation
- Operation of Negation or Not
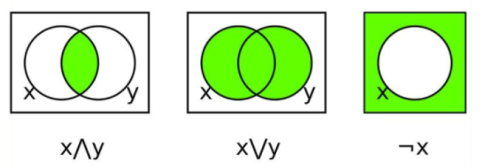
Below is the table defining the symbols for all three basic operations.
Operator | Symbol | Precedence |
NOT | ‘ (or) ¬ | Highest |
AND | . (or) ∧ | Middle |
OR | + (or) ∨ | Lowest |
If A and B are two boolean variables, then the three operations are as follows:
A conjunction B, often known as A AND B, meets the condition A B = True if A = B = True or A B = False if A = B = False.
If A = B = False, a disjunction B or A OR B satisfies A B = False, otherwise A B = True.
If A = True, Negation A or A satisfies A = False, and A = True if A = False.
2.2.3 Boolean Expression
A boolean expression is a logical statement that produces a boolean value, either True or False. Synonyms, such as ‘Yes' for ‘True' and ‘No' for ‘False,' are sometimes employed to represent the statement. In addition, digital circuits for True and False use the numbers 1 and 0.
Statements that use logical operators, such as AND, OR, XOR, and NOT, are known as Boolean expressions. As a result, writing X AND Y = True is a boolean expression.
Boolean Algebra Terminologies
Let's have a look at some of the key terms used in Boolean algebra.
Boolean Algebra: Boolean algebra is the branch of algebra that deals with logical operations and binary variables.
Boolean Variables: A boolean variable is a variable or a symbol, usually an alphabet, that expresses logical numbers such as 0 or 1.
Boolean Function: Binary variables, logical operators, constants such as 0 and 1, equal to the operator, and parenthesis symbols make up a boolean function. Literal: A literal can be a variable or a variable's complement. Complement.
The inverse of a variable, which is represented by a bar over the variable, is known as the complementarity
The truth table is a table that lists all of the potential values of logical variables as well as their combinations. The boolean equation can be transformed into a truth table. The truth table should have a number of rows equal to 2n, where “n” is the number of variables in the equation. For example, if a boolean equation has three variables, the truth table will have eight rows.
(i.e.,) 23 = 8.
2.2.4 Boolean Algebra Truth Table
Now, if we express the above operations in a truth table, we get;
A | B | A ∧ B | A ∨ B | |
True | True | True | True | |
True | False | False | True | |
False | True | False | True | |
False | False | False | False | |
A | ¬A | |||
True | False | |||
False | True | |||
2.3.1 Minterm and Maxterm
We can use the Boolean function in two different ways. The minterm canonical form and the maxterm canonical form are two of these methods.
Literal
The Boolean variables, including their complements, are denoted by a Literal. B, for example, is a boolean variable whose complements are the literals B or B'.
Minterm
Minterm is the product of all literals, whether with complement or without complement.
Example
The minterm for the Boolean variables A and B is:
- A.B
- A.~B
- ~A.B
The complement variables ~A and ~B can also be written as A' and B' respectively. Thus, we can write the minterm as:
- A.B'
- A'.B
2.3.2 Minterm from values
We can write the minterms as: Using variable values, we can write the minterms as:
1. If the variable's value is 1, the variable will be taken without its counterpart.
2. Take the complement of the variable's value if it is zero.
Example
Assume we have three Boolean variables named A, B, and C, each with the value Minterm=A.B'C'.
Let's look at another scenario in which two variables, B and C, have the same value.
B = 0
C = 1
Minterm=B'C
Shorthand notation for minterm
When Boolean variables are expressed as minterms, we know that the variables will present in the product. To get the shorthand notation for minterm, follow the steps below.
1. First, we'll write the term that includes all of the variables.
2. Next, we'll substitute 0 for all complement variables such as A or A'.
3. For all non-complement variables, such as A or b, we will write 1.
4. Finally, we'll calculate the decimal number of the binary created in the previous steps.
5. Finally, we'll express the decimal number as a letter m subscript (minterm). To further grasp the principle of shorthand notation, consider the following example.
Example 1: Minterm = AB'
1. First, we'll write the minterm: Minterm = AB' 2. Then, in place of complement variable B', we'll write 0.
A0 is the minimum term.
3. We'll substitute 1 for non-complement variable A.
10 is the minimum term.
4. The minterm AB' has a binary value of 10. (10)2 has a decimal point of 2 as its decimal point. As a result, the abbreviation AB' is
m2 is the minimum term.
Example 2: Minterm = AB'C'
1. We'll start by writing the minterm: Minterm = AB'C'
2. We'll now substitute 0 for the complement variables B' and C'.
A00 is the minimum term.
3. We'll substitute 1 for non-complement variable A.
100 is the minimum term.
4. The minterm AB'C' has a binary value of 100. (100)2 has a decimal point of four. As a result, the abbreviation for AB'C' is m4 is the minimum term.
2.3.3 Maxterm
The sum of all literals, either with complement or without complement, is known as maxterm.
Example:
The maxterm for the Boolean variables A and B will be:
- A+B
- A+~B
- ~A+B
The complement variables A and B can be expressed as A' and B', respectively, as we know. As a result, the maximum phrase above can be expressed as
- A+B'
- A'+B
Maxterm from values
We can write the maxterm as: Using the given variable values, we can write the maxterm as:
1. If the value of the variable is 1, the variable will be taken without a complement.
2. If the variable's value is 0, take the variable's complement.
Example
Let's assume that we have three Boolean variables A, B., and C having values
A=1
B=0
C=0
We'll now take the complement of the variables B and C because their values are both zero, and we'll take A without the complement. As a result, the maximum period will be:
Maxterm=A+B'+C'
Let's take another example in which we have two variables B and C having the value
B = 0
C = 1
Maxterm=B'+C
Shorthand notation for maxterm
When Boolean variables are written in the form of maxterm, we know that the variables will appear in total. The stages for maxterm are identical to those for minterm:
o First, we'll write the term that includes all of the variables.
o Next, we'll substitute 0 for all complement variables such as A or A'.
o All non-complement variables, such as A and b, will be replaced with 1.
o Now we'll calculate the decimal number of the binary created in the previous phases.
o Finally, we'll express the decimal number as a letter subscript. M stands for maximum term.
To further grasp the principle of shorthand notation, consider the following example.
Example 1: Maxterm = A+B'
1. We'll start by writing the minimum term: Maxterm = A+B'
2. We'll now substitute 0 for the complement variable B'.
3. We'll substitute 1 for non-complement variable A.
4. The maximum term A+B' has a binary value of 10. (10)2 has a decimal point of 2 as its decimal point. As a result, the abbreviation for A+B' is
M2 is the maximum term.
5. = A+B'+C’
6. We'll start by writing the maximum term:
A+B'+C' Equals Maxterm
7. Now, in place of complement variables B' and C', we'll write 0.
8. We will substitute 1 for non-complement variable A.
9. The maximum phrase A+B'+C' has a binary value of 100. (100)2 has a decimal point of four. As a result, A+B'+C' has a maximum term of m4.
2.3.4 Minterm vs Maxterm Solution
So far, we've been solving logic reduction problems with Sum-Of-Product (SOP) solutions. There is a Product-Of-Sums (POS) solution for each of these SOP solutions, which may be more beneficial depending on the application.
We need to teach some new terms before we can start on a Product-Of-Sums solution. The approach for mapping product words outlined below is not unique to this chapter.
We simply want to provide a formal technique for minterms that can be compared to the new procedure for maxterms.
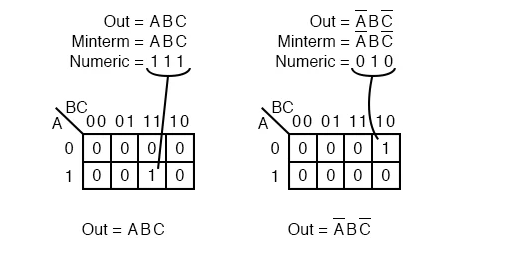
Minterm
In a Karnaugh map, or truth table, a minterm is a Boolean expression that returns 1 for the output of a single cell and 0s for all other cells. A minterm with a single 1 and the rest of the cells as 0s appears to cover a minimum of 1s.
The minterm ABC, a single product term, is shown as a single 1 in a map of 0s in the picture above left. We haven't shown the 0s in our Karnaugh maps until now because it's traditional to leave them out unless they're absolutely necessary. Above right, you can see another minterm, A'BC'.
The important thing to remember is that the cell's address matches to the minterm being mapped. That is, the minterm ABC above left corresponds to cell 111.
The minterm A'BC' immediately relates to cell 010, as seen to the right. Multiple minterms can exist in a Boolean expression or map.
Let's describe the technique for placing a minterm in a K-map using the preceding diagram:
Determine the minimum term (product term) to be mapped.
Write the binary numeric value that corresponds.
Place a 1 in the K-map using a binary value as an address.
Carry on with the steps for the remaining minterms (P-terms within a Sum-Of-Products).
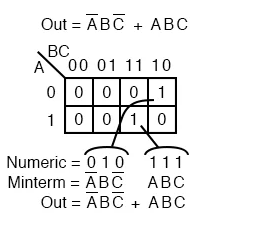
A Boolean expression will almost always contain many minterms, each of which corresponds to numerous cells in the above-mentioned Karnaugh map. The individual minterms explored in the previous figure are represented by several minterms in this map.
The 1s emerge from the K-map as a binary cell address, which transforms immediately to one or more product terms.
By directly, we mean that a 0 denotes a complemented variable and a 1 denotes a true variable. For example, 010 translates to A'BC'.
In this case, there was no reduction. The minterms do, however, produce a Sum-Of-Products result.
Let's recap the technique for writing the Sum-Of-Products reduced Boolean equation from a K-map using the following diagram:
Form the largest feasible groups of 1s, covering all minimum terms. The number of people in a group must be a power of two.
For each group, write a binary numeric value.
Convert a binary value to a word for a product.
Steps should be repeated for the other groupings. Within a Sum-Of-Products, each group produces p-terms.
So yet, nothing has changed; a formal protocol for dealing with minterms has been put down. This can be used as a template when working with maxterms.
The Boolean function, which returns 0 for a single cell and 1 for all others, is next.
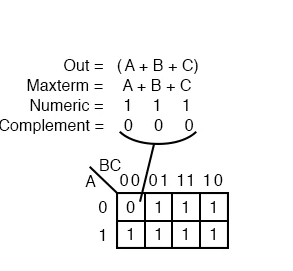
Maxterm
A maxterm is a Boolean expression that returns 1s for all other cells in the Karnaugh map, or truth table, and 0s for the output of a single cell expression. The maxterm (A+B+C), a single sum term, is shown as a single 0 in a map of 1s in the picture above left.
A maxterm with a single 0 and all other cells being 1s appears to cover a maximum area of 1s.
Now that we're working with something new, maxterms, there are some distinctions. In the Karnaugh map, the maxterm is a 0, not a 1. In our case, a maxterm is a sum term (A+B+C), not a product term. It also appears to be odd that (A+B+C) is mapped to cell 000
All three variables (A, B, and C) must be equal to 0 for the equation Out=(A+B+C)=0 to work. Only (0+0+0)=0 will result in a zero. As a result, we put our single 0 for minterm (A+B+C) in cell A,B,C=000 in the K-map, where all of the inputs are zero.
This is the only circumstance in which our maxterm will be 0. Because any input value other than ((0,0,0) for (A+B+C) gives 1s when evaluated, all other cells contain 1.
According to the diagram above, the technique for inserting a maxterm into the K-map is as follows:
Determine the Sum term that will be mapped.
Write the binary numeric value that corresponds.
Assemble the supplement
Place a 0 in the K-map using the complement as an address.
Rep for the remaining maxterms (Sum terms within Product-of-Sums expression).
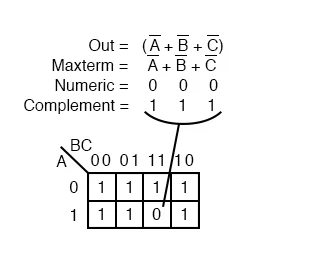
Above is another maxterm, A'+B'+C'. A'+B'+C' is represented by the number 000. 111 is the complement. As illustrated above, in cell (1,1,1) of the K-map, place a 0 for maxterm (A'+B'+C').
Why does (A'+B'+C') result in a 0 in cell 111? We have the only condition that will give us a 0 when A'+B'+C' is (1'+1'+1'), all 1s in, which is (0+0+0) after taking complements. When all the 1s are combined with all the 0s, the result is 0 when ORed.
2.3.5 Min and Max Terms Notation in Boolean Algebra
Minterm
A minterm is one of the product terms in the canonical SOP form. Minterm is expressed as a binary number with 0s and 1s. Each non-complemented variable is represented by 1 and each complemented variable is represented by 0, and the decimal equivalent of this binary word is written as a subscript of m as m0, m1, m2, etc. The (sigma) notation is commonly used to represent minterms.
Maxterm
A maxterm is one of the sum terms in the canonical POS form. Maxterm can alternatively be expressed in binary integers, with each non-complemented variable denoted by 0 and each complemented variable denoted by 1, and the decimal equivalent of this binary word denoted by M0, M2, M2, and so on. The max terms are usually represented using (pi) notation.
Note: For n-variable logic function there are 2n minterms and 2n maxterms.
Min and Max terms for two literal binary expressions
Input Variable (A) | Input Variable (B) | Minterm | Minterm notation | Maxterm | Maxterm notation |
0 | 0 | A.B | m0 | A+B | M0 |
0 | 1 | A.B | m1 | A+B | M1 |
1 | 0 | A.B | m2 | A+B | M2 |
1 | 1 | A.B | m3 | A+B | M3 |
Min and Max terms for three literal binary expressions
Input Variable (A) | Input Variable (B) | Input Variable (C) | Minterm | Minterm notation | Maxterm | Maxterm notation |
0 | 0 | 0 | A.B.C | m0 | A+B+C | M0 |
0 | 0 | 1 | A.B.C | m1 | A+B+C | M1 |
0 | 1 | 0 | A.B.C | m2 | A+B+C | M2 |
0 | 1 | 1 | A.B.C | m3 | A+B+C | M3 |
1 | 0 | 0 | A.B.C | m4 | A+B+C | M4 |
1 | 0 | 1 | A.B.C | m5 | A+B+C | M5 |
1 | 1 | 0 | A.B C | m6 | A+B+C | M6 |
1 | 1 | 1 | A.B.C | m7 | A+B+C | M7 |
Example: Express the following in corresponding minterm and maxterm expression
- Y = ABC + A.B.C + A.B. C + A. B. C
- Y= (A+B+C) (A+ B+C) (A+ B+ C)
Solution (a):
Y = ABC + A. B.C + A.B. C + A. B. C , is an example of canonical SOP expression, so its each term can be represented in minterm notation. Therefore,
Y = ABC + A. B.C + A.B. C + A. B. C
= m7 + m3 + m5 + m4
= ∑m (3, 4, 5, 7) [ ∑ is used to denote CSOP]
(b):
Y= (A+B+C) (A+ B+ C) (A+ B+ C), is an example of canonical POS expression, so its each term can be represented in maxterm notation.
Y= (A+B+C) (A+ B+ C) (A+ B+ C)
= M0 + M5 + M7
= ∏M (0, 5, 7) [ ∏ is used to denote CPOS]
Note: If a truth table is provided and the result is 1, it corresponds to minterm; if the output is 0, it corresponds to 0.
Input Variable (A) | Input Variable (B) | Input Variable (C) | Output (Y) |
0 | 0 | 0 | 0 |
0 | 0 | 1 | 0 |
0 | 1 | 0 | 1 |
0 | 1 | 1 | 0 |
1 | 0 | 0 | 0 |
1 | 0 | 1 | 1 |
1 | 1 | 0 | 1 |
1 | 1 | 1 | 1 |
In the above truth table, the minterms will be m2, m5, m6 and m7 i.e.,
F = ∑m (2, 5,6, 7)
And maxterms will be M0, M1, M3 and M4 i.e.,
F = ∏M (0, 1, 3, 4)
Hence, from this we can conclude there is a complementary relationship between CSOP and CPOS.
The designer of digital circuits frequently starts with a truth table that describes what the circuit should perform.
The main goal of the design assignment is to figure out what kind of circuit will execute the function indicated in the truth table.
While some people appear to have a natural ability to glance at a truth table and visualise the required logic gate or relay logic circuits for the task, the rest of us can use procedural procedures.
In this case, Boolean algebra displays its worth in a dramatic way.
We should start with a practical design challenge to demonstrate this procedural way.
Assume we were tasked with creating a flame detection circuit for a hazardous waste incinerator.
The tremendous heat of the fire is meant to counteract the toxicity of the garbage that is being burned.
Medical waste that may be infected with harmful viruses or bacteria is often neutralised using combustion-based techniques:
It is safe to inject waste into the incinerator to be neutralised as long as a flame is maintained.
However, if the flame were to go out, continuing to pour waste into the combustion chamber would be dangerous since it would exit the exhaust un-neutralized, posing a health risk to anyone in close proximity to the exhaust.
What we need in this system is a reliable method of detecting the presence of a flame and allowing waste injection only if the flame detection system has "confirmed" the presence of a flame.
There are several alternative flame detection technologies: optical (light detection), thermal (high temperature detection), and electrical conduction (sensing of ionised particles in the flame path), each with its own set of benefits and drawbacks.
Assume that, due to the high risk of passing un-neutralized waste out the incinerator's exhaust, it is decided to make the flame detection system redundant (many sensors), so that the failure of a single sensor does not result in the emission of toxins out the exhaust.
Each sensor has a normally-open contact (open if no flame, closed if flame detected) that will be used to activate the logic system's inputs:
2.4.1 Converting Truth Tables into Boolean Expressions
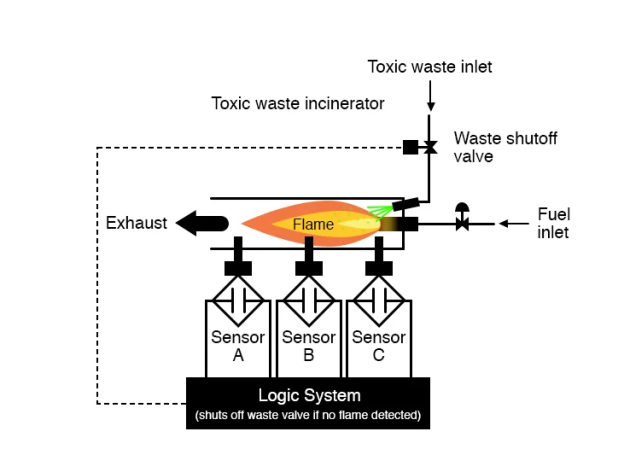
Our objective now is to construct the logic system's circuitry to open the waste valve if and only if the sensors detect a good flame.
But first, we need to figure out what this control system's logical behaviour should be.
Is it acceptable to open the valve if only one of the three sensors detects flame? Probably not, because having many sensors would defeat the point.
If any one of the sensors failed and falsely indicated the existence of flame when none existed, a logic system based on the principle of "any one out of three sensors seeing flame" would have the same result as a single-sensor system with the same failure.
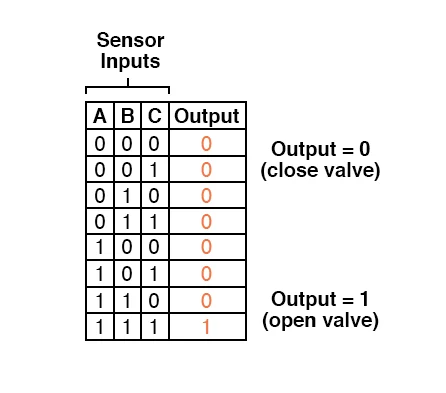
A far better option would be to programme the system such that the valve only opens if all three sensors detect a good flame.
This way, a single failed sensor incorrectly showing flame would not be able to keep the valve open; instead, this dangerous circumstance would require all three sensors to fail in the same way—a highly unlikely situation.
Thus, our truth table would look like this:
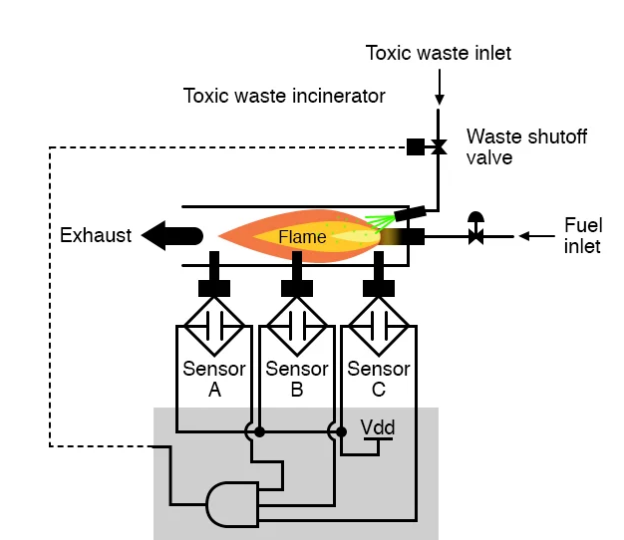
It doesn't take much imagination to recognise that this functionality may be achieved using a three-input AND gate: the circuit's output will be "high" if and only if inputs A, B, and C are all "high":
We could construct this AND function with relay circuitry by wiring three relay contacts in series, or simply by wiring the three sensor contacts in series, so that the only way electrical power can be sent to activate the waste valve is if all three sensors show flame:
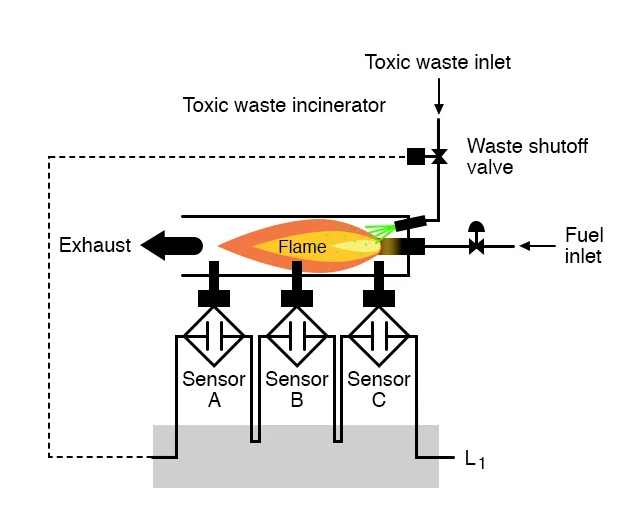
While this design method maximises safety, it also renders the system extremely vulnerable to sensor failures.
Consider what would happen if one of the three sensors failed, indicating no flame when there was a good flame in the incinerator's combustion chamber.
That single failure would cause the waste valve to close unnecessarily, wasting time and fuel (by fuelling a fire that wasn't being used to incinerate garbage).
It would be wonderful to have a logic system that allowed for this type of failure without shutting down the system unnecessarily, but also providing sensor redundancy to ensure safety if any one sensor failed “high” (showing flame at all times, whether or not there was one to detect).
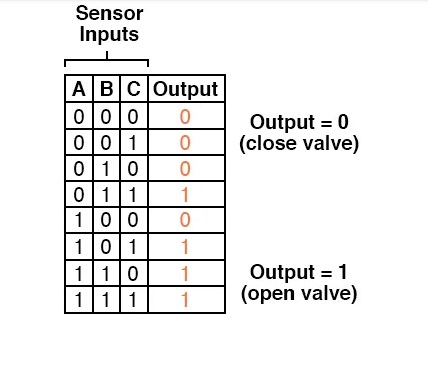
A "two out of three" sensor logic technique, in which the waste valve is opened if at least two of the three sensors show good flame, would suit both needs.
The truth table for such a system would look like this:
Using Sum-Of-Products
It's not always clear what form of logic circuit would satisfy the truth table in this case.
However, a standard form of Boolean expression known as the Sum-Of-Products, or SOP, form provides a simple approach for creating such a circuit.
A Sum-Of-Products is, as you might expect, a collection of products. Each term is a multiplicative (product) combination of Boolean variables, and a Boolean expression is precisely a set of Boolean terms put (summed) together.
An SOP expression might look something like this: The sum of the products "ABC," "BC," and "DF" is ABC + BC + DF.
Truth tables make it simple to create Sum-Of-Products expressions.
All we have to do now is look through the truth table for any rows with a “high” (1) result and write a Boolean product term that equals 1 given those input conditions.
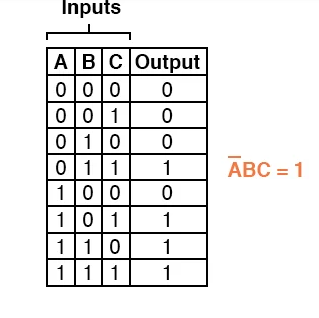
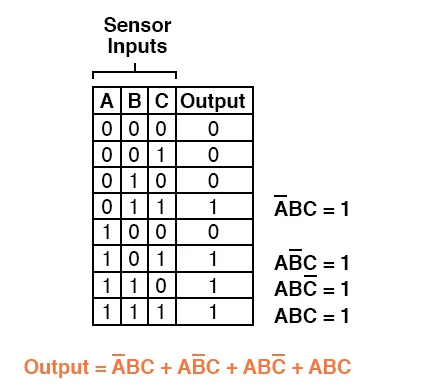
For example, the product term in the fourth row of the truth table for our two-out-of-three logic system, where A=0, B=1, and C=1, would be A'BC, since that term would have a value of 1 if and only if A=0, B=1, and C=1:
Three more rows of the truth table have an output value of 1, therefore they require Boolean product expressions as well:
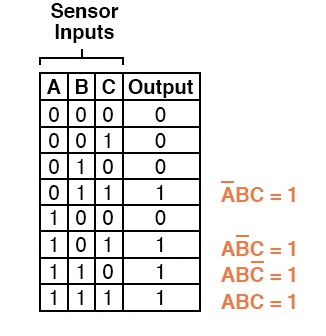
Finally, we add these four Boolean product expressions together to form a single Boolean expression that describes the truth table in its entirety:
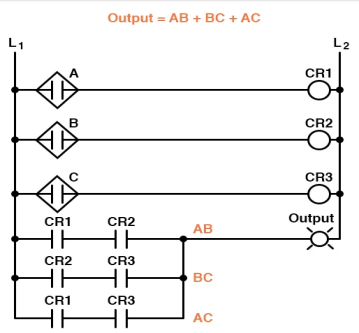
We can simply create a logic gate or relay logic circuit based on the truth table's function now that w have a Boolean Sum-Of-Products expression for it:
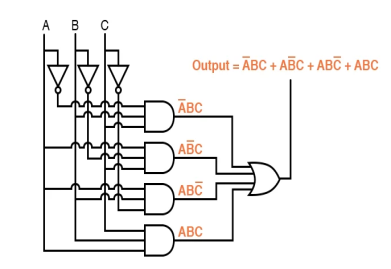
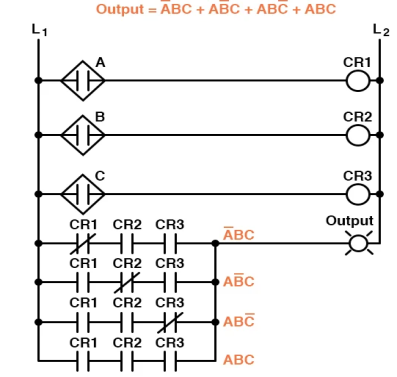
Both of these circuits, unfortunately, are fairly complex and may benefit from simplicity.
The expression can be greatly simplified using Boolean algebra techniques:
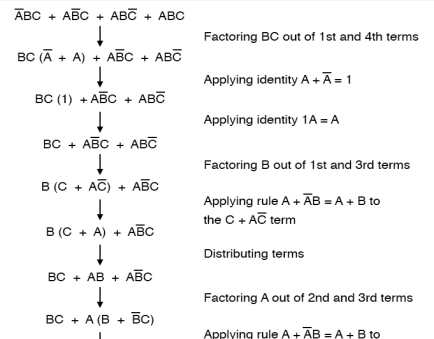
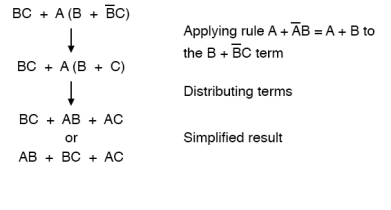
We may now create much simpler logic circuits that fulfil the same function, in either gate or relay form, as a result of the simplification:
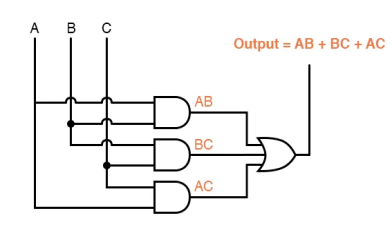
Either one of these circuits will adequately perform the task of operating the incinerator waste valve based on a flame verification from two out of the three flame sensors.
At minimum, this is what we need to have a safe incinerator system.
We can, however, extend the functionality of the system by adding to it logic circuitry designed to detect if any one of the sensors does not agree with the other two.
If all three sensors are operating properly, they should detect flame with equal accuracy.
Thus, they should either all register “low” (000: no flame) or all register “high” (111: good flame).
Any other output combination (001, 010, 011, 100, 101, or 110) constitutes a disagreement between sensors, and may therefore serve as an indicator of a potential sensor failure.
If we added circuitry to detect any one of the six “sensor disagreement” conditions, we could use the output of that circuitry to activate an alarm.
Whoever is monitoring the incinerator would then exercise judgment in either continuing to operate with a possible failed sensor (inputs: 011, 101, or 110), or shut the incinerator down to be absolutely safe.
Also, if the incinerator is shut down (no flame), and one or more of the sensors still indicates flame (001, 010, 011, 100, 101, or 110) while the other(s) indicate(s) no flame, it will be known that a definite sensor problem exists.
The first step in designing this “sensor disagreement” detection circuit is to write a truth table describing its behavior.
Since we already have a truth table describing the output of the “good flame” logic circuit, we can simply add another output column to the table to represent the second circuit, and make a table representing the entire logic system:
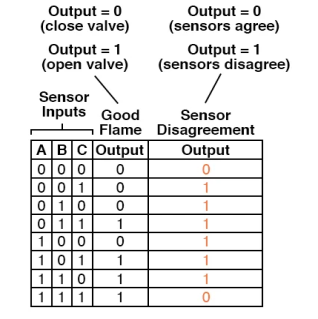
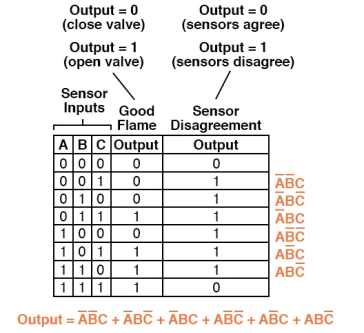
While a Sum-Of-Products formula for this new truth table column is doable, it would require six words, each with three variables!
To simplify such a Boolean statement, numerous steps would be required, with a high risk of making algebraic errors:
Using Product-Of-Sums
Instead of constructing a Sum-Of-Products expression to account for all of the truth table's "high" (1) output circumstances, a Product-Of-Sums, or POS, expression can be used to account for all of the "low" (0) output circumstances.
The final Product-Of-Sums expression should have fewer terms because there are far less instances of a "low" output in the last truth table column.
A Product-Of-Sums expression is a collection of added terms (sums) that are multiplied (producted) together.
(A + B)(C + D), the product of the amounts "A + B" and "C + D," is an example of a POS expression.
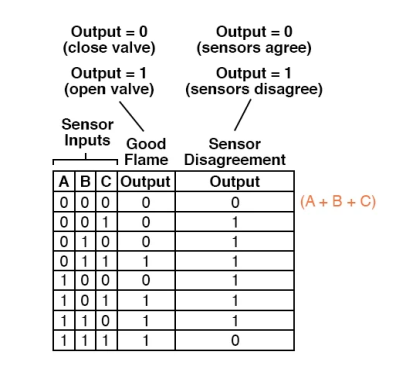
To begin, we determine which rows in the last truth table column have “low” (0) outputs and build a Boolean sum term for those rows' input conditions that equals 0.
For example, where A=0, B=0, and C=0, the sum term in the first row of the truth table would be (A + B + C), because that term would have a value of 0 if and only if A=0, B=0, and C=0:
Only one other row in the last truth table column has a “low” (0) result, thus our Product-Of-Sums expression is complete with just one more sum term.
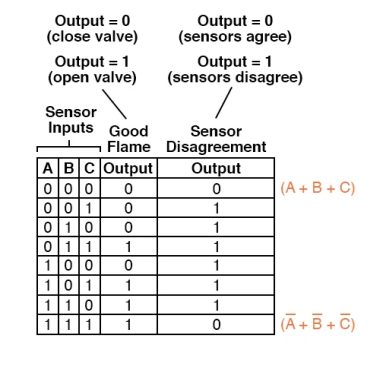
For an input condition of A=1, B=1, and C=1, this last sum term represents a 0 output.
As a result, the term must be expressed as (A' + B'+ C'), because under that condition alone, the sum of the supplemented input variables would equal 0:
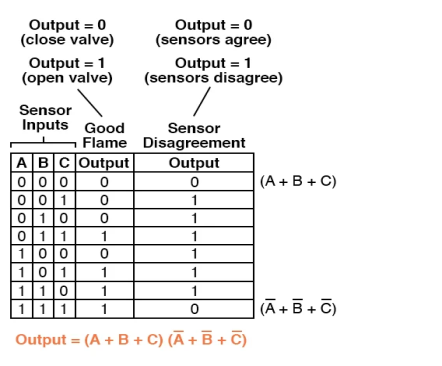
Of course, the multiplicative combination of these two sum terms yields the whole Product-Of-Sums expression:
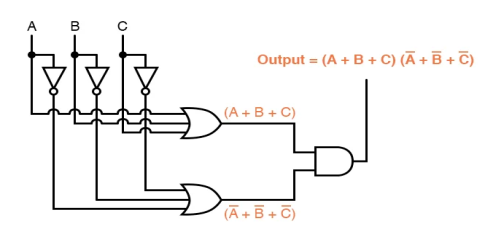
A Product-Of-Sums expression can be implemented as a collection of OR gates feeding into a single AND gate, whereas a Sum-Of-Products expression may be built as a collection of AND gates with their outputs linking to a single OR gate:
Correspondingly, whereas a Sum-Of-Products expression could be implemented as a parallel collection of series-connected relay contacts, a Product-Of-Sums expression can be implemented as a series collection of parallel-connected relay contacts:
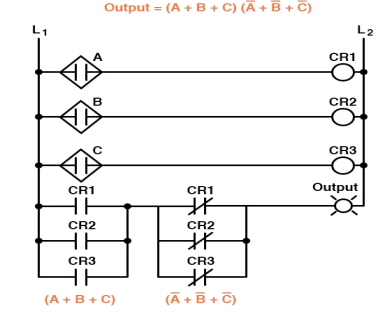
Only the “sensor disagreement” logic circuit is represented in the preceding two circuits, not the “good flame” detection circuit (s).
The complete logic system would be made up of both "good flame" and "sensor disagreement" circuits, both of which would be represented on the same figure.
The entire logic system, when implemented in a Programmable Logic Controller (PLC), might look like this:
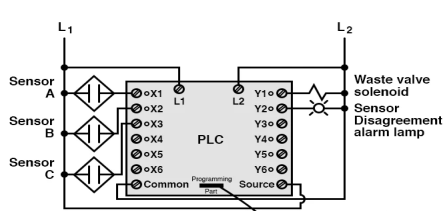
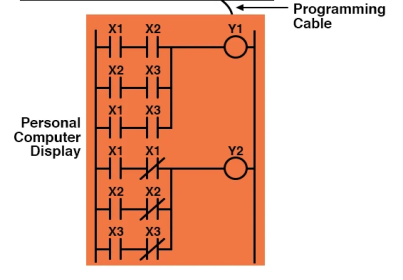
As you can see, when it comes to truth tables, both the Sum-Of-Products and Products-Of-Sums common Boolean forms are useful.
They enable us to create a Boolean expression—and, eventually, a logic circuit—from nothing more than a truth table, which is a written specification for what we want a logic circuit to perform.
It is possible to automate the design process for a digital circuit by going from a written specification to an actual circuit using simple, deterministic techniques.
To put it another way, a computer may be instructed to create a custom logic circuit based on a truth table definition.
The stages from a truth table to the finished circuit are so clear and straightforward that they require little, if any, innovation or creative idea.
2.5.1 Introduction of K-Map (Karnaugh Map)
We need to find expressions with the fewest variables in various digital circuits and practical situations. Without employing any Boolean algebra theorems, we can simply minimise Boolean expressions of 3, 4 variables using K-map. According on the needs of the situation, K-map can take two forms: Sum of Product (SOP) and Product of Sum (POS). The K-map is a table-like representation that provides more data than the TRUTH TABLE. We start by filling the grid of the K-map with 0s and 1s, then we solve it by forming groups.
Steps to solve expression using K-map-
1. Choose a K-map based on the amount of variables.
2. Determine the problem's minterms and maxterms.
3. For SOP, place 1s in K-map blocks that correspond to the minterms (0s elsewhere).
4. For POS, place 0s in K-map blocks that correspond to the maxterms(1s elsewhere).
5. Create rectangular groups with total terms in powers of two, such as 2,4,8,...(except 1), and try to include as many items as possible in each group
6. Find the product words from the groups created in step 5 and add them up for the SOP form.
2.5.2 SOP FORM
K-map of 3 variables-
Z= ∑A, B, C(1, 3, 6, 7)
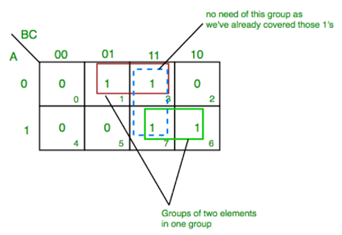
We receive the product term A'C from the red group.
We acquire the product term AB from the green group.
We derive the final phrase (A'C+AB) by adding these product terms together.
K-map for 4 variables
F(P, Q, R, S)=∑(0,2,5,7,8,10,13,15)

From red group we get product term— QS
From green group we get product term— Q’S’
Summing these product terms we get- Final expression (QS+Q’S’)
2.5.3 POS FORM
- K-map of 3 variables-
F(A,B,C)=π(0,3,6,7)
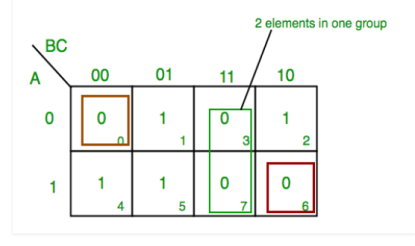
From red group we find terms
A B C’
Taking complement of these two
A’ B’ C
Now sum up them
(A’ + B’ + C)
From green group we find terms
B C
Taking complement of these two terms
B’ C’
Now sum up them
(B’+C’)
From brown group we find terms
A’ B’ C’
Taking complement of these two
A B C
Now sum up them
(A + B + C)
We will take product of these three terms: Final expression (A’ + B’ + C) (B’ + C’) (A + B + C)
2. K-map of 4 variables-
F(A,B,C,D)=π(3,5,7,8,10,11,12,13)
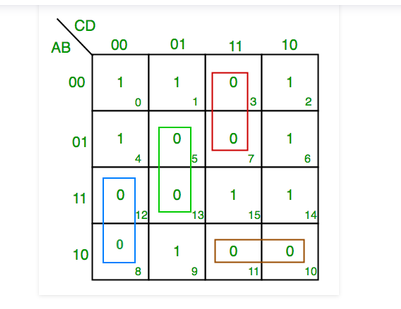
From green group we find terms
C’ D B
Taking their complement and summing them
(C+D’+B’)
From red group we find terms
C D A’
Taking their complement and summing them
(C’+D’+A)
From blue group we find terms
A C’ D’
Taking their complement and summing them
(A’+C+D)
From brown group we find terms
A B’ C
Taking their complement and summing them
(A’+B+C’)
Finally we express these as product –(C+D’+B’).(C’+D’+A).(A’+C+D).(A’+B+C’)
PITFALL– *Always remember POS ≠ (SOP)’
*The correct form is (POS of F)=(SOP of F’)
2.5.4 Karnaugh Maps, Truth Tables, and Boolean Expressions
Who Developed the Karnaugh Map?
While creating digital logic based telephone switching circuits at Bell Labs in 1953, telecommunications engineer Maurice Karnaugh invented the Karnaugh map.
The Use of Karnaugh Map
Let's put the Karnaugh map to work now that we've created it using Venn diagrams. When compared to Boolean algebra, Karnaugh maps reduce logic functions more rapidly and readily. We use the term "reduce" to signify "simplify," as in "lower the number of gates and inputs."
We prefer to reduce logic to its simplest form in order to save money by eliminating components. The smallest number of gates with the smallest number of inputs per gate is defined as the lowest cost.
When given the option, most students prefer to use Karnaugh maps instead of Boolean algebra to simplify logic.
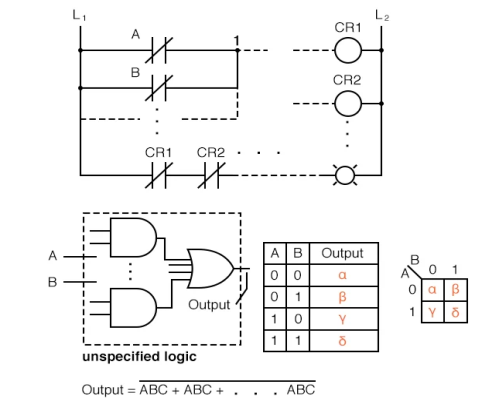
Above, we have five separate items that are simply alternative ways of describing the same thing: an arbitrary 2-input digital logic function. Relay ladder logic is the first step, followed by logic gates, a truth table, a Karnaugh map, and a Boolean equation.
The key is that any of these can be used in the same way. As the case may be, two inputs A and B can take on values of 0 or 1, high or low, open or closed, True or False. There are 22 = 4 input combinations that result in an output. This holds true for all five situations.
These four outputs can be seen on a relay ladder logic lamp, as well as a logic probe on a gate diagram. The truth table or the Karnaugh map can be used to keep track of these results. Consider the Karnaugh map to be a reshuffled truth table.
The truth table or Karnaugh map can be used to compute the output of the Boolean equation using the laws of Boolean algebra.
Should we utilise one of the five equivalent logic descriptions? The one that is most beneficial to the work at hand.
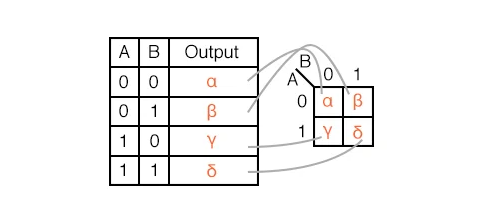
A truth table's outputs are identical to Karnaugh map entries on a one-to-one basis. The A=0, B=0 inputs produce an output starting at the top of the truth table.
Note that the A=0, B=0 cell address in the Karnaugh map, where the A=0 row and B=0 column intersect, produces the same output. Other truth table outputs from inputs AB=01, 10, 11 can be found at corresponding K-map positions.
With the use of a prior rectangular Venn diagram resembling Boolean regions, we display the adjacent 2-cell regions in the 2-variable K-map below.
2.5.5 The Karnaugh Map Boolean Algebraic Simplification Technique
Introduction
The discrete-valued digital signals are dealt with in digital electronics. In general, any electronic system based on digital logic represents the states of the variables involved in it using binary notation (zeroes and ones). As a result, Boolean algebraic simplification is an important aspect of digital electronic system design and analysis.
Although DeMorgan's theorems and Boolean algebraic rules can be utilised to accomplish the goal, the method becomes arduous and error-prone as the number of variables involved grows. This demands the use of an appropriate, relatively basic simplification methodology, such as Maurice Karnaugh's Karnaugh map (K-map), which he introduced in 1953.
A Typical K-Map
The graphical technique of simplifying Boolean statements is known as the K-map method of solving logical expressions. Because each K-map is just a new method of representing the values in a one-dimensional truth table, they're also known as 2D truth tables.
The technique of putting the values of the output variable in cells within a rectangle or square grid according to a defined pattern is known as K-maps. The number of input variables determines the number of cells in the K-map, which is mathematically represented as two raised to the power of the number of input variables, i.e. 2n, where n is the number of input variables.
As a result, a K-map with 4 (=22) cells is required to simplify a logical statement with two inputs. A four-input logical expression, for example, would result in a 16 (=24) celled-K-map.
Gray Coding
Furthermore, each cell in a K-map has a distinct place-value, which is determined using the Gray code encoding approach.
The unique feature of this code is that adjacent code values differ only by one bit. That is, if the provided code-word is 01, the prior and subsequent code-words can be 11 or 00 in any order, but they cannot be 10.
Gray code-labeling is used in K-maps to reflect the values of the associated input variables in the rows and columns of the table. This means that each K-map cell has its own Gray Code-Word to address it.
A standard 16-celled K-map, as shown in Figure 1, can be used to simplify a logical expression with four variables (A, B, C and D mentioned at its top-left corner).
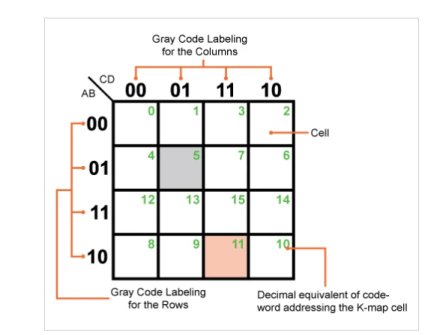
Figure: A typical but empty Karnaugh map with 16 cells
The K-rows map's and columns are labelled using 2-bit Gray code, as illustrated in the picture, which assigns a definite address to each of the map's cells.
For example, in the K-map shown, the grey coloured cell can be addressed using the code-word "0101," which is equivalent to 5 in decimal (shown as the green number in the figure) and corresponds to the input variable combination ABCD or A+B+C+D, depending on whether the input–output relationship is expressed in SOP (sum of products) or POS (product of sums) form.
Similarly, ABCD or A+B+C+D refers to the Gray code-word "1011," which is comparable to 11 in decimal (again, displayed in green in the picture), which implies we're talking about the pink-colored K-map cell.
K-Map Simplification Technique
Let's move on to the technique for developing an optimal (in terms of the amount of gates used to express the logic) digital system now that we've covered the basics of K-maps. Let's begin with a problem statement.
Example 1:
Design a digital system whose output is defined as logically low if the 4-bit input binary number is a multiple of 3; otherwise, the output will be logically high. The output is defined if and only if the input binary number is greater than 2.
Step 1: Truth Table / Canonical Expression Leading to Min- or Max-Terms
The initial stage in developing any digital system is to understand the variables that will be involved in the process, as well as their state-values. Furthermore, we must determine the number of output variables and their values for each and every combination of input literals, which can be written in the form of a truth table, based on the issue statement.
In the given example:
Number of input variables = 4, which we will call A, B, C and D.
Number of output variables = 1, which we will call Y
Where
Y = Don't Care, if the input number is less than 3 (orange entries in the truth table)
Y = 0, if the input number is an integral multiple of 3 (green entries in the truth table)
Y = 1, if the input number is not an integral multiple of 3 (blue entries in the truth table)
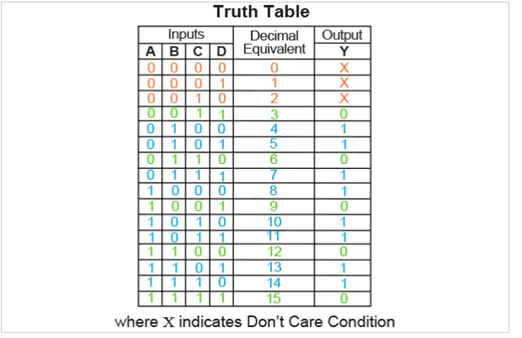
It's worth noting that, in addition to the input and output columns, the truth table also includes a column that offers the decimal equivalent of the input binary combination, making finding the minterm or maxterm expansion for the given problem a breeze. Minterm expansion will be m(4,5,7,8,10,11,13,14) + d for the given example (0,1,2)
M(3,6,9,12,15) D will be the maximum term expansion (0,1,2)
However, the logical expression to be simplified may be directly expressed in terms of SOP or POS forms in some cases. The truth table requirement can be ignored in this situation if we represent the given expression in its canonical form, from which the relevant minterms or maxterms can be calculated.
Step 2: Select and Populate K-Map
We know the number of input variables in the logical expression from Step 1, so we can determine the size of the K-map we'll need. We also know how many of these K-maps are needed to create the desired system because the number of output variables is already known. This means that for the example, we'll need a single K-map with 16 cells (due to one output variable) (as there are four input variables).
Then, one for each minterm, zero for each maxterm, and X for Don't Care terms must be filled into the K-map cells. The process must be carried out for each and every output variable. As a result, we get the K-map in Figure 2 for this example.
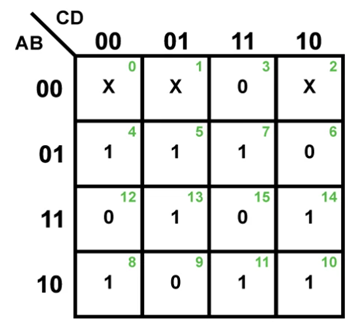
Fig: A completely filled 4-variable K-map
Step 3: Form the Groups
Because approach relies entirely on the generation of clusters, K-map simplification is sometimes known as "simplification by grouping." That is, the fundamental goal of the entire procedure is to gather as many ones (for SOP solution) or zeros (for POS solution) for each of the output variables in the problem as possible under one roof. However, we must absolutely adhere to the following norms and regulations when doing so:
The procedure must begin by grouping the bits in adjacent cells in such a way that the resulting group contains the greatest amount of selected bits. This means that for an n-variable K-map with 2n cells, try to group for 2n cells first, then 2n-1 cells, 2n-2 cells, and so on until the “group” only has 20 cells, i.e. isolated bits (if any). It's worth noting that the number of cells in the group must be an integer power of 2, i.e. 1, 2, 4, 8,...
The process must be used for all neighbouring cells in the K-map, even if they don't appear to be adjacent—the top row is considered adjacent to the bottom row, and the rightmost column is considered adjacent to the leftmost column, as though the K-map wraps around from top to bottom and right to left. For instance, in Table 1, Group 1 of SOP form solution.
A piece that appears in one group can be replicated in another group as long as the resultant group size is increased. In the SOP form solution of Table 1, for example, cell 5 is repeated in both Groups 3 and 4 since it results in the development of a group with two cells rather than a group with just one cell.
If and only if they assist in obtaining a larger group, Don't Care conditions should be considered for the grouping activity. Otherwise, they will be ignored. The Don't Care phrases in cells 0 and 1 are used to produce Group 2 of the SOP solution form, resulting in a group of four cells rather than merely two
| SOP Form Solution | POS Form Solution | |||
Number of groups having 16 cells | 0 | 0 | |||
Number of groups having 8 cells | 0 | 0 | |||
Number of groups having 4 cells (Blue Enclosures in Figure 3) | 2 | Group 1 (Cells 0,2,8,10) | 1 | Group 1 (Cells 0,1,2,3) | |
Group 2 (Cells 0,1,4,5) | |||||
Number of groups having 2 cells (Orange Enclosures in Figure 3) | 4 | Group 3 (Cells 5,7) | Group 4 (Cells 5,13) | 2 | Group 2 (Cells 1,9) |
Group 5 (Cells 10,11) | Group 6 (Cells 10,14) | Group 3 (Cells 2,6) | |||
Number of groups having 1cell (Green Enclosures in Figure 3) | 0 | 2 | Group 4 (Cell 12) | ||
Group 5 (Cell 15) | |||||
As a result, for the example in question, a K-map depicting the groups can be obtained as shown in Figure 3, the information of which is summarised in Table 1.
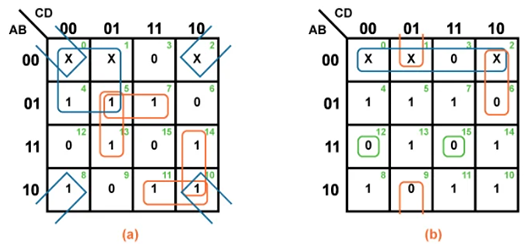
Fig: K=maps grouped for (a) SOP solution and (b) POS solution
In the leftmost K-map below, cells and are adjacent as ellipses in the K-map. This is not the case, according to the preceding truth table. Between them, there is another truth table item (). This gets us to the main reason of structuring the K-map into a square array: cells with any common Boolean variables must be close to one another in order to exhibit a pattern that stands out.
They both have the Boolean variable B' in common for cells and. We know this since the column above cells and have B=0 (same as B'). Compare this to the Venn diagram in the square above the K-map.
A similar line of reasoning reveals that and have the same Boolean B (B=1) value. Then, and share the Boolean A' (A=0) property. Finally, both and share the Boolean A (A=1) property. Compare the latter two maps to the Venn diagram in the middle.
To summarise, we're seeking for Boolean variables that are common across cells. The Karnaugh map is laid out in such a way that we can observe the commonalities. Let's look at a few examples.
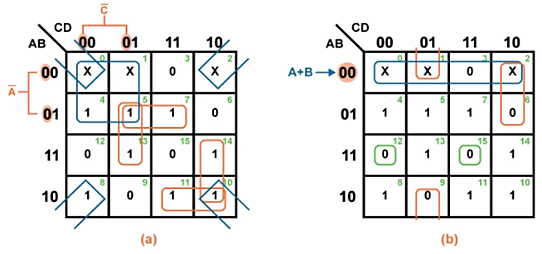
Fig: K-map simplification technique for (a) SOP solution and (b) POS solution
We may extract the logical terms corresponding to each of the groups using the same procedure, as shown in Table 2, to build the logical expression for the specific output.
SOP Form Solution | POS Form Solution | ||
Groups | Logical Expression | Groups | Logical Expression |
Group 1 | B̅D̅ | Group 1 | A+B |
Group 2 | A̅C̅ | Group 2 | B+C+D̅ |
Group 3 | A̅BD | Group 3 | A+C̅+D |
Group 4 | BC̅D | Group 4 | A̅+B̅+C+D |
Group 5 | AB̅C | Group 5 | A̅+B̅+C̅+D̅ |
Group 6 | ACD̅ |
|
|
Thus, Y = B̅D̅ + A̅C̅ + A̅BD + BC̅D + A B̅C + ACD̅ | Thus, Y = (A+B) (B+C+D̅) (A+C̅+D) (A̅+B̅+C+D) (A̅+B̅+C̅+D̅) | ||
Step 5: System Design
With the simplified logical expression in hand, we can determine the kind and number of gates needed to fulfil the expected logic for each output bit, resulting in the complete design of the desired system.
As illustrated in Figures (a) and (b), the digital system corresponding to SOP and POS forms of solution for the given example can be created utilising fundamental gates like NOT, AND, and OR (b).
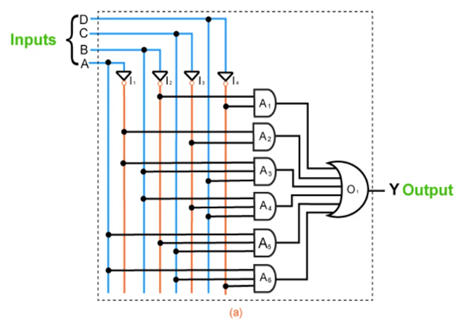
Fig: Digital system corresponding to SOP form of solution
Let's practice applying each step to two more examples now that we've evaluated each step for Example 1.
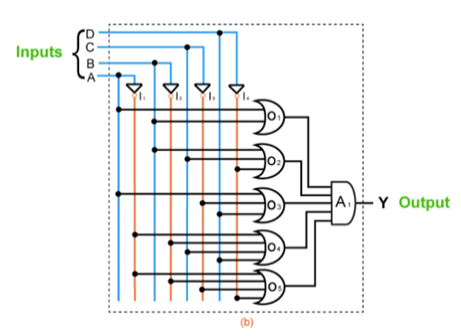
Fig: Digital system corresponding to POS form of solution
Example 2:
Design a full adder by obtaining the simplified expressions for the sum and carry outputs in POS form.
Step 1:
Number of input variables = 3
Number of output variables = 2
Inputs | Decimal Equivalent | Outputs | |||
A | B | Ci | S | Co | |
0 | 0 | 0 | 0 | 0 | 0 |
0 | 0 | 1 | 1 | 1 | 0 |
0 | 1 | 0 | 2 | 1 | 0 |
0 | 1 | 1 | 3 | 0 | 1 |
1 | 0 | 0 | 4 | 1 | 0 |
1 | 0 | 1 | 5 | 0 | 1 |
1 | 1 | 0 | 6 | 0 | 1 |
1 | 1 | 1 | 7 | 1 | 1 |
Maxterm expansion for S = ∏M (0,3,5,6)
Maxterm expansion for Co = ∏M (0,1,2,4)
Steps 2 and 3:
Number of K-maps required = 2
Each K-map should have 8 cells in it.
Thus we get:
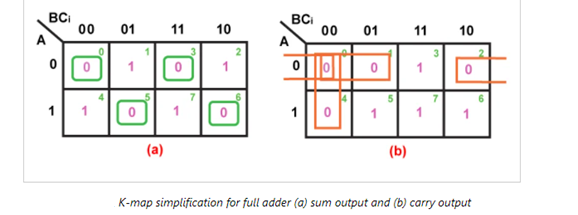
| Sum Output, S | Carry Output, Co | ||||
Groups with 8 cells | Nil | Nil | ||||
Groups with 4 cells | Nil | Nil | ||||
Groups with 2 cells | Nil | 3 | Group 1 (Cells 0,1) | Group 2 (Cells 0,2) | ||
Group 3 (Cells 0,4) |
| |||||
Groups with 1 cell | 4 | Group 1 (Cell 0) | Group 2 (Cell 3) | Nil | ||
Group 3 (Cell 5) | Group 4 (Cell 6) | |||||
Step 4:
Groups | Sum Output, S | Carry Output, Co |
Group 1 | A + B + Ci | A + B |
Group 2 | A + B̅ + C̅i | A + Ci |
Group 3 | A̅ + B + C̅i | B + Ci |
Group 4 | A̅ + B̅ + Ci |
|
| S = (A + B + Ci) (A + B̅ + C̅i) (A̅ + B + C̅i) (A̅ + B̅ + Ci) | Co = (A + B) (A + Ci) (B + Ci) |
Step 5:
The digital system designed to realize the full adder in terms of sum and carry outputs (in POS form) is shown by Figure 7:
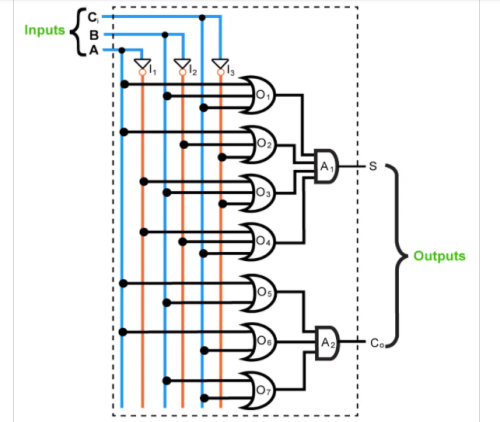
Figure: Full adder circuit
Example 3:
Simplify the Boolean expression f (A,B,C,D,E) =
∑m (0,3,4,7,8,12,14,16,19,20,23,24,26,28)
Step 1:
Number of input variables = 5
Number of output variables = 1
Minterm expansion of the output is given as f (A,B,C,D,E)
= ∑m (0,3,4,7,8,12,14,16,19,20,23,24,26,28)
Steps 2, 3, and 4:
Number of K-maps required = 1
Each K-map should have 32 cells in it.
Thus we get:
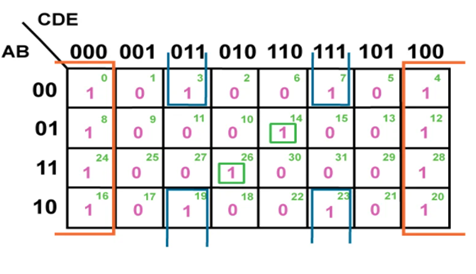
Fig: Grouped 32-cell K-map
Number of Groups with 32 cells | Nil | ||
Number of Groups with 16 cells | Nil | ||
Number of Groups with 8 cells (Orange Enclosures in Figure 8) | 1 | Group 1 (Cells 0,4,8,12,16,20,24,28) | D̅E̅ |
Number of Groups with 4 cells (Blue Enclosures in Figure 8) | 1 | Group 2 (Cells 3,7,19,23) | B̅DE |
Number of Groups with 2 cells | Nil | ||
Number of Groups with 1 cell (Green Enclosures in Figure 8) | 2 | Group 3 (Cell 14) | A̅BCDE̅ |
Group 4 (Cell 26) | ABC̅DE̅ | ||
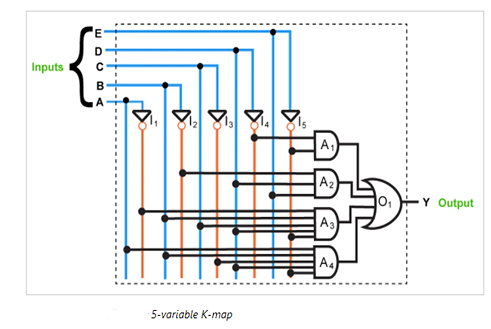
Thus, f (A,B,C,D,E) = D̅E̅ + B̅DE + A̅BCDE̅ + ABC̅DE̅ | |||
Step 5:
The digital system corresponding to the function given is obtained as shown in Figure 9:
Advantages of K-Maps
1. When compared to the method of solving logical expressions using Boolean principles, the K-map simplification methodology is easier and less error-prone.
2. It eliminates the need to memorise all of the Boolean algebraic theorems.
3. It requires fewer steps to arrive at a simpler expression than the algebraic minimization methodology.
4. When used correctly, the K-map simplification technique always yields the smallest expression.
Disadvantages of K-Maps
1. The K-map simplification method becomes more difficult as the number of variables in the logical statement grows.
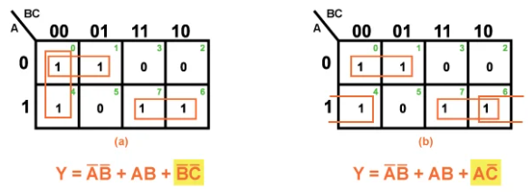
2. Depending on the choices taken while building the groups, the smallest logical expression obtained via the K-map simplification process may or may not be unique. For example, we can get two alternative but accurate logical expressions for the output variable Y given by the K-map in Figure 10. The third term, which might be either BC or AC, shows the variation in the answer produced (highlighted in Figure 10). This change is dependent on whether the cells (0,4) or (4,6) are grouped together to form a two-celled group to cover the one seen in the K-map cell numbered 4.
Conclusion
Having analyzed the structure of K-maps, we may arrive at the conclusion that the K-map simplification process is an effective reduction technique when dealing with logical expressions which contain around three to six input variables.
2.6.1 Cathode Ray Oscilloscope (CRO)
The cathode ray oscilloscope, often known as a CRO, is an electronic instrument that displays a signal waveform visually.
It is the most versatile and helpful equipment in the electrical industry.
CRO is commonly used in radio and television receiver troubleshooting, as well as laboratory research and design.
The wave patterns of alternating currents and voltages can be examined using a CRO. Voltage, current, power, frequency, and phase shift can all be measured with it. Oscilloscopes come in a variety of shapes and sizes, and they can be used for a variety of tasks.
2.6.2 Block Diagram of CRO (Cathode Ray Oscilloscope)
The figure below shows the block diagram of a general purpose CRO
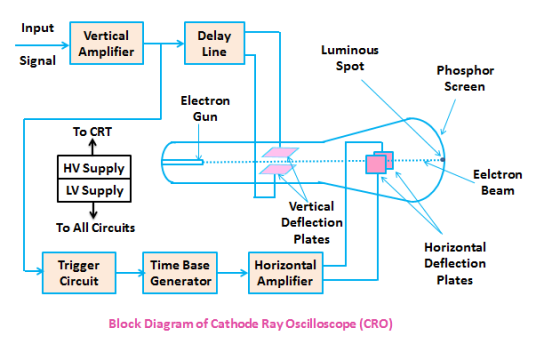
A CRO uses a cathode ray tube (CRT), which serves as the oscilloscope's heart, as seen in the diagram above.
The electron beam is accelerated to a high velocity and brought into focus on a fluorescent screen by the CRT in an oscilloscope. When the electron beam reaches this screen, it creates a visible spot. The electrons may be made to function as an electrical pencil of light by deflecting the beam over the screen in response to an electrical signal, producing a spot of light wherever it strikes.
Various electrical signals and voltages are required to complete these duties, which are given by the oscilloscope's power supply circuit.
The heater of the electron cannon, which generates the electron beam, requires a low voltage source, whereas the cathode ray tube, which accelerates the beam, requires a high voltage supply. The oscilloscope's other control modules require a standard voltage source.
Between the electron gun and the screen are horizontal and vertical deflection plates that deflect the beam according to the input signal.
A time base generator is included in the oscilloscope to deflect the electron beam on the screen in the horizontal direction (X-axis) at a constant time dependent rate.
The signal to be examined is sent into the vertical deflection plate through the vertical amplifier, which amplifies the signal to a level that allows the electron beam to be deflected.
Because the electron beam is deflected in both the X and Y axes, a triggering circuit is included to synchronise the two types of deflections so that horizontal deflection begins at the same place on the input vertical signal every time it sweeps.
We'll go through the many components of the CRT in detail because it's the heart of the oscilloscope.
2.6.3 The function of each block of CRO is mentioned below.
● Vertical Amplifier – It enhances the signal that will be displayed on the CRT's screen.
● Delay Line - It adds a small bit of delay to the signal that comes out of the vertical amplifier's output. After that, the delayed signal is applied to the CRT's vertical deflection plates.
● Trigger Circuit – It generates a triggering signal that allows the horizontal and vertical deflections of the electron beam to be synchronised.
● Time base Generator − It generates a sawtooth signal that can be used to deflect an electron beam horizontally.
● Horizontal Amplifier – The sawtooth signal is amplified and then connected to the CRT's horizontal deflection plates.
● Power supply − It is capable of producing both high and low voltages. CRTs and other circuits receive negative high voltage and positive low voltage, respectively.
● Cathode Ray Tube (CRT) – It is CRO's most important block, and it is made up of four sections. Electron cannon, vertical deflection plates, horizontal deflection plates, and fluorescent screen are the items in question.
A pair of vertical deflection plates and a pair of horizontal deflection plates respectively deflect the electron beam produced by an electron gun in both vertical and horizontal directions. Finally, the deflected beam appears on the fluorescent screen as a spot.
CRO will then show the applied input signal on the CRT screen in this manner. As a result, we can use CRO to analyse signals in the temporal domain.
2.6.4 Measurements by using CRO
We can do the following measurements by using CRO.
● Measurement of Amplitude
● Measurement of Time Period
● Measurement of Frequency
Now, let us discuss about these measurements one by one.
Measurement of Amplitude
On its screen, CRO shows the voltage signal as a function of time. The amplitude of the voltage signal remains constant, but by adjusting the volt/division knob on the CRO panel, we may change the number of divisions that cover the voltage signal in the vertical direction. As a result, we'll use the following formula to calculate the amplitude of the signal that's shown on the CRO's screen.
A=j×nvA=j×nv
Where,
AA is the amplitude
jj is the value of volt/division
Nvnv is the number of divisions that cover the signal in vertical direction.
Measurement of Time Period
On its screen, CRO shows the voltage signal as a function of time. The time period of the periodic voltage signal is constant, but by adjusting the time/division knob on the CRO panel, we may change the number of divisions that cover one complete cycle of voltage signal in horizontal direction.
As a result, we'll use the following formula to calculate the Time Period of the signal that's displayed on the CRO's screen.
T=k×nhT=k×nh
Where,
TT is the Time period
jj is the value of time/division
Nvnv is the number of divisions that cover one complete cycle of the periodic signal in horizontal direction.
Measurement of Frequency
A periodic signal's frequency, f, is the reciprocal of its time period, T. It can be expressed mathematically as
f=1Tf=1T
So, we can find the frequency, f of a periodic signal by following these two steps.
Step1 − Find the Time period of periodic signal
Step2 − Take reciprocal of Time period of periodic signal, which is obtained in Step1
2.6.5 Cathode Ray Tube
The cathode ray tube, often known as the CRT, is a vacuum tube with a unique geometrical shape that converts an electrical signal into a visual signal.
A CRT makes a vast number of electrons available, which are accelerated to high speeds and focused on a fluorescent screen, where they generate a spot when they strike it. In reaction to the provided electrical signal, the electron beam is deflected during its trip. As a result, the waveform of the electrical signal is seen.
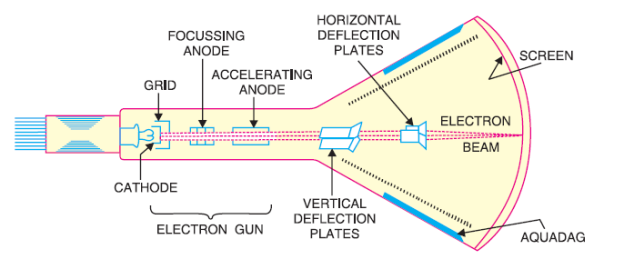
The parts of a cathode ray tube (CRT) are shown in the diagram below.
(i) Glass Envelope
It is a conical highly evacuated glass enclosure which maintains vacuum inside it and supports numerous electrodes.
The inside wall of a CRT between the neck and the screen is commonly coated with aquadag, a conductive material. This coating is electrically coupled to the accelerating anode, allowing electrons to be returned to the anode if they mistakenly strike the walls. This keeps the walls from reaching a dangerously low negative potential.
(ii) Electron Gun Assembly
The electron gun assembly produces a focussed beam of electrons by combining an indirectly heated cathode, a control grid, a focussing anode, and an accelerating anode.
In relation to the cathode, the control grid is held at a negative potential. The two anodes, on the other hand, are kept at a high positive potential in relation to the cathode.
The cathode is made out of a nickel cylinder with an oxide layer that provides a lot of electrons.
To keep the electron beam modest, the control grid encloses the cathode and is made up of a metal cylinder with a tiny circular opening.
The focusing anode concentrates the electron beam into a precise pin point by regulating the positive voltage on it.
The electron beam is accelerated to a high velocity due to the positive potential of around 10,000 V on the accelerating anode, which is significantly larger than on the focusing diode.
When the electron gun assembly impacts the screen, it produces a narrow, accelerated electron beam that produces a pinpoint of light.
(iii) Deflection Plate Assembly
It is used to deflect the beam and comprises of two sets of deflecting plates within the tube beyond the accelerating anode.
The vertical deflection plates are one set, and the horizontal deflection plates are the other.
In the tube, the vertical deflection plates are positioned horizontally. The electron beam can be made to move up and down vertically on the screen by applying suitable potential to these plates.
In the tube, the horizontal deflection plates are positioned vertically. The electron beam can be made to go right and left horizontally on the screen by applying the necessary potential to these plates.
(iv) Screen
The screen is the interior face of the tube and is coated with fluorescent materials such as zinc orthosilicate, zinc oxide, and others.
When a high-velocity electron beam collides with the screen, a bright spot appears at the collision location. The colour of the spot is determined by the fluorescent substance used.
2.6.6 Working of Cathode Ray Tube
The cathode produces a significant quantity of electrons as it heats up.
On their journey to the screen, these electrons pass via the control grid.
As with normal vacuum tubes, the control grid regulates the quantity of current flow. Fewer electrons will travel through the control grid if the negative potential is high. As a result, when the electron beam hits the screen, it produces a dim pinpoint of light. When the negative potential on the control grid is lowered, the reversal occurs.
As a result, changing the negative potential on the control grid can vary the intensity of the light spot on the screen.
The electron beam is influenced by focusing and accelerating anodes after leaving the control grid.
Because the two anodes have a strong positive potential, they form a field that functions as an electrostatic lens to focus the electron beam to a specific place on the screen.
The electron beam passes through vertical and horizontal deflection plates after exiting the accelerating anode.
The electron beam produces a spot of light in the centre when no voltage is given to these deflection plates, as seen by point O in the fig below on the screen.
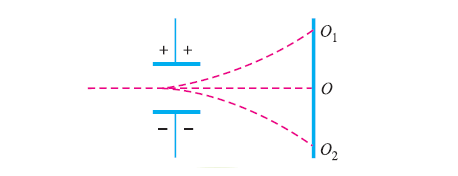
The electron beam, as well as the spot of light, will be deflected upwards if the voltage is applied just to the vertical deflection plates, i.e. point O1. The spot of light will be diverted downwards if the potential on the plates is reversed, i.e. point O2.
Similarly, applying voltage across the horizontal deflection plates can deflect the light point horizontally.
Key Takeaway:
Each set of plates is parallel and positioned near the tube's neck. Although the vertical deflection plates are horizontal, they govern the beam's vertical position. The horizontal plates, which are at a right angle to the vertical plates, govern the beam's horizontal position.
Images are created with CRTs. The materials in a CRT's screen that directly produce the photons generated by the CRT are called phosphors. When incoming electrons from the electron cannon strike these phosphors, they absorb energy and subsequently re-emit some or all of it as light.
Underneath, you'll notice a small metal connecting nub. You may cut it with diagonal cutters and hear the vacuum hiss, which is caused by air flowing through the CRT tube. If you want to break the rear of the CRT tube, you can do it securely after that. I agree that a CRT monitor with a waiting time of 25000 seconds is enough to kill you in seconds.
2.7.1 Electron Gun
Definition: The term "electron cannon" refers to a device that produces a focussed and accelerated electron beam. It is a gadget that displays images on the phosphorous screen of a Cathode Ray Tube. A heater, cathode, grid, pre-accelerating, accelerating, and focusing anode enable the electron cannon emit electrons and form them into a beam.
Emission of Electrons
The electrons are emitted through the cathode that is heated indirectly. The term "indirectly heated cathode" refers to a cathode electrode that is encircled by a filament that emits electrons when power is applied across it.
A layer of barium and strontium oxide is added to the cathode's end to achieve high electron emission at a moderate temperature. The indirectly heated cathode's current and voltage requirements are almost equal to 600 mA and 6.3V.
Working of Electron Gun
The electron goes via the control grid after departing the cathode. Nickel is used to make the control grid. It has a central hole and runs parallel to the CRT axis. The number of electrons emitted from the cathode determines the intensity of the control beams. Negative biassing controls the flow of electrons on the grid.
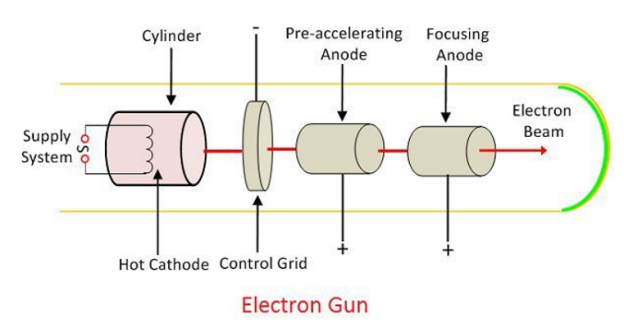
The high positive voltage applied across the pre-accelerating and accelerating grids accelerates the electron that passes from the control grid. The focusing anode concentrates the electron beam. The beam passes via the deflection plates and onto the fluorescent screen after passing through the focusing anode.
2.7.2 Construction of Electron Gun
The electron gun's primary function is to produce and accelerate an electron beam inside the CRT's vacuum tube. The heater, cathode electrodes, grid, and several types of anodes are needed to generate and accelerate the gun. Below is a detailed explanation of their components.
1. Heater – The electric energy is converted into heat by the heater. It has a resistor that prevents current from flowing and transforms it to heat energy. The heater emits electrons by heating the cathode electrodes.
2. Control Grid – A nickel cylinder serves as the control grid. It's a metallic cup made of steel with a decreased permeability. It is 15 mm in length and 15 mm in diameter. For electron flow, a hole of roughly 0.25 mm is drilled in the cap of the grid. The intensity of the electron beam travelling through the grid is determined by electron emission. Negative biassing controls the flow of electrons through the control grid.
3. Pre-Accelerating & Accelerating Anode – The beams travelling through the gun were accelerated by the pre-accelerating and accelerating anodes. The electrons are accelerated by connecting these anodes to a high voltage.
4. Focussing Anode – The electrons flow through the focusing beam after passing through the pre-accelerating and accelerating electrodes. The focusing anode generates electron beams that are sharply focused.
The electron cannon is housed inside the glass tube to prevent the electron beam from colliding with the air molecules.
Key takeaway:
A vacuum tube holding an electron cannon and a screen lined with phosphors are the main components of a cathode ray tube (CRT). Images are created with CRTs.
The phosphors of a CRT's screen are the materials that produce the photons that the CRT generates directly. CRT technology used to be widespread in televisions and computer monitors. These phosphors are struck by incoming electrons from the electron gun, absorb energy, and then re-emit some or all of that energy in the form of light. Three electron cannons correlate to three types of phosphors in colour CRTs, one for each main colour (red, blue, and green). Black and white televisions and ancient computer terminals are examples of monochromatic CRTs.
CRT screens are also used in oscilloscopes, which are machines that measure and display voltages. In this scenario, the phosphor's endurance is more essential than its hue.
CRTs in televisions and computer monitors use magnetic deflection to bend electron beams, whereas oscilloscopes use electrostatic deflection.
2.8.1 Horizontal Deflection System in CRO
The following stages make up the horizontal deflecting mechanism of a cathode ray oscilloscope (CRO).
1. Time base generator or sweep generator.
2. Horizontal amplification
The third circuit is the trigger circuit.
A voltage that is linearly increasing with time is required for an oscilloscope to depict the waveform under examination. In addition, the voltage must decrease in amplitude over time periods that are equal to or multiples of the time periods of the input signal. This saw tooth waveform voltage is delivered to the horizontal deflecting plates in order to sweep the beam horizontally. As a result, the voltage is referred to as sweep voltage or time base voltage.
This sweep voltage is generated by a sweep generator. An R.C. Charging circuit will be used to generate the sweep voltage. A voltage-operated switch will discharge the capacitor after it has reached a set charge value. A constant current generator is used to charge the capacitor. The sweep voltage waveform is depicted in Figure below.
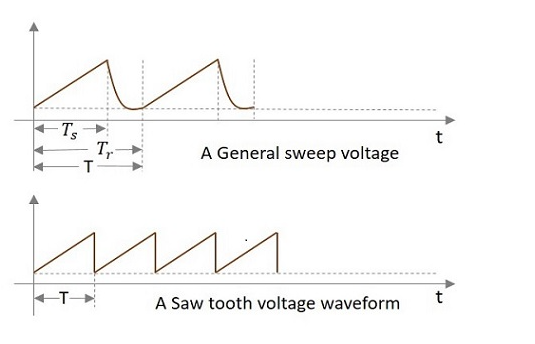
The 'ramp' voltage is the portion of the voltage that increases linearly. During the rising time of the sweep voltage Ts, the beam is swept from the left to the right of the screen. The retrace period of the fly back period is the time it takes for the voltage to return to its start value after reaching its maximum. The electron beam is shut off during this retrace phase in order to blank the retrace display on screen.
Sweep generators can use vacuum tube circuits, transistors, or integrated circuits. In vacuum tube type circuits, thyratrons and gas diodes were employed as voltage actuated switches. UJT is used in transistor circuits for this reason. The ramp voltage can be generated using IC packages. The sweep voltage can be generated with a 555 IC.
(a) Sweep Generator Using UJT:
Figure shows the circuit for a sweep generator that uses a UJT.
The resistor RT and the capacitor CT make up the RC circuit. The UJT is connected across the capacitor as a voltage-operated switch. When the power is turned on, the capacitor is charged via the resistance RT. Because the emitter and base one (1) of the UJT are connected across the capacitor CT, the emitter voltage rises as the capacitor charges. The emitter base one (1) diode conducts substantially when the voltage across the capacitor, which is the emitter voltage on the UJT, reaches a value somewhat more than the peak voltage of the UJT. The capacitor is discharged as a result of this action. The UJT stops conducting when the voltage at the emitter is lost. The capacitor is charged once more.
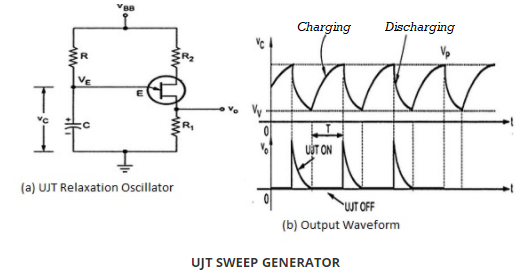
As long as the supply is available, the charging and discharging operation will continue. The required sweep voltage is determined by the voltage across the capacitor. The relaxation oscillators are circuits that generate non-sinusoidal waveforms. The frequency of this sweep generator can be changed in steps by connecting a switch to a number of capacitors (CT). This enables coarse frequency variation as well as the needed number of TIME/DIV ranges on the selector switch. The frequency can be changed by changing the value of the resistor. The sweep generator can now have fine frequency control. Only the time constant of the RTCT, timing resistor, and timing capacitor of the circuit is changed by altering the value of the capacitor and resistor. To increase the linearity of the sweep circuit, utilise two supplies for the above circuit. One is for the timing resistor and capacitor, while the other is for the UJT.
The following are the other steps of the Horizontal Deflection System in CRO.
2.8.2 Horizontal Deflecting System:
A Time Base Generator and an output amplifier make up the Horizontal Deflecting System.
Time Base Generator or Sweep
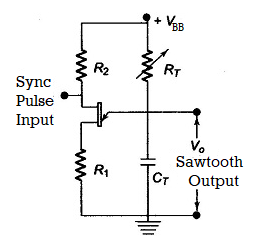
Fig: Continuous Sweep
Figure shows a continuous sweep CRO using a UJT as a time base generator. The sweep is created using the UJT. The UJT is turned off when the power is turned on, and the CT changes exponentially through RT. As illustrated in Fig. 7.9, the UJT emitter voltage VE climbs towards VBB, and when it reaches the peak voltage VP, the emitter to base ‘1' (B1) diode becomes forward biassed, and the UJT triggers ON. The capacitor discharges quickly due to the low resistance discharge route. The emitter voltage VE soon falls to zero, and the UJT turns off. The capacitor recharges, and the cycle begins all over again.
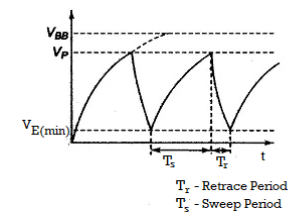
Fig. Sawtooth Output Waveform
Two distinct voltage sources are used to increase sweep linearity: a low voltage supply for the UJT circuit and a high voltage supply for the RTCT circuit.
CT is adjusted or modified in stages for range altering, while RT is utilised for continuous frequency control within a range. Timing resistor and timing capacitor are two terms that are used interchangeably.
The sync pulse ensures that the sweep frequency is exactly equal to the input signal frequency, preventing the signal from drifting on the screen.
2.8.3 Time Base Generator – Working Principle and Circuit Diagram
Function generators, or electronic test equipment, are utilised as a signal source for testing or repairing analogue circuits. Pulse generators are utilised in digital circuitry. Over a wide range of frequencies, function generators can produce both single-shot and repeating waveforms. Function generators require an internal or external source to generate various types of electronic waveforms. A unique sort of function generator called a Time-Base Generator is utilised to create high-frequency sawtooth waveforms. This also results in time-varying voltage or current signals that are linear. This generator creates a variety of waveforms in addition to time basis signals.
What is a Time Base Generator?
A Time Base Generator is an electronic function generator that generates variable voltage or current to produce various time base signals. The electron beam is deflected horizontally in a Cathode-ray tube using the linear time-varying voltages created. This is commonly used to generate sawtooth waveforms in oscilloscopes.
The voltage should have a constant horizontal velocity to produce a sawtooth waveform. Ramp voltage is the name given to such a voltage. The Sawtooth waveform is generated when this voltage rapidly approaches zero. The sweep time Ts is the time it takes for the voltage to rise linearly, and the retrace time Tr is the time it takes for the wave to return to its start state in the sawtooth waveform. The waveform moves from left to right across the CRT screen. The deflection plates are equipped with a horizontal deflection Time-Base Generator for this purpose.
Circuit Diagram
A variable resistor -R charges the capacitor-C and discharges it regularly through a transistor Q1 in the Time-Base Generator circuit. The sweep rate should be greater than the retrace time when creating sawtooth waveforms. The resistor in the circuit controls the waveform's sweep time.
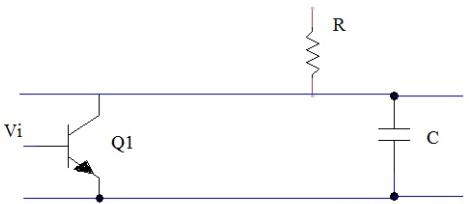
Working Principle of Time-Base Generator
Across resistor R, the voltage Vcc is applied. The capacitor C begins to charge. The transistor Q1 is turned on by the input signal Vi. The capacitor is discharged through this transistor, which has a low resistance. The capacitor will charge exponentially to the supply voltage Vcc if the transistor is not turned on. The sawtooth waveform is created by the capacitor's controlled charging and discharging.
CRO use a Time-Base Generator to generate sawtooth waveforms. Sweep Generators are another name for these. An electron cannon produces an electron beam, which is displayed on a phosphorous-covered screen, and deflection plates deflect the beam. A Time-base generator is used with a CRT in radar systems to sweep the target position over the display and determine the target location. The Time-Base Generator is used in the early warning radar system. When the broadcasting signal is turned off, the sweep is started. When an echo is detected, the beam is diverted.
There are two Time-base generators in analogue television sets. One deflects the beam horizontally, while the other pulls it down the screen. To display diverse Time-base signals, the oscilloscope employs several time-base generators. What sorts of time-base generators are there?
A cathode ray tube's deflection sensitivity is the deflection on the screen caused by the beam in metres per volt of applied voltage.
This is not the same as CRO's deflection sensitivity. The gain of the amplifiers between the input terminals and the deflection plates is included in the CRO's deflection sensitivity.
The deflection sensitivity of any CRO's cathode ray tube can be determined by directly applying a known voltage to the deflecting plates. Connection to the deflection plates can be accomplished using terminals on the CRO's frame that are accessible through a window-like opening from the protective covers.
The configuration for determining the CR Tube's deflection sensitivity is shown in the block diagram below.
2.9.1 Deflection Sensitivity of CRT
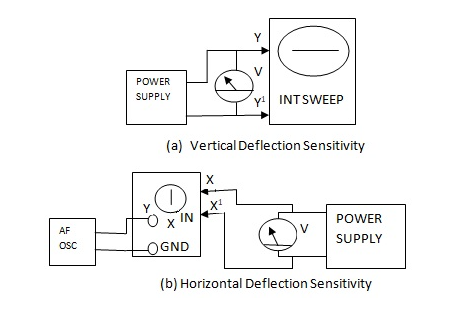
(a) Vertical deflection sensitivity:
The internal sweep can be employed to generate the horizontal line on the CRO to achieve vertical deflection sensitivity. The CRO must be set up for operation, and the horizontal line must be aligned with one of the graticule's horizontal lines. The voltage from a d.c power supply is placed between the vertical deflecting plates. To indicate the voltage delivered to the vertical deflecting plates, a multimeter with good sensitivity or a digital voltmeter is connected across the power supply. The horizontal line shifts up or down depending on the polarity of the applied voltage on the deflecting plates when the voltage is applied. The voltage is adjusted to produce a comfortable horizontal line displacement. The displacement in metres can now be determined by looking at the markings on the graticule. The deflection sensitivity can be computed and represented as meters/volt using this information.
(b) Horizontal deflection sensitivity :
Internal sweep is not required in this situation. It is possible to set the sweep mode switch to external mode. A low voltage alternating voltage will be used to power the vertical deflecting plates. A vertical line will appear on the screen. This line is parallel to one of the graticule's vertical lines. The horizontal deflecting plates get a d.c voltage from a power supply. A multimeter or similar device is used to measure the voltage applied. The vertical line will shift to the left or right depending on how much voltage is applied to the horizontal deflecting plates. The polarity of the applied voltage on the deflecting plates determines this. The voltage will be tweaked to get a comfortable deflection across the scale. It will be recorded what voltage is required for that displacement. The sensitivity to deflection can then be computed and given in m/V.
2.9.2 Electrostatic Deflection in CRT
Definition: The process of aligning the route of charged particles by applying an electric field between the deflecting plates is known as electrostatic deflection. The term electrostatic refers to how the field's strength and direction change over time. As a result, the particles can only go in one direction. Deflecting plates are used in the cathode ray tube to change the path of electrons. After departing the electron gun, the electrons pass via deflecting plates. The electron beam is focused in the CRT using vertical and horizontal plates.
The horizontal deflection is caused by an electrical field created by the vertical plate in the horizontal plane. The other pair is horizontally positioned and induces vertical deflection by creating an electric field in the vertical plane. The beam can pass through these plates without colliding with the deflecting plates.
Electrostatic Deflection Arrangement
The electrostatic deflection is depicted in general in the diagram below. The potential difference is applied between A and B, which are two parallel plates. The consistent electrostatic field in the Y direction is created by these deflection plates.
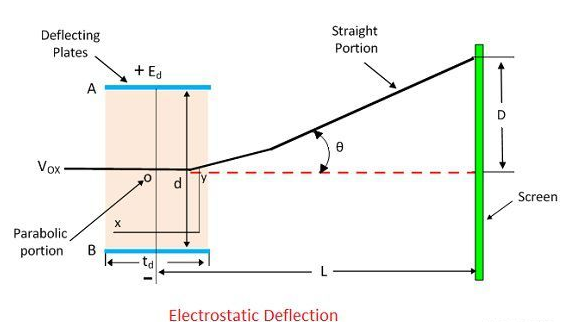
When an electron passes through the gap between the plates, it feels a force only in one direction: Y. As a result, the electron will only go in that direction. In either the X or Z directions, there is no force. As a result, no electron acceleration occurs in that direction.
E0 is the pre-accelerating anode's voltage in volts.
e is the coulomb charge of an electron.
m is the mass of an electron in kilogrammes.
VOX is the electron's velocity in metres per second as it enters the deflecting plates.
In Volts, Ed represents the potential between deflecting plates.
In the metre, d is the distance between the deflecting plates.
Ld is the deflecting plate's length in metres.
L = Distance between the screen and the deflecting plates' midpoint.
D is the Y-direction deflection of the electron beam on the screen.
The electron loses potential energy as it passes from the accelerating cathode to the anode. The formula calculates the electron's potential energy.

The kinetic energy is gained by the electrons. And the equation gives them energy.

The velocity of the electron when it enters the deflecting plates is calculated by combining the potential and kinetic energy.

Because there was no force operating in the X direction, the electron's velocity in that direction remained constant throughout the deflection plate.

The electric field intensity in the Y direction is given by the equation.

In the Y direction, the force acting on the electron. The term ay denotes electron acceleration in the y direction.
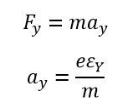
The electron's initial velocity as it enters the deflection plate is zero, and the equation gives the electron's displacement in the Y direction at any time t.

The Y-direction velocity is constant, and the Y-direction displacement is given as

In the displacement equation y, substituting the value of t yields

The parabola is represented by the equation above. At any point, the slope is expressed as

We get the value of tan by replacing x = ld.

The electrons move into the straight line after passing through the deflection plate. This straight line intersects the X-axis at point O' and is tangent to the parabola at x = ld. The location of the point is determined by the equation.
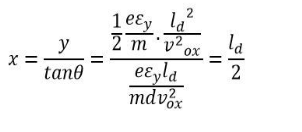
The deflection D on the screen is expressed as

By substituting the value of v2ox in the above equation we get

We can deduce from the previous equation that the electron's deflection is proportional to the deflecting voltage.
CRO's applications include: (1) Wave Form Analysis
2.10.1 CRO Application and Uses | Cathode Ray Oscilloscope
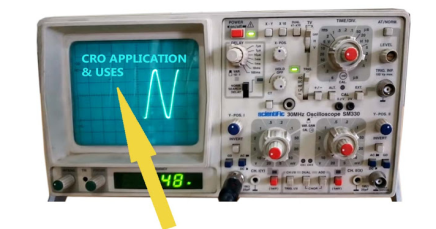
CRO's main uses include observing electrical and electronic signal characteristics, oscillation distortion testing, signal frequency response, and so on. CRO is used to measure voltage, current, frequency, and other variables. This article has a number of CRO applications and uses, each with a detailed description. The acronym CRO stands for Cathode Ray Oscilloscope.
Application of CRO
1. CRO has a wide range of applications in radio stations. True, those radio stations do not employ our standard CRO, but they are nearly identical to our standard CRO. CROs are used in radio stations to monitor the qualities of sending and receiving signals.
2. CRO aids in the observation of a signal's features and properties, which is why it aids in the control of analogue signals.
3. CRO can monitor the shape of the voltage and current waveforms, which aids in making the essential decisions in a radio station or communication station.
4. The CRO is utilised for research. When scientists construct a new circuit, they use a Cathode Ray Oscilloscope to check the voltage and current waveforms of each component.
5. CRO is used in conjunction with the resonance circuit to monitor bandwidth, wave form, and other parameters.
6. CRO was also used to examine the properties of Amplitude Modulation Circuits, Frequency Modulation Circuits, and other circuits.
Use of CRO(Cathode Ray Oscilloscope)
Current Measurement: CRO can be used to determine the current value, as well as the magnitude and direction of the current. We can measure the current by calculating the amplitude variation, horizontal and vertical cells in the CRO screen. In CRO, we can measure both AC and DC.
Voltage Measurement: In CRO, we can measure both AC and DC voltages. In the CRO screen, the same process should be followed to measure the voltage that is used to calculate horizontal and vertical cells.
Frequency Measurement: We may use CRO to measure not only voltage and current, but also frequency of a signal by computing the time period. We can easily measure the frequency of a signal after measuring its time period. The measuring of the time period is also quite simple with CRO.
Phase Difference Measurement : The majority of CROs have two channels. On the CRO, we can use two separate signals at the same time. We can also simply determine the phase difference between the two signals. The CRO screen's Lissajous figures assist us in determining the phase difference between two signals. We may also use this method to measure the frequency of two signals at the same time.
The applications and uses of the CRO, or Cathode Ray Oscilloscope, were as follows.
2.10.2 Waveform
1. Reading Waveforms
We're looking at a data visualisation in the form of a graph. The data we're graphing is a sound wave, which is represented by the blue line. It's specifically telling us about the displacement of the wave and how it evolves over time.
Let's take a closer look at what that entails.
● Time
Time is represented by the horizontal line, our X axis.
Our graph shows a 1-second interval in this situation.
● Displacement
The action of plucking a guitar string causes it to wobble back and forth. You could observe it sway from side to side like a clock's pendulum if you had a zoomed-in, slow-motion camera.
You could measure the distance the string moves from its default, resting position if you had the world's smallest ruler.
When a guitar string vibrates, it sets off a chain reaction with the air molecules around it, causing them all to vibrate and radiate outwards.
The displacement of air molecules is measured on our Y-axis. It's a metric for the loudness of a sound wave; a softly strummed guitar string vibrates only slightly, therefore the displacement would be negligible. If you pick the string, pull it back an inch, and then release it, the displacement of the string will be significantly higher, resulting in a considerably louder sound wave.
The waveform on the left depicts a single sound wave oscillation. It begins by displacing an air molecule in a positive direction by '1', then in a negative direction by '-1'.
● Amplitude
Sound waves are represented as waveforms, which are abstract representations of them. We tend to employ abstract measurements when working with waveforms, even though a genuine sound wave might displace an air molecule by 4 nanometers.
This is where the concept of amplitude comes into play. It determines how far a molecule has moved from its resting state. In our example, we're going from 0 (quiet) to 1 (noise) (the maximum amount displaced).
Loudness can be equated to amplitude. The sound appears louder to us as the air molecules are moved more.
Let's make this a collaborative effort! To observe how changing the amplitude of the waveform impacts the graph, use the amplitude slider underneath the waveform.
Notice how the line flattens out when you set it all the way to 0. It's entirely silent if the amplitude is zero.
● Frequency
The waveform has been changed to repeat twice in the allocated time (or, to put it another way, twice as quickly).
We're looking at a periodic waveform, which means it may be repeated to give a consistent tone. When you unmute the sound, you'll see that it's completely consistent from one second to the next. By repeating the waveform over and over, periodic waveforms allow you to create a steady sound. This is unlike, say, a piano, where the note quality changes with time.
The frequency of a waveform is the number of times it repeats in a given amount of time. The Hertz, abbreviated as "Hz," is a popular unit of frequency measurement that measures the number of repetitions per second.
We may determine that this wave is oscillating at 2Hz because the waveform graph displays a 1-second interval.
The terms "frequency" and "pitch" are interchangeable. The higher the pitch of a note, the faster a wave repeats itself.
A singer's throat vibrates at 440Hz when singing a "A4" note (the "A" in the centre of a standard piano). Their larynx would vibrate at 523Hz if they raised their voice to a "C5" note, 3 semitones higher.
This phenomena is not limited to music. Consider an automobile engine, and how the higher the pitch is the faster it "revs." The same can be true for a drill or a hand mixer. A discernible pitch should be present in any physical object that emits sounds hundreds or thousands of times per second.
However, not all sound is periodic. White noise, for example, is just a uniform distribution of audible frequencies, such as the sound of static or waves smashing on the shore. It has no discernible pitch because it isn't periodic.
With the frequency slider, play about with the frequency.
Don't forget to use the M key to enable sound to hear how frequency and loudness effect the final sound!
2. How Sound Works
We scraped the surface of how sound works in Part 1 by seeing displacement as a vibrating guitar string and the impact it has on sound molecules. Let's see if we can figure out a little more about this.
Molecules abound in the air we breathe. When you play a sound through a speaker, it vibrates really quickly. That vibration travels through the air molecules in a chain reaction until it reaches your ear, where it is interpreted as sound by the brain.
Assume that each dot in this grid represents a single air molecule:
Each dot oscillates back and forth at a speed determined by the frequency and a displacement regulated by the amplitude.
Because this is a chain reaction, the effects of the vibrations travelling from left to right can be seen, but this is an optical illusion: the air molecules aren't flying through space, they're just vibrating. That vibration, however, travels through the field.
The oscillation of a single air molecule may be seen in the waveform to the left. In the grid below, compare the blue dot added to the waveform graph to indicate current displacement with the first column of air molecules:
Because our waveform graph is simply a depiction of the change in displacement over time, it corresponds to exactly what is going on with the air molecules!
Try experimenting with the amplitude and frequency sliders to observe how they impact the air molecules in the grid if you haven't already.
3. Harmonics
We've been adjusting the amplitude and frequency of a waveform so far, but we've always used the same waveform shape.
The curve of the waveform line, or how the displacement changes over time, is referred to as the shape of a waveform.
A sine waveform is what we've been looking at. The fundamental waveform is a waveform that has its origins in trigonometry.
This is due to the fact that it is unadulterated: there are no "side effects." The only frequency you hear when playing a 440Hz sine wave is 440Hz. Sine waves are the "basic" wave; they don't have any extra features.
Harmonics are the frequencies that occur as a result of a waveform's "side effect."
We need a means to represent the additional frequencies in order to understand how harmonics work. Let's use a bar graph as an example. The graph of the sine wave is as follows:
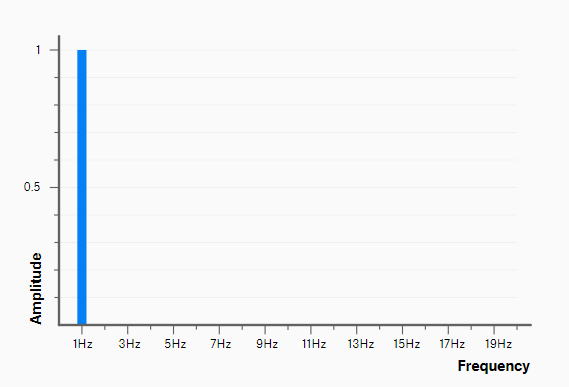
This graph is quite dull. There are no harmonies in the sine waveform because it is the fundamental waveform! You get exactly what you see. A 1Hz wave produces a 1Hz tone, and that's all there is to it.
The Triangle Waveform
Our first non-sine waveform, yay!
It has a similar appearance to the sine, but without the curviness. Instead, straight lines form triangle-like forms when they intersect.
What impact does this have on the sound quality? If you haven't already done so, press the M key to activate sound, then scroll between this and the previous section to hear the difference.
Have you noticed that the sound has become a little "brighter"? Isn't it a little less muted now? Harmonics are the reason behind this.
Certain waveforms produce harmonics, which are additional frequencies. Soon, we'll find why that is, but first, let's plot these additional harmonics:
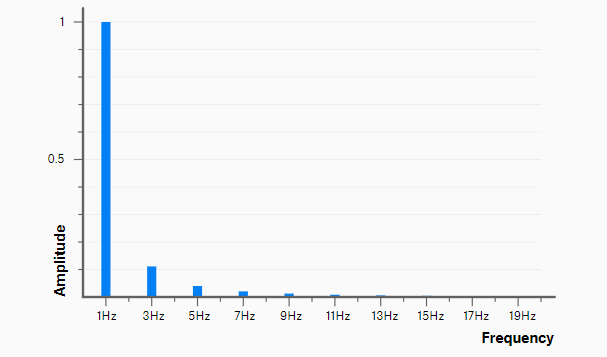
Harmonics are always a multiple of the root frequency. Different waveforms have different selections, but they always follow the same pattern:
▪ Fundamental note (root frequency): 1Hz.
▪ Second harmonic (2x frequency): 2Hz.
▪ Third harmonic (3x frequency): 3Hz.
▪ Fourth harmonic (4x frequency): 4Hz.
▪ This pattern continues to infinity.
Triangle waves only have odd harmonics. That means they have the root note, 3rd harmonic, 5th harmonic, 7th harmonic, and so on. These harmonics "taper off" as you get further away from the root frequency.
The Square Waveform
Among the common periodic waveforms, the square waveform is likely the most severe. It alternates between the greatest and lowest numbers conceivable. It's a binary wave with only two possibilities: +1 or -1.
The harmonics in the square waveform are identical to those in the triangle waveform: Each "abnormal" harmonic (3rd, 5th, 7th, etc). The distinction is that as you get further away from the root frequency, the square wave harmonics don't "fall off" as much. Consider how much louder square waves' higher-frequency harmonics are:
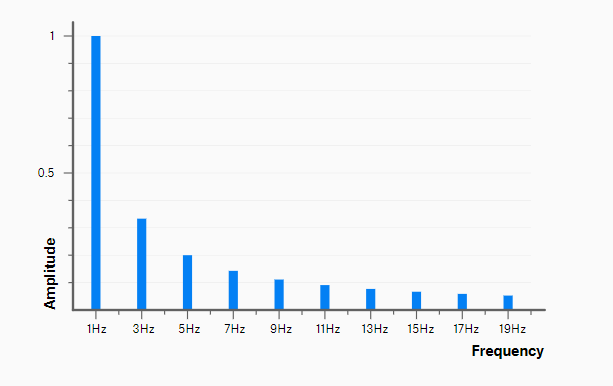
This is plainly noticeable in the sound: squares sound much "brighter" than triangles.
The Sawtooth Waveform
Last but not least, there's the sawtooth. This waveform, which is named after saw blades, combines the linear ascent of the triangle waveform with the abrupt drop of the square waveform.
When you run a bow across a violin's string, friction between the two items causes the string to slip and catch, causing the string to vibrate in a sawtooth-like pattern. Real instruments, of course, produce significantly more complicated waves than these simple waveforms!
Sawtooth waveforms, unlike triangles and squares, include additional frequencies for every multiple of the root frequency, whereas triangles and squares only have odd harmonics.
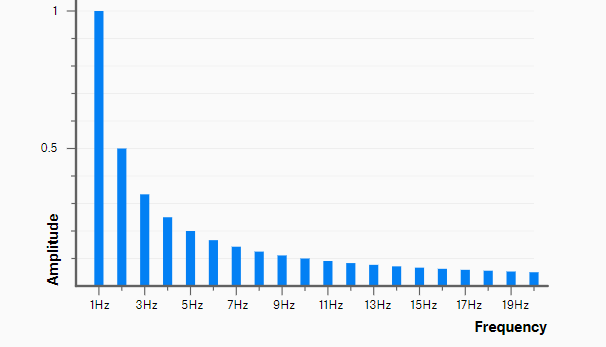
4. Additive Synthesis
We learnt about how different waveforms have different harmonics in the previous section, but it's unclear why that is. Why does a square wave, for example, have so many more tones when we're still oscillating at a single frequency?
To make sense of this, consider the following startling fact regarding waveforms: they can all be created by stacking a lot of sine waves on top of each other.
++=
At first glance, this is unlikely to make sense. How can sine waves be coupled to create waveforms that are dramatically different, such as square or sawtooth?
The explanation lies in the operation of waveform addition.
Two waves can be seen in the waveform graph we've been looking at:
▪ 1Hz at 1 amplitude
▪ 3Hz at 0.33 amplitude
▪ Put another way, this second wave is 3 times as fast, but at one-third the amplitude.
▪ If you've ever used audio editing software, you've seen how a full song—which is comprised of many different instruments and sounds—creates a single waveform. What we're looking at over there is not a waveform yet: we have to merge the two lines to form one.
▪ This is known as waveform addition. Let's try to understand it in real-world terms.
▪ Remember, sound is just the vibration of air molecules. If you play 2 distinct tones, they both cause the air molecules to vibrate. A game of tug-of-war has 2 people pulling on a rope, and the displacement of the rope is the result of both people's effort.
▪ So, we just need to "add" the two waveforms together to get our end result. How does the addition work? It's arithmetic: imagine the waveform graph as a bunch of individual points. At each point, you simply add the individual displacement values. The new set of points is our new single waveform.
▪ Use the new Convergence slider to watch as the two lines are added together.
▪ Notice how it kinda looks like a square wave, if you squint?
▪ You might be wondering where the values for that first harmonic came from. Why did we choose these waveforms specifically?
▪ 1Hz at 1 amplitude
▪ 3Hz at 0.33 amplitude
The answer is that we reverse engineered the square waveform. Remember this chart, showing the harmonics for a square wave?
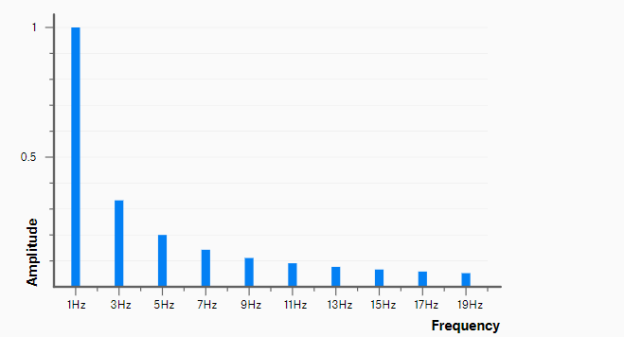
In this chart, the two waves we're charting are the initial two waves!
As we add additional harmonics from this chart, our waveform begins to resemble a square wave. Change the number of harmonics using the new # of Harmonics slider to see how it influences the converged line.
Phase
Waveform addition has the strange side effect of not necessarily making the resulting sound louder.
To better understand this, we must first learn about another waveform property: phase.
In simple terms, phase refers to the amount of offset provided to a wave, which is measured in degrees. A wave that is 180 degrees out of phase, for example, is 50 percent delayed in its duration.
In terms of amplitude and frequency, our waveform graph on the right has been modified to display two identical waves. To see how phase impacts the second waveform in relation to the first, try altering the new phase slider.
To see how the phase of a waveform influences the loudness of the generated wave, use the convergence slider.
Chords
Another, arguably more concrete, approach to think about waveform addition is to think musically. After all, when you play a chord on the piano, all you're doing is combining three waves.
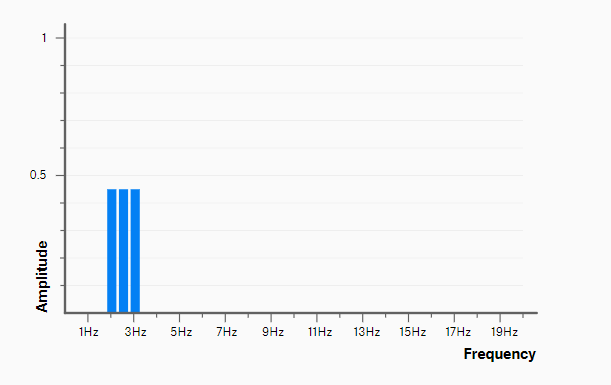
There are just two variables in sound: time and displacement, according to a fundamental principle. We can make whatever sound we choose by displacing air molecules at the appropriate time and in the proper amount.
The harmonics associated with various waveforms, as well as the additional waves required to construct chords, are just the arithmetic required to achieve the appropriate displacement at the appropriate time.
In Conclusion
Sound travels as an audio wave, which is the vibration of air molecules. A waveform depicts the displacement of an air molecule over time as a graph.
The strength of a wave's effect is measured in amplitude; the higher the amplitude, the more air molecules are displaced. For the human ear, this translates to loudness; increasing the amplitude of a wave increases how loud it appears to us.
The sine, triangle, square, and sawtooth are the most common periodic waveforms.
Because the wave they represent may be repeated to produce a steady tone, these waveforms are referred to as periodic. The higher the pitch of the sound, the faster the wave repeats.
Harmonics vary depending on the waveform. A harmonic is a frequency that is formed by the wave. The sine waveform is unique in that it is the fundamental waveform, meaning it has no further harmonics.
We can approach the problem from the opposite end to understand why certain waveforms have harmonics. Because the sine waveform is the fundamental waveform, it may be used to approximate all other periodic waveforms by simply adding more sine waves at the right harmonics and amplitudes. A square wave is essentially an unlimited series of sine waves that all occur at extremely specified frequencies and amplitudes.
The scale is the difference. The additional "notes" in harmonics are all multiples of the root frequency, whereas in western music, an octave is divided into 12 intervals.
For the sake of illustration, here's a C Major chord made up of three sine waves.
2.10.3 Basic Waveform Analysis with an Oscilloscope
We'll utilise a Tek MDO Mixed Domain Oscilloscope to demonstrate possibilities for measuring various circuit parts in this first part of a multi-part series.
Basic Oscilloscope Operation (Supporting Information)
The oscilloscope is a vital diagnostic tool that may be used to troubleshoot malfunctioning circuits, double-check product design before shipping, and reverse-engineer items for "hacks."
Using the Tektronix MDO3104 oscilloscope that was provided by Tektronix, we will investigate the many uses of an oscilloscope. Part 1 will demonstrate the variety of today's oscilloscopes.
Getting a Scope
When writing articles, we usually include a link to where readers may get the parts they need from a variety of suppliers. Because the equipment utilised in this essay is so expensive, it seemed reasonable to discover a way for readers to obtain one in a different way. You can rent, rent-to-own, lease, finance, or buy secondhand oscilloscopes from firms like Microlease if you can't afford to buy a new one.
A Note Before We Begin
The Tektronix MDO3104 oscilloscope is used in all of the examples in this article.
Several test instrument manufacturers offered to make test instruments accessible for this study, including Rigol and BK Precision, and I would like to thank all of them for their kindness. They're all top-of-the-line equipment.
This page isn't meant to be a how-to manual for the Tektronix MDO3104. It uses the Tektronix MDO3104 as an example to demonstrate the many features and functionalities of most mid-range oscilloscopes.
I'll teach you how to operate the machine I have; the reader should consult the documentation for their specific scope for key presses and menu options. I use bold to signify physical manipulation of the scope, such as turning knobs or pressing buttons, and quote marks to signify a menu selection.
Oscilloscope Displays
We can use oscilloscopes to figure out how particular variables in electrical circuits relate to each other. The first oscilloscopes could only display the relationship between potential difference and time. Today's oscilloscopes keep the history of monitoring voltage vs. Time alive while also offering a wide range of advanced data-analysis capabilities, display features, and triggering options.
You must know how to interpret what is offered to you in order to grasp what electrical relationships exist in your circuits.
In an oscilloscope, this is a typical single waveform display, with time on the horizontal axis and potential difference on the vertical axis.
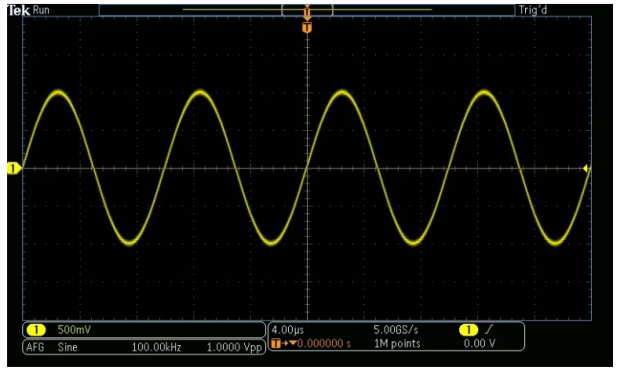
You'll notice 1 500mV in the lower left corner of the image, which means two things:
On the oscilloscope, channel 1 is seen in yellow.
Each grid rectangle in channel one corresponds to 500 mV in the vertical direction. In the vertical direction, we have "500 millivolts per division" with 8 vertical rectangles visible, and so 500mV1division8divisions=4V500mV1division8divisions=4V visible.
AFG Sine 100.00kHz 1.0000 Vpp: AFG Sine 100.00kHz 1.0000 Vpp: AFG Sine 100.00kHz 1.0000 Vpp: AFG Sine 100.00kHz 1.0000 Vpp: AFG Sine 1
The Arbitrary Function Generator (AFG) is now functioning (I used it to create this waveform)
The shape of the waveform is sine.
The waveform's frequency is 100.000 kHz, which is 100,000 cycles per second
The transmitted waveform's amplitude is 1.0000 Vpp.
Another box with the following information can be found at the bottom-center:
"4 microseconds per division" is the value of each rectangle in the horizontal direction, which is 4.00 s. Because there are ten rectangles on the screen, 4.00s1 division10divisions=40s The time is displayed in 4.00s1 division10divisions=40 s over the full screen.
The oscilloscope is recording at a rate of 5.00 GS/s (51095109 samples per second).
The triggering of the waveform is controlled by Channel 1
The rising edge of the channel 1 waveform triggers the action.
T 0.000000 s from the trigger point, the image is centred.
A total of 1 million (1 M) data points will be gathered.
When a rising signal passes through 0 V, it triggers.
How to Make Basic Measurements with an Oscilloscope
To demonstrate how far oscilloscopes have progressed over the last few decades, I'll show you how the oscilloscope may be used to make basic frequency (or period) and peak-to-peak amplitude measurements in a variety of methods.
Activate the Arbitrary Function Generator
Begin by attaching oscilloscope channel 1 to the rear of the scope's Arbitrary Function Generator (AFG) BNC connector. Press the AFG button right above the Channel 1 probe input to activate the Arbitrary Function Generator. Use the rotary knob Multipurpose a to select "Ramp" from the first bottom menu option below "Waveform."
Turn on Channel 1
To turn it on, press the Channel 1 button. Rotate the Horizontal Scale knob clockwise to spread a complete wave across the majority of the screen. If you want, you can move it about on the screen using the Horizontal Position knob.
2.10.4 Using the Graticule to Make Measurements
A graticule is a set of lines on an oscilloscope monitor. When measuring waveforms, major and minor gridlines (or dots) are utilised. Major gridlines appear on the oscilloscope screen as solid or dotted lines that run the length or width of the screen. At the bottom of the display, the voltage and time that correspond to the divisions produced by the principal gridlines are displayed. Subdivisions between major gridlines are known as minor gridlines. Between gridlines, there are normally 4 or 5 subdivisions. I used the Horizontal Position rotary dial to move the waveform such that the positive peaks of the waveform line up with main vertical gridlines in the following example.
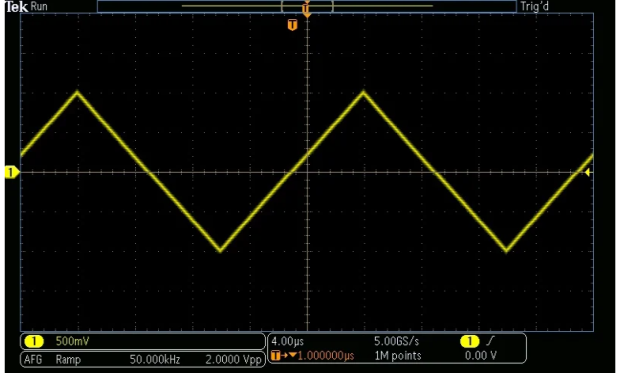
In the vertical direction there are 500 mV per division and the distance from lowest point to highest point is 4 rectangles for 500mV1division×4divisions from peak to peak=2000mVpp=2Vpp500mV1division×4divisions from peak to peak=2000mVpp=2Vpp.
In the horizontal direction there are 4.00 µs per division and there are 5 divisions before the signal begins to repeat,
Giving 4.00μs1division×5divisions1period=20μs1period4.00μs1division×5divisions1period=20μs1period.
Using the Cursors to Make Measurements
Digital oscilloscopes eliminate the need for guesswork when using the graticule. Press the Cursors button to activate the cursors, and then use the rotary dials Multipurpose a and Multipurpose b to move them to the areas of the waveform you want to examine. I relocated the cursors to the wave's positive peaks in the following example.
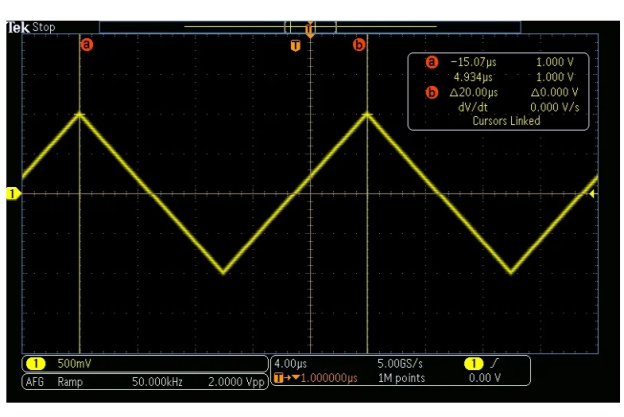
A new box will appear in the upper right corner, including information about the potential difference and time values for the points a and b. The time interval between the two points, i.e. 20.00s20.00s, is what we're interested in here.
Switch to horizontal cursors by pressing and holding the Cursors button again and selecting "Cursors-Screen" and "Bars-Horizontal" to discover the Peak-to-Peak potential difference. Then, to facilitate your adjustment, use the Multipurpose a and Multipurpose b knobs to alter the location of the cursors, as well as "Cursors connected." By hitting the Select button, you can switch between horizontal and vertical measurements.
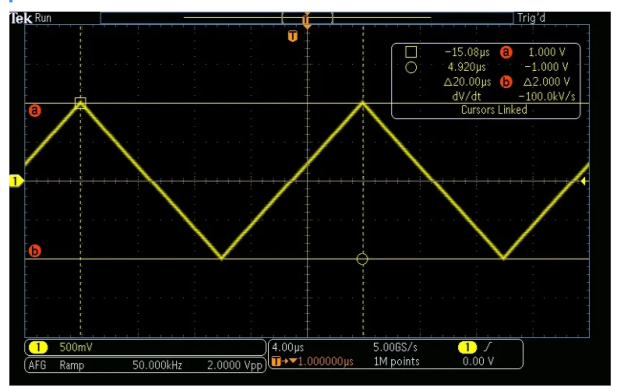
The potential difference between the two points, 2.000V2.000V, is what we're interested in here.
A video walkthrough of the actions you'll need to take may be found below. The proper button or knob on the Tektronics model is indicated by orange highlights in each stage.
2.10.5 Using the Digital Volt Meter to Make Measurements
The DVM is a handy function found in mid-range oscilloscopes (Digital Volt Meter). The DVM instrument does all of the functions that a standard multimeter would. Enable it by pressing the Measure button in the Wave Inspector box, then "DVM," then selecting (for example) "Frequency" with Multipurpose a. I've included the frequency (in the centre) as well as frequency statistics (on the right). In addition, I could show AC+DC RMS voltage, DC voltage, or AC RMS voltage.
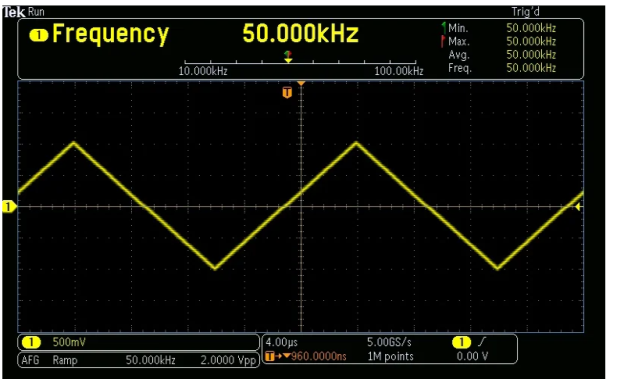
Use Multipurpose b to pick "Period," then "OK" from the bottom menu button below "Add Measurement." Then press "Add Measurement" again, this time selecting "Amplitude" with Multipurpose b, then "OK." Period and Amplitude are now displayed towards the bottom of the page in a less conspicuous manner. You can get rid of them by clicking the "Remove Measurement" option, then "Remove All Measurements." The Menu Off button can be used to simplify the display at any moment.
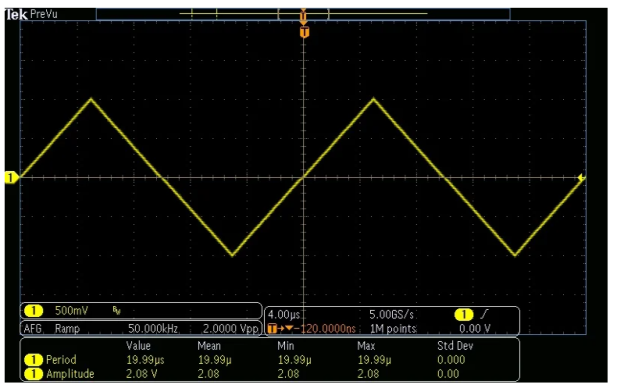
Measurements from the Terminal
Just when you thought I'd exhausted all possibilities for measuring the same waveform, the terminal appears. I used Telnet to connect to the oscilloscope, then remotely turned on the DVM, set it to record frequency, and queried the value. To accomplish this, use an Ethernet cable to connect the oscilloscope to a switch or router on your local network. The oscilloscope will ask the DHCP server for an IP address and display it on the screen.
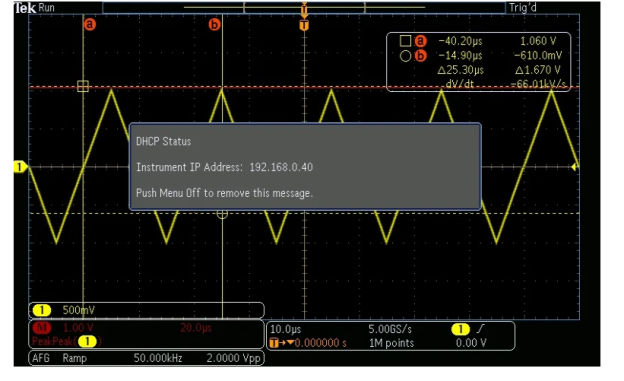
Then connect to the oscilloscope using your favourite terminal application. Using the Telnet protocol, I connected to the IP address on the screen using PuTTY.
4000 is the default port.
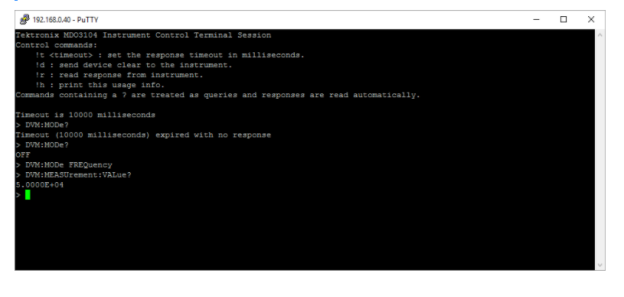
On a Windows PC, you may do the same thing by typing "telnet 192.168.0.40 4000" into the run dialogue ("Windows Key" + "R").
Using Advanced Math
From elementary arithmetic to Fast Fourier Transforms and all in between, the math tool allows you to perform all kinds of mathematical operations on waveforms. I'm determining the frequency of my waveform with the frequency measurement function.
To access the math menu, press the Math button, then "Advanced Math" and "Edit Expression." Select "Frequency(1)" and then "OK" using Multipurpose a to browse through the functions.
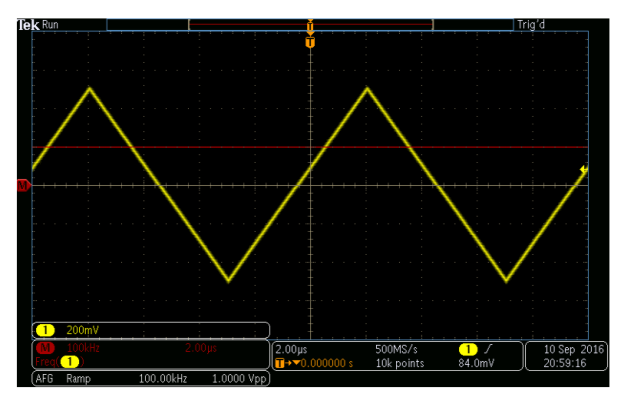
The math menu is a little hard to see. In the lower left corner, it is red. It indicates 100 kHz per division in the vertical direction where 100 kHz is displayed. The horizontal red line (the output of the math module) is one division above zero, indicating a continuous reading of 100 kHz. In the horizontal direction, the 2.00 s signifies that there are 2.00 s each division.
2.11.1 Measurement of Voltage Current and Frequency by Oscilloscope
An oscilloscope is a gadget that is commonly used in the electrical sector to display the graph of an electrical signal as it varies over time. However, several of the scopes offer additional characteristics in addition to their primary function. Many oscilloscopes offer a measuring tool that allows us to accurately measure waveform parameters such as frequency, voltage, amplitude, and other factors. A scope can often measure both time and voltage-based parameters. Measurement of Voltage
The oscilloscope is primarily a voltage-oriented device, or a voltage-measurement device. Internally, voltage, current, and resistance are all connected.
Simply measure the voltage; the rest of the values are calculated. The quantity of electric potential between two locations in a circuit is known as voltage. Peak-to-peak amplitude, which measures the absolute difference between the signal's maximum and minimum points, is used to calculate it. The highest and minimum voltages of the signal received are displayed on the scope. Scope estimates the average of the minimum and maximum voltages after monitoring all high and low voltage spots. However, you must specify which voltage you are referring to. The input range of an oscilloscope is normally set, however this can be easily expanded by using a simple potential divider circuit.
Method to Measure Voltage
1. To measure a signal, set the trigger button to auto, which causes the oscilloscope to begin measuring the voltage signal by recognising the zero voltage point or peak voltage on its own. As soon as one of these two locations is detected, the oscilloscope triggers and the voltage signal's range is measured.
2. The vertical and horizontal settings are adjusted to ensure a clear and stable display of the sine wave. Take measurements along the vertical line with the smallest divisions, which is the middle vertical line. Vertical control will be used to read the voltage signal.
Current Measurement
An oscilloscope cannot directly detect electrical current. However, by using probes or resistors, it could be measured indirectly within scope. The voltage across the points is measured by the resistor, which then uses Ohm's law to compute the magnitude of electrical current by replacing the voltage and resistance values. Using an oscilloscope and a clamp-on current probe is another simple technique to monitor current.
Method to Measure Current
1. Connect an electrical circuit to a probe with a resistor. Make that the power rating of the resistor is equal to or greater than the system's power output.
2. Next, use Ohm's Law to compute the current using the resistance value.
Ohm's Law states that

Frequency Measurement
On an oscilloscope, frequency can be measured by looking at the frequency spectrum of a signal on the screen and doing a quick computation. The number of times a cycle of an observed wave occurs in a second is known as frequency. A scope's maximum frequency range varies, but it is always in the 100s of MHz range. Scope examines the rise and fall time of the wave to verify the performance of signal responsiveness in a circuit.
Method to Measure Frequency
1. Raise the vertical sensitivity to acquire a good picture of the wave on the screen without reducing its amplitude.
2. Now increase the sweep rate until the screen shows more than one but not more than two complete cycles of the wave.
3. Count the number of divisions on the graticule from beginning to end for one entire cycle.
4. Now double the horizontal sweep rate by the number of units you counted for a cycle. It will tell you how long the wave will last. The period is the amount of seconds it takes for each waveform to repeat. You can easily calculate the frequency in cycles per second using period (Hertz).
2.11.2 Frequency and Phase Measurement
Frequency is an important electrical parameter that has no counterpart in DC circuits.
Frequency measurement is critical in many alternating current applications, particularly in AC power systems built to operate efficiently at only one frequency.
If the AC is generated by an electromechanical alternator, the frequency is directly proportional to the machine's shaft speed, and the frequency can be detected simply by measuring the shaft speed.
Other methods of measurement will be required if frequency must be measured at a distance from the alternator.
Method of Frequency Measurement
Using the Principle of Mechanical Resonance
The notion of mechanical resonance is used in one basic but rudimentary method of frequency measuring in power systems. Every physical object with the elasticity (springiness) quality has a natural frequency at which it prefers to vibrate.
A good example is a tuning fork: if you strike it once, it will continue to vibrate at a tone that is proportional to its length. Longer tuning forks have lower resonance frequencies, which means their tones will be lower on the musical scale.
Consider a row of tuning forks of varying sizes positioned side by side. They're all mounted on the same base, which is vibrated by an electromagnet at the frequency of the recorded AC voltage (or current).
The tuning fork with the closest resonance frequency to the vibration's frequency will shake the most (or the loudest). We could see the relative speed of each fork by the duration of the blur we saw as we studied each one from an end-view perspective if the tines were flimsy enough.
Make a set of "tuning forks" out of a strip of sheet metal cut in a rake-like pattern, and you've got yourself a vibrating reed frequency metre:
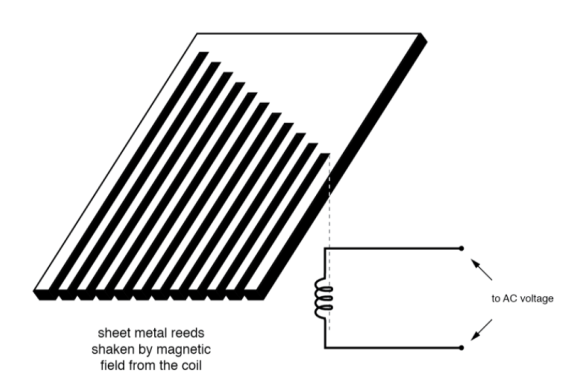
The user of this meter views the ends of all those unequal length reeds as they are collectively shaken at the frequency of the applied AC voltage to the coil. The one closest in resonant frequency to the applied AC will vibrate the most, looking something like:
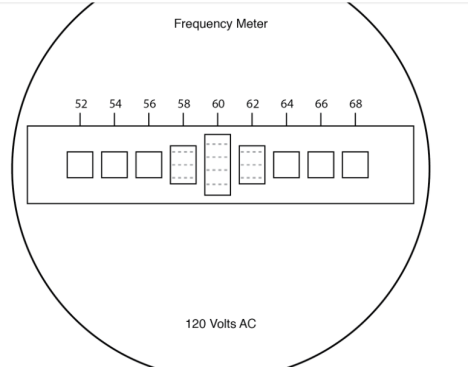
Fig. Vibrating reed frequency meter front panel.
Obviously, vibrating reed metres are not precision instruments, but they are basic and thus easy to construct in a tough manner. They're commonly seen on small engine-driven generator sets, where they're used to adjust the engine speed to keep the frequency near to 60 (50 in Europe).
Using a form of Tank Circuit
The working principle of reed-type metres is not imprecise. We may use an inductor and capacitor in the form of a tank circuit to replace mechanical resonance and create a frequency metre that uses electrical resonance instead (parallel inductor and capacitor). See the diagram below.
A metre is placed in the circuit to indicate the maximum amplitude of the voltage across the two components, and one or both components are made adjustable.
After the device has been adjusted for the maximum indication on the metre, the frequency is read from the adjustment knobs, which are calibrated to show resonant frequency for any given position.
This is essentially a tunable filter circuit that is adjusted and then read in the same way that a bridge circuit is balanced for a "null" condition and then read.
Resonant frequency meter “peaks” as L-C resonant frequency is tuned to test frequency.
This method is popular among amateur radio operators (at least it was before the arrival of low-cost digital frequency counters), owing to the fact that it does not require a direct connection to the circuit.
It will operate as long as the inductor and/or capacitor can intercept enough stray field (either magnetic or electric) from the circuit under test to cause the metre to signal.
The most accurate ways of measurement in frequency, as in other types of electrical measurement, are usually those in which an unknown quantity is compared to a known standard, with the basic instrument doing nothing more than indicating when the two amounts are equal.
This is the fundamental principle of the DC (Wheatstone) bridge circuit, and it is a sound metrological principle that may be found in a variety of fields. By comparison, measuring an unknown frequency should be reasonably simple if we have access to an exact frequency standard (an AC voltage source that holds a single frequency very precisely).
Using Quartz Crystal
We return to the tuning fork, or at least a more modern form of it known as the quartz crystal, for that frequency standard.
Quartz is a naturally occurring mineral with a unique feature known as piezoelectricity. When physically strained, piezoelectric materials produce a voltage along their lengths, and when an external voltage is applied across their lengths, they deform.
In most situations, this deformity is relatively little, although it does exist.
Quartz rock is elastic (springy) within the tiny range of bending caused by an external voltage, implying that it has its own mechanical resonance frequency that can be represented as an electrical voltage signal.
In other words, if a quartz chip is struck, it will "ring" with its own unique frequency dictated by the chip's length, and this resonant oscillation will produce an equivalent voltage at many spots on the quartz chip that may be tapped into by wires anchored to the chip's surface
The quartz chip, like the reeds on a vibrating-reed frequency metre, will tend to vibrate most when it is "stimulated" by an applied AC voltage at precisely the proper frequency.
Quartz rock chips can be precisely cut to achieve specific resonant frequencies, then set inside a protective shell with wires extending for connection to an external electric circuit.
The finished gadget is simply referred to as a crystal (or “xtal”) when packaged in this manner. The schematic sign is depicted in the illustration below.
That quartz chip is electrically equivalent to a series LC resonant circuit. (See diagram below) The analogous circuit gains an additional capacitive element thanks to the dielectric characteristics of quartz.
The series of "capacitance" and "inductance" are only electrical counterparts of the quartz's mechanical resonance qualities; they don't exist as independent components within the crystal. The capacitance indicated in parallel due to wire connections across the dielectric (insulating) quartz body is real, and it affects the overall system's resonant response.
It is not necessary to go through crystal dynamics in detail here; what is important to understand about crystals is resonant circuit equivalence and how it may be used in an oscillator circuit to generate a stable, predictable output voltage.
Crystals have far higher “Q” (quality) values as resonant elements than tank circuits made of inductors and capacitors, owing to the lack of stray resistance, which makes their resonant frequencies highly distinct and accurate.
Because the resonant frequency is exclusively determined by the physical properties of quartz (a mechanically very stable materials), a quartz crystal's resonant frequency change over time is extremely low. An electronic oscillator stabilised by the resonant action of a quartz crystal is how quartz movement watches achieve their exceptional accuracy.
However, for laboratory purposes, even more frequency stability may be required. To accomplish this, the crystal in issue can be placed in a temperature-controlled environment (typically an oven), which eliminates frequency inaccuracies caused by quartz thermal expansion and contraction.
Nothing has yet been discovered that can match the precision of a single resonating atom as a frequency standard. This is the idea behind the so-called atomic clock, which uses a mercury (or cesium) atom held in a vacuum that is activated by external energy to vibrate at its own frequency.
The resulting frequency is detected as a radio-wave signal, which is used to build the world's most accurate clocks. Several of these hyper-accurate clocks are maintained by national standards laboratories throughout the world, which broadcast frequency signals based on the vibrations of those atoms for scientists and technicians to tune in and utilise for frequency calibration purposes.
Practical Part
Now we get to the practical part: how do we compare an exact frequency against an unknown frequency to acquire a measurement once we have one?
A CRT can be used as a frequency-comparison device, for example. The electron beam is frequently deflected in both the horizontal and vertical axes in Cathode Ray Tubes.
There will be a pair of plates to the left and right of the beam, as well as a pair of plates above and below the beam, if metal plates are employed to electrostatically deflect the electrons, as shown in the diagram below.
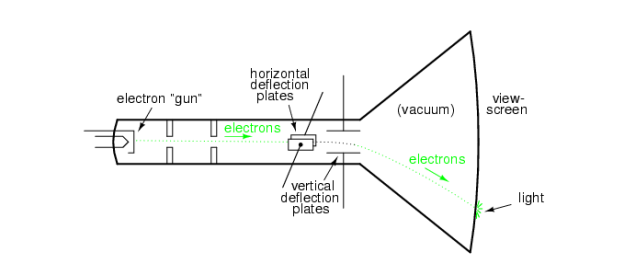
If we allow one AC signal to deflect the beam up and down (by connecting that AC voltage source to the “vertical” deflection plates) and another AC signal to deflect the beam left and right (by using the other pair of deflection plates), patterns will appear on the CRT screen that represent the ratio of the two AC frequencies.
These patterns are known as Lissajous figures, and they are a frequent method of frequency comparison in electronics.
If the two frequencies are the same, a simple figure will appear on the CRT screen, the shape of which will be determined by the phase shift between the two AC signals. Here's a look at some Lissajous figures for two sine-wave signals of equal frequency, as shown on the face of an oscilloscope (an AC voltage-measuring equipment with a CRT as its "movement").
The Lissajous figure is generated by two AC voltages that are perfectly in phase with each other in the first image:
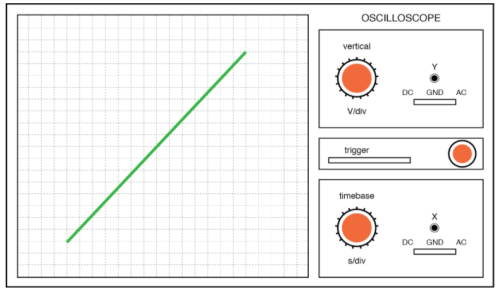
A straight line cannot be created if the two AC voltages are not in phase with each other. Instead, the Lissajous picture will resemble an oval, becoming perfectly round if the phase shift between the two signals is exactly 90° and their amplitudes are equal:
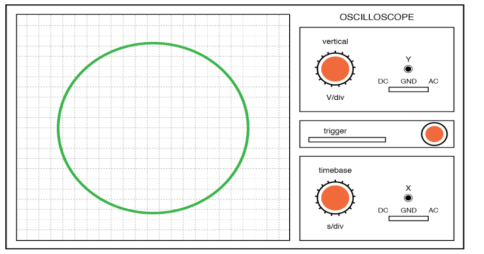
Finally, if the two AC signals are in phase opposite each other (180° shift), we will get a line, but this time it will be oriented in the opposite direction:
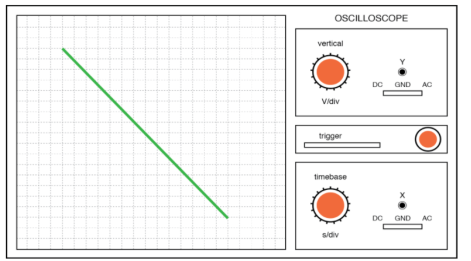
When dealing with signal frequencies that aren't the same, Lissajous figures get much more complicated. Consider the instances below, which have been assigned vertical/horizontal frequency ratios:
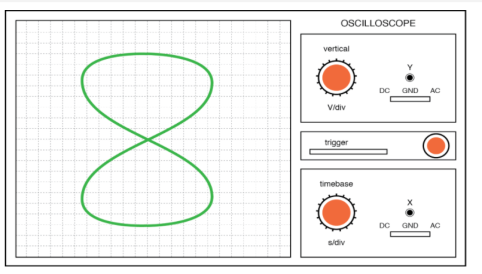
The Lissajous figure becomes increasingly complicated as the ratio between horizontal and vertical frequencies becomes more complicated. Consider the following illustration of a 3:1 horizontal-to-vertical frequency ratio:
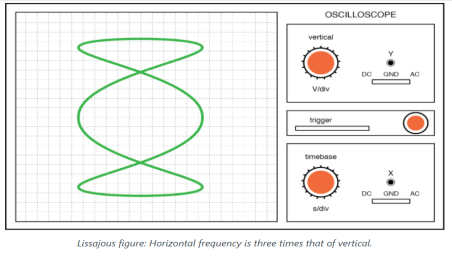
And a 3:2 frequency ratio (horizontal = 3, vertical = 2) in the figure below.
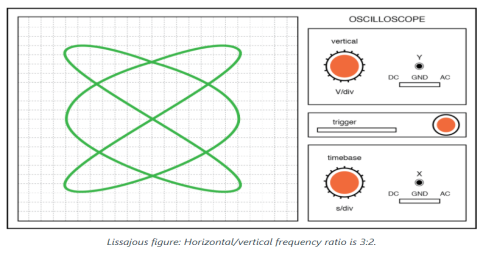
The Lissajous picture will appear to “move,” gently shifting orientation as the phase angle between the two waveforms rolls between 0° and 180° in circumstances when the frequencies of the two AC signals are not quite a simple ratio of each other (but close).
The Lissajous figure will be steady on the CRT viewscreen if the two frequencies are locked in an exact integer ratio to each other.
Lissajous graphics are only helpful as a frequency-comparison technique when the frequency ratios are simple integer values due to their physics (1:1, 1:2, 1:3, 2:3, 3:4, etc.).
Despite this disadvantage, Lissajous figures are a popular way to compare frequencies when a frequency standard (signal generator) is available.
2.11.3 Measurement of Electrical Quantities with a CRO
CRO is a very versatile instrument in laboratory for measurement of voltage, current, frequency and phase angle of any electrical quantity. But before we go ahead with discussion on measurement of electrical quantities with CRO, we should understand some basic oscilloscope patterns.
Basic Oscilloscope Patterns
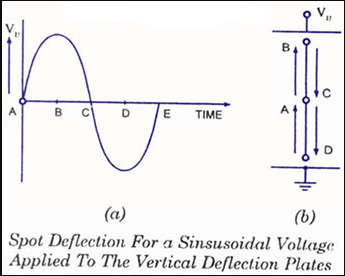
Assume that the horizontal deflection plates receive a sinusoidal voltage signal while the vertical deflection plates receive no voltage signal, as shown in figure.
Because the voltage is zero at point A in time, the spot in the screen's centre remains undeflected. Voltage Vh is at its maximum positive at point B in time, hence the spot is at the far right end of the screen. At point C in time, the voltage is zero again, and the spot returns to the centre of the screen. The voltage is at its most negative at point D in time, hence the spot is at the far left edge of the screen. The voltage is zero at point E in time, hence the spot returns to the centre of the screen. As a result, the spot on the screen travels from point A to position B for the following voltage cycle. As a result, a horizontal line appears on the screen.
One thing to keep in mind is that because no voltage has been applied to the vertical defection plates, this horizontal line is in the centre vertically.
When a sinusoidal voltage signal is provided to the vertical deflection plates and no voltage signal is provided to the horizontal deflection plates, a vertical line appears on the CRO screen, as shown in figure. This line would be horizontally in the centre of the screen.
We've already seen what happens when a sinusoidal voltage signal is applied to horizontal or vertical deflection plates on their own. Now we'll look at what happens when sinusoidal voltage signals are applied to both horizontal and vertical defection plates at the same time.
Consider the following scenario: two sinusoidal voltage signals of equal magnitude, frequency, and phase are applied to both the horizontal and vertical deflection plates, as illustrated in figure.
Voltages at both plates are zero at point A in time, hence the spot is in the middle of the screen. Because the voltages applied to both plates are maximum positive at point B in time, the spot appears at the extreme right end of the horizontal axis and extreme upward in the vertical axis. Both voltages are zero at point C in time, so the spot returns to the centre of the screen. The spot emerges at the extreme left end in the horizontal direction and extreme downward in the vertical direction at point D in time, when the voltages applied to both plates are maximum negative. Because both voltage signals are in phase and have the same amplitude and frequency, voltage signals applied to horizontal and vertical deflection plates have the same magnitude and sign at any given time. As a result, the spot moves in both horizontal (X-axis) and vertical (Y-axis) directions at any given time. As a result, a straight line with a 45° angle to the positive X-axis appears on the screen, as seen in figure.
It is critical to remember that the movement of the spot on the screen at any given time is the vector sum of the horizontal and vertical deflections, with the horizontal and vertical deflections being proportional to the voltages applied to the horizontal and vertical deflection plates, respectively. When sinusoidal voltage signals are given to horizontal and vertical deflection plates in phase and with identical amplitude and frequency, we get a straight line inclined at 45° to the positive X-axis, as previously indicated. When the amplitude of a sinusoidal voltage signal applied to vertical deflection plates is less than the amplitude of a voltage signal applied to horizontal deflection plates, the deflection is reduced.
The area of the spot along the Y-axis would be smaller than the area along the X-axis. As a result, we have a straight line that is inclined at an angle of less than 45 degrees to the positive X-axis. When the voltage applied to the vertical deflection plates is greater than the voltage supplied to the horizontal deflection plates, a straight line inclined at an angle more than 45 degrees to the positive X-axis results.
Consider the situation in which two sinusoidal voltage signals supplied to the horizontal and vertical deflection plates are of equal magnitude but phase opposite, as shown in figure.
Both voltage signals are 0 at time point A, therefore the spot is in the centre of the screen. The spot moves a maximum distance to the left and upward at point B in time, since the voltage applied to horizontal deflection plates is maximum negative and the voltage applied to vertical deflection plates is maximum positive, as illustrated in figure. Similarly, at point C in time, the spot returns to the screen's central position, and at point D, it moves to the maximum right and downward, as illustrated in the diagram. As a result, as illustrated in figure, we get a straight line inclined at 135° to the positive X-axis.
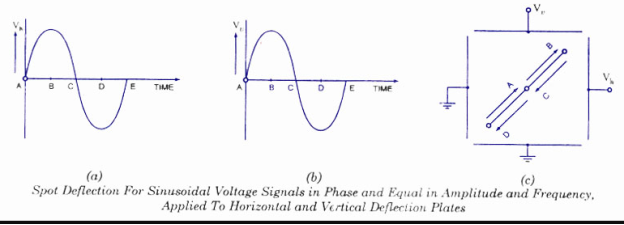
In the third scenario, a circle would appear on the screen if two sinusoidal voltage signals, 90° out of phase and of equal amplitude and frequency, were applied to the horizontal and vertical deflection plates. The voltage provided to the horizontal deflection plates is maximum positive at point A in time, while the voltage applied to the vertical deflection plates is zero, causing the spot to move to the extreme right end of the X-axis without moving along the Y-axis. The voltage applied to horizontal deflection plates is zero at point B in time, but the voltage applied to vertical deflection plates is maximum positive, therefore the spot moves maximally upward without moving horizontally. Similarly, the spot on the screen changes for points C and D in time, as indicated in figure. As a result, the spot traces a circle on the screen during one sine wave cycle.
2.11.4 Measurement of Phase Difference
A straight line or an ellipse emerges on the screen when two sinusoidal voltage signals of identical frequency with some phase variation are supplied to the deflection plates of CRO. When a straight line appears on the screen, the phase angle difference is zero or 180°, but when an ellipse appears on the screen, we must use a formula to determine the phase difference.
Consider the following two sinusoidal voltage signals:
Vh = Vh Sin ωt
Vv = Vv Sin (ωt+Ф), where Ф is the phase difference.
Since deflection is directly proportional to the amplitude of voltage
So dh = Dh Sin ωt
Dv = Dv Sin (ωt+Ф)
At time t=0, values of dh and dv are dh0 = 0 and dv0 = Dv Sin Ф
So Sin Ф = dv0/Dv
Graphical meaning of dv0 and Dv are shown in the figure. Thus the phase difference between two sinusoidal voltages of equal frequency can be determined by measuring dv0 and Dv.
In the given figure Vv is shown by leading Vh by a phase angle Ф. If the situation is reversed and Vh leads Vv by phase angle Ф, then again same ellipse would appear on the screen. Because of this fact we can determine only the phase angle between two sinusoidal voltages. It does not indicate which one is leading and which one is lagging.
2.11.5 Measurement of Frequency of a Voltage Signal
The Lissajous patterns are the patterns obtained on the CRO screen and covered in earlier sections. A stationary Lissajous pattern on a CRO's screen is known as a Lissajous pattern. It indicates that for each cycle of a voltage signal, the spot prints out the same pattern. To have a consistent pattern, the frequency ratio of vertical and horizontal voltage signals should be a rational or fractional value, as we have already discussed. As a result, having a Lissajous pattern on the CRO screen is a need.
Fy / Fx = A/B
Where A and B are integers.
Lissajous patterns are usually of two types. First one is closed Lissajous pattern and has no free end. Second one is open Lissajous pattern and has free ends. Both types of Lissajous patterns are shown in figure.
In a Lissajous pattern ratio of frequency of vertical signal to the frequency of horizontal signal is equal to the ratio of positive Y-peaks to positive X-peaks in that pattern.
Fy / Fx = Positive Y – peaks in pattern / Positive X – peaks in pattern
The ratio of frequencies of two voltage signals can be measured by counting the positive Y-peaks and X-peaks on a Lissajous pattern. The free end of an open lissajous pattern is considered half peak. Examples will demonstrate this.
Vertical deflection plates receive an unknown frequency voltage signal, whereas horizontal deflection plates are supplied by a precisely calibrated variable frequency source. The variable frequency source's frequency is changed until the screen displays a stationary pattern. The frequency of the voltage signal applied to vertical deflection plates may now be determined by reading the value of the horizontal signal's frequency and using a calibrated scale.
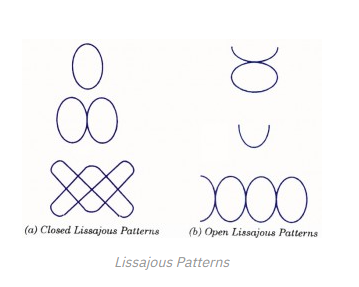
The frequency of the sinusoidal voltage supplied to vertical deflection plates is the same as the voltage applied to horizontal deflection plates if a single loop stationary pattern is obtained. The frequency of alternating voltage can be calculated using the relation Points of tangency to a vertical line / Points of tangency to a horizontal line = x/y = fx/fy if a complex Lissajous graphic is generated.
One thing to keep in mind is that for the voltage signals of the provided frequencies, we may see a variety of patterns on the CRO screen, as shown in figure
Because the ratio of Y-peaks to X-peaks is the same in both representations, the ratios of vertical and horizontal signal frequencies are the same. However, due to significant phase differences in voltage signals applied to vertical and horizontal deflection plates, the appearance of Lissajous patterns varies.
Because the accuracy of the calibrated scale of the variable frequency source, which is normally a few percent, the CRO is not a precision device for measuring frequency of an alternating voltage. It's used to get a rough estimate of frequency or when the voltage waveform is too complicated for a frequency counter to work properly.
2.11.6 Measurement of Voltage and Current
Because the deflection of the electrostatic beam is precisely proportional to the deflection plate voltage, the Cathode Ray Oscilloscope can be used to monitor voltage of any electrical specification.
To measure direct voltage, the spot is initially centred on the screen without any voltage signal applied to the deflection plates. Then, between a pair of deflection plates, a direct voltage is supplied to be measured, and the deflection of the spot is observed on the screen. The direct voltage applied is equal to the size of the deflection multiplied by the deflection factor. The screen is usually calibrated for a specific working condition, so the CRO may measure voltage directly by reading the scale.
When measuring alternating voltage with a sinusoidal waveform, it is applied between two deflection plates and the straight line length is measured. The peak to peak value of applied ac voltage can be calculated using the deflection sensitivity. For a sinusoidal wave-form, the rms value of applied ac voltage is equal to the peak value divided by 22
The current being measured is conducted via a known non-inductive resistance, and the voltage drop across it is measured by CRO, as previously indicated. The current can be calculated by simply dividing the voltage drop by the non-inductive resistance value. The voltage drop across non-inductive resistance (small value) is frequently increased by a calibrated amplifier when the current to be measured is of extremely tiny magnitude.
A twin beam cathode ray oscilloscope can measure both current and voltage at the same time.
References:
1. The Art of Electronics by Paul Horowitz and Wilfield Hill, Cambridge University -2006
2. Electronics by Allan R. Hambley, Prentice Hall - 1994
3. Digital Logic and Computer design M. Morris Mano (Pearson) -2016
4. Concepts of Electronics D.C. Tayal (Himalaya Publishing house) -2018