Unit - 1
Classical Statistics -1
A microstate is a specific configuration of a system's constituent parts that results in a macrostate that can be observed from the outside.
Consider a box with two particles and only one quantized unit of energy (meaning it can't be divided; it must go to one of the two particles entirely). Because assigning the unit of energy to particle A results in a different microstate than assigning the unit of energy to particle B, there are two microstates. The macrostate, in both cases, is the system's single unit of energy. The arrangement of the particles inside the box is irrelevant when discussing the macrostate, so there is only one.
When calculating entropy and internal energy, microstate considerations are extremely helpful. In fact, because entropy is defined in terms of a constant and the natural log of the number of microstates, the only input required to calculate it is the number of microstates.
S = kB ln Ω
Microstates
Combinatorics is typically required for problems involving the counting of microstates.
Example
Ten red or blue balls are contained in a box. How many different microstates are required to satisfy the macrostate of three red balls?
Solution: We have a ten-ball arrangement and need exactly three of them to be red, which can be done in ten different ways.
10C3 = 
Poker example
Consider the system of a poker hand drawn from a standard 52-card deck. The exact state of the system can be determined by answering the question, "What cards are in the hand?" There are 525 possible answers, including 5,K,J,2,3,4. Because it specifies the exact value of each card, this type of description is referred to as the system's microstate. Furthermore, because every hand has the same chance of coming out of the deck, every microstate is equiprobable, the probability of that exact hand being drawn is simply 1/ 525.
Fortunately, poker players are more interested in whether a hand is a "flush," "straight," or "four of a kind," rather than the exact microstate description. Because it captures the essential information (a pattern description) without specifying the details, this is referred to as the macrostate description of the system (the exact cards).
Consider using the microstate description to determine poker winners. The time-consuming solution for each set of hands entails consulting a 52 5 =2,598,960-entry lookup table, searching through the list for the exact match to each hand, and comparing their values.
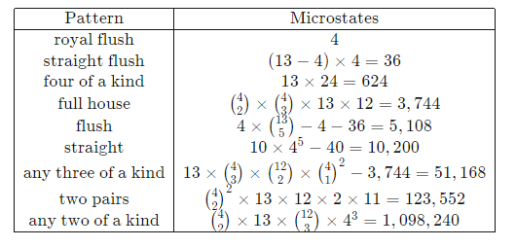
Instead, concentrate on a much smaller set of possibilities in the macrostate description, such as "hands in which any four of the cards in the hand have the same number" or "hands in which the five cards are arranged in a consecutive sequence," the probabilities of which can be easily calculated using combinatorics. The only macrostates (and their probabilities) that matter in poker are the following:
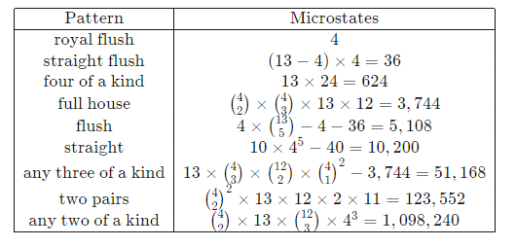
Managing nine possibilities vs 2.5 × 10⁶ (a ∼ 100,000 – fold reduction) frees up quite a bit of thinking for other tasks.
1.2.1 Ensembles
Because a system is defined by a large number of particles, "ensembles" can be defined as a group of macroscopically identical but essentially independent systems. Each of the systems that make up an ensemble must meet the same macroscopic conditions, such as volume, energy, pressure, temperature, and total number of particles. The term essentially independent here refers to a system (in the ensemble) that is mutually non-interacting with others, i.e., the systems differ in microscopic conditions such as parity, symmetry, quantum states, and so on.
Ensembles can be divided into three categories:
- Micro-canonical Ensemble
- Canonical Ensemble
- Grand Canonical Ensemble
1.2.2 Ensemble Average
Every statistic has an approximate value rather than an exact value. During motion, the ensemble average equals the average of a statistical quantity.
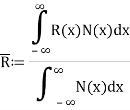
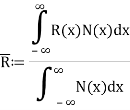
If R(x) is a statistical quantity along the x-axis and N(x) is the number of phase points in phase space, then R(x) is the ensemble average of R(x).
1.3.1 Micro-canonical Ensemble
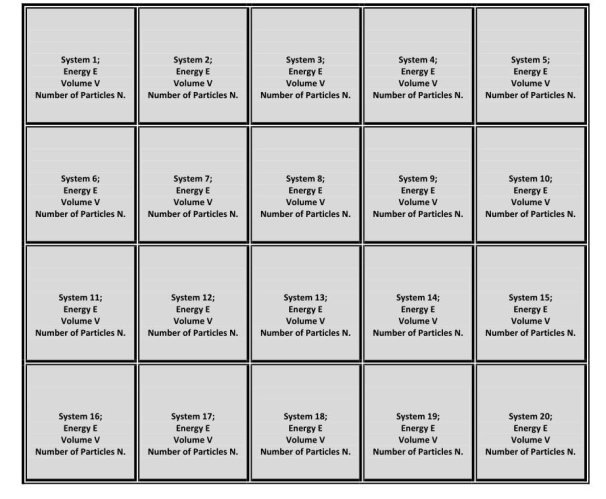
It is a collection of many essentially independent systems that have the same energy E, volume V, and total number of particles N.
The systems in a micro-canonical ensemble are separated by rigid impermeable and insulated walls, so the values of E, V, and N are unaffected by the mutual pressure of the other systems.
This ensemble is as shown in the figure below:
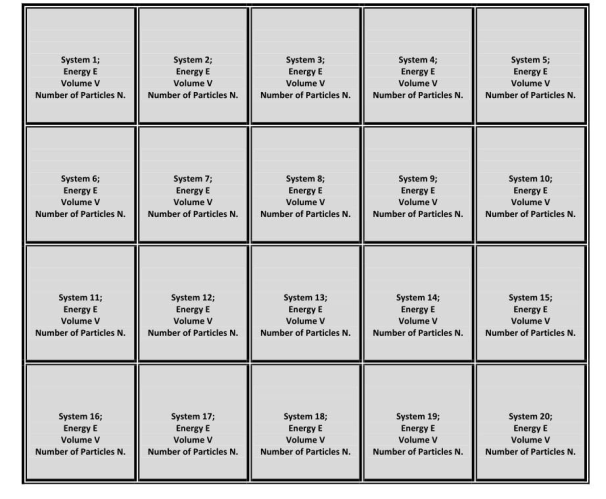
Here all the borders are impermeable and insulated.
1.4.1 Canonical Ensemble
It's a collection of many essentially independent systems with the same temperature T, volume V, and particle number N.
By bringing all of the systems into thermal contact, the temperature of all of them can be equalised. As a result, rigid impermeable but conducting walls separate the systems in this ensemble; however, the ensemble's outer walls are perfectly insulated and impermeable.
This ensemble is as shown in the figure:

The bold-colored borders are both insulating and impermeable, whereas the light-colored borders are both conducting and impermeable.
1.4.2 Grand Canonical Ensemble
It is the collection of a large number of essentially independent systems having the same temperature T, volume V & chemical potential μ.
The systems of a grand canonical ensemble are separated by rigid permeable and conducting walls. This ensemble is as shown in the figure:

Inner borders are rigid, permeable, and conducting, whereas outer borders are both impermeable and insulated. Because the inner separating walls are conducting and permeable, heat energy and particles are exchanged between the systems, bringing all of them to the same temperature T and chemical potential.
1.5.1 Phase Space: a Framework for Statistics
The state of a classical particle is completely specified by the measurement of its position and momentum, and statistics is concerned with counting states. If we have the six numbers, we can calculate the rest of the equation.
x,y,z,px,py,pz
In statistics, imagining a six-dimensional space made up of the six position and momentum coordinates is often helpful. The term "phase space" is commonly used. The counting tasks can then be visualised in a geometrical framework, with each point in phase space representing a specific position and momentum. In other words, each point in phase space corresponds to a distinct particle state. A given distribution of points in phase space represents the state of a system of particles.
The available volume in phase space is determined by counting the number of states available to a particle. Any finite volume in a continuous phase space could theoretically contain an infinite number of states. However, because we can't know both the position and the momentum at the same time, we can't really say that a particle is at a mathematical point in phase space. As a result, when we consider a "volume" element in phase space,
Du = dxdydzdpxdpydpz
Then the smallest "cell" in phase space which we can consider is constrained by the uncertainty principle to be
Duminimum = h3.
1.5.2 How phase spaces are used
The orbits of a single particle or a large number of particles can be described using phase space. It can even be used to describe a large number of N particle collections, where N is a big number. Finally, phase space can be used to model the probability distributions of how collections of N particles will behave if they are allowed to exchange particles and energy with the rest of the universe.
1.5.3 Single particle confined to one dimension creates a 2-dimensional phase space
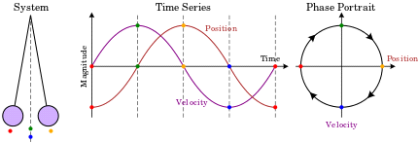
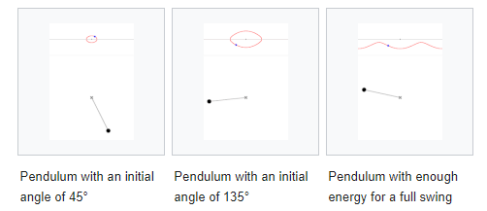
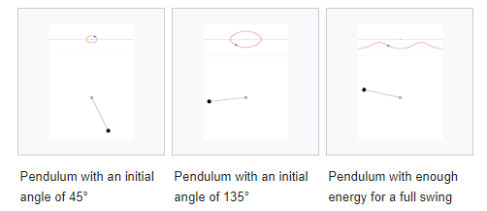
Fig. 1. A phase space of position and velocity for a simple pendulum.
A single particle is confined to one-dimensional motion under the influence of a conservative force field in the simplest phase space. Hamiltonian methods can be used to simulate such a system. Given a potential (x) (in this case, a uniform gravitational field), a suitable Hamiltonian is the total energy expressed as a function of position, x, and momentum, p:
H(p, x) = 
From w: Hamiltonian mechanics we have these equations of motion:

Newton's equations of motion follow immediately:  and
and  , and
, and  .
.
Figure 1b. Animations showing the motion in phase space for a pendulum.
1.5.4 Phase Space Probability Density
Consider a small volume of phase space with position ii between xi and xi+xi and momentum ii between pi and pi+pipi+pi. This is a 2N-dimensional phase space if the total number of positions and momenta is NN.
Assume that the system has a PP chance of being inside this volume. The probability density can then be defined as the probability-to-volume ratio:

The exact values of x and p, as we have seen, are largely irrelevant. Changing them simply scales the density of states by a constant factor that vanishes as soon as we use it in any calculations. As a result, we may as well set the limit to zero for both of them. The probability density then becomes a continuous function (x,p), in which I have combined all N positions into the vector x and all N momenta into the vector p.
I use the term "probabilities" here to refer to ensemble averages. Consider the task of preparing a large number of systems that are all macroscopically identical. A microstate's "probability" refers to the percentage of systems in that state. However, I'm not making any assumptions about the probability distribution. It doesn't have to be in balance. The probability density will change over time as all systems evolve according to the laws of classical mechanics.
As a simple example, consider a one-dimensional harmonic oscillator. As it moves back and forth, it traces out an ellipse in phase space as shown in Figure 8-1.
Its momentum is positive when it is in the top half of the figure, and thus its position is improving (moving to the right). Its momentum is negative when it is in the bottom half of the figure, so it moves to the left. Similarly, the force on the particle is negative in the right half of the figure, indicating that momentum is decreasing, while the force on the particle is positive in the left half, indicating that momentum is increasing. The system moves clockwise along the trajectory, forever tracing out the same ellipse.
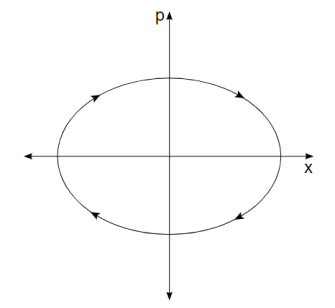
Figure 2. The trajectory in phase space of a harmonic oscillator.
An ellipse is formed by every point in phase space. Oscillators with larger amplitudes are represented by larger ellipses. Oscillators with the same amplitude but different phases are represented by two points on the same ellipse.
Consider a group of identical harmonic oscillators that move in different amplitudes and phases. They form a probability density in phase space when they are combined. As they move, they each trace an ellipse. Because a harmonic oscillator's frequency is independent of its amplitude, it takes exactly the same amount of time to complete one full rotation for all of them. Therefore the entire probability distribution simply rotates in phase space, returning to its starting point after one full period of oscillation.
Key takeaway
- A phase space is a space in dynamical system theory that represents all possible states of a system, with each possible state corresponding to a single unique point in the phase space. The phase space for mechanical systems usually contains all possible values of position and momentum variables.
- A quantum state's phase-space distribution f(x, p) is a quasi probability distribution. The phase-space distribution can be treated as the fundamental, primitive description of the quantum system in the phase-space formulation, without any reference to wave functions or density matrices.
1.6.1 Thermodynamic Probability W and Entropy
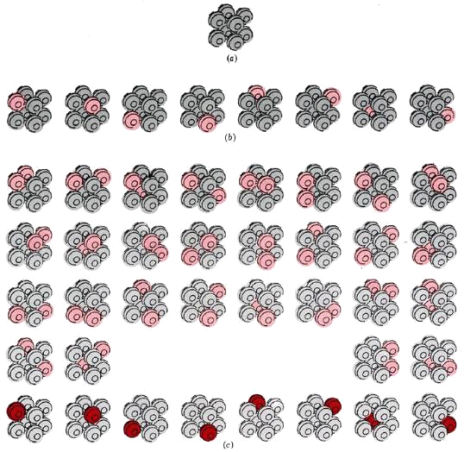
The section on atoms, molecules, and probability demonstrated that if we want to predict whether a chemical change is spontaneous or not, we must first determine whether the final state is more likely than the initial. The thermodynamic probability (W) is a number that can be used to do this. The number of different microscopic arrangements that correspond to the same macroscopic state is defined as W. The significance of this definition becomes more apparent once we have considered a few examples. At absolute zero, Figure a depicts a crystal made up of only eight atoms. Assume that the temperature is raised slightly by providing just enough energy to cause one of the crystal's atoms to vibrate. We could supply the energy to any of the eight atoms, so there are eight ways to do it. Figure 16.5.1 depicts all eight options.
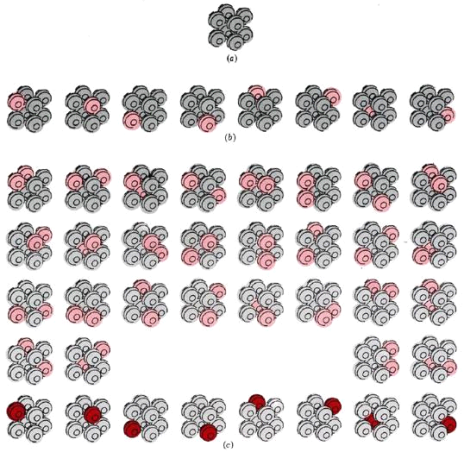
At three different temperatures, the thermodynamic probability W of an eight-atom crystal. (a) At 0 K, the crystal can only be arranged in one way, with W = 1. (b) If enough energy is applied to cause just one of the atoms to vibrate (colour), eight different equally likely arrangements are possible, and W = 8. (c) If the energy is doubled, two different atoms can vibrate at the same time (light colour), or a single atom can contain all of the energy (dark color). W = 36, which is a lot more than before.
We say W = 8 for the crystal at this temperature because all eight possibilities correspond to the crystal being at the same temperature. Also, keep in mind that none of these eight arrangements will keep the crystal in place indefinitely. All eight arrangements are equally likely because energy is constantly transferred from one atom to the next.
Let's now add a second amount of energy that is exactly the same as the first, just enough to get two molecules vibrating. There are 36 different ways to assign this energy to the eight atoms (Figure 16.5.1c). At this temperature, we say W = 36 for the crystal. Because energy is constantly transferred from one atom to the next, any of the 36 possible arrangements has an equal chance of yielding the crystal.
Our eight-atom crystal at absolute zero is a third example of W. Because there is no energy exchange between atoms, there is only one possible arrangement, and W = 1. This holds true not only for this hypothetical crystal, but also for a real crystal containing a large number of perfectly aligned atoms at absolute zero.
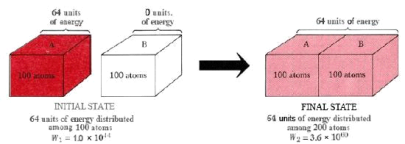
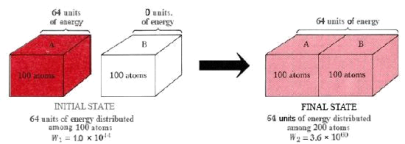
Thermodynamic probability and heat flow. When two crystals, one containing 64 units of vibrational energy and the other (at 0 K) containing none, come into contact, the 64 units of energy will distribute themselves among the two crystals because there are many more ways to distribute 64 units among 200 atoms than there are to distribute 64 units among only 100 atoms.
We can use the thermodynamic probability W to determine how likely certain events are compared to others. Figure 16.5.2 depicts the heat flow from crystal A to crystal B. Each crystal will have 100 atoms, we'll assume. Crystal B starts out at a temperature of 0 degrees Celsius. Crystal A is hotter and contains 64 units of energy, which is enough to vibrate 64 atoms. When the two crystals are combined, the molecules of A lose energy while the molecules of B gain energy until the 64 units of energy are evenly distributed between both crystals.
64 units of energy are distributed among 100 atoms in the initial state. According to calculations, there are 1.0 1044 different ways to create this distribution. As a result, W1 is the initial thermodynamic probability, which is 1.0 1044. The 100 crystal atoms A constantly exchange energy and rapidly switch from one of these 1.0 1044 arrangements to another. There's an equal chance of finding the crystal in any of the 1.0 1044 arrangements at any given time.
When the two crystals collide, the energy can be distributed over twice as many atoms. The number of possible configurations skyrockets, with W2, the thermodynamic probability of this new situation, at 3.6 1060. Each of these 3.6 1060 arrangements will occur with equal probability during the constant reshuffle of energy among the 200 atoms. Only 1.0 1044 of them, however, correspond to the total amount of energy in crystal A. Therefore, the probability of the heat flow reversing itself and all the energy returning to crystal A is

In other words, the ratio of W1 to W2 gives us the relative probability of finding the system in its initial rather than its final state.
This example demonstrates how W can be used as a general criterion for determining whether or not a reaction is spontaneous. Moving from a less likely to a more likely molecular situation corresponds to moving from a smaller to a larger W state. In other words, for a spontaneous change, W rises. The problem of predicting whether a reaction will be spontaneous or not is solved if we can calculate or measure the initial and final values of W. If W2 exceeds W1, the reaction will happen on its own. Although there is nothing wrong with this approach to spontaneous processes in principle, it is extremely inconvenient in practise. W values for real samples of matter (as opposed to 200 atoms in Figure 2) are on the order of 101024—so large that manipulating them is difficult. However, because log 10x = x, W's logarithm is only on the order of 1024. This is more manageable, and chemists and physicists use an entropy quantity proportional to the logarithm of W.
Ludwig Boltzmann, an Austrian physicist, proposed this method of dealing with the extremely large thermodynamic probabilities that occur in real systems in 1877.(1844 to 1906). The equation
S = k ln W (2)
Boltzmann's tomb bears this inscription. The Boltzmann constant denotes the proportionality constant k. It's equal to R divided by Avogadro's constant.NA:

And we can regard it as the gas constant per molecule rather than per mole. In SI units, the Boltzmann constant k has the value 1.3805 × 10⁻²³ J K–1. The symbol ln in Eq. 16.5.2 indicates a natural logarithm,i.e., a logarithm taken to the base e. Since base 10 logarithms and base e logarithms are related by the formula
Ln x = 2.303 log x (4)
It is easy to convert from one to the other. Equation 16.5.2, expressed in base 10 logarithms, thus becomes
S = 2.303k log W (5)
Example
The thermodynamic probability W for 1 mol propane gas at 500 K and 101.3 kPa has the value. Calculate the entropy of the gas under these conditions.
Solution Since
W = 
Log W = 1025
Thus S = 2.303k log W = 1.3805 × 10⁻²³ J K-1 × 2.303 × 1025 = 318 J K-1
Note: The quantity 318 J K–1 is obviously much easier to handle than 101025.
It's worth noting that entropy has two dimensions: energy and temperature.
One of the properties of logarithms is that as we increase a number, the value of its logarithm increases as well. As a result, as a system's thermodynamic probability W increases, so must its entropy S. Furthermore, since W always increases in a spontaneous change, S must also increase.
The second law of thermodynamics states that when there is a spontaneous change, entropy increases. (Energy conservation is the first law.) One of the most fundamental and widely applied scientific laws is known as the second law. We'll only be able to look at some of the chemical implications in this book, but it's important in physics, engineering, astronomy, and biology as well. The second law is implicated in nearly all environmental issues.
When pollution rises, for example, we can expect entropy to rise as well.
The second law is frequently expressed as an entropy difference S. If the entropy increases from S1 to S2 as a result of a spontaneous change, then
∆S = S2 – S1 (6)
Since S2 is larger than S1, we can write
∆S > 0 (7)
In any spontaneous process, S is greater than zero, according to Equation 16.5.7. Let's look at the case of 1 mol of gas expanding into a vacuum to see how this relationship works and how we can calculate an entropy change. We've already argued that the final state of this process is 101.813 × 10²³ times more probable than the initial state. This can only be because there are 101.813 × 10²³ There are many more ways to get to the final state than there are to get to the starting point. To put it another way, we've been logging.
Log  = 1.813 × 10²³ (8)
Thus
∆S = S2 – S1 = 2.303 × k × log W2 – 2.303 × k × log W1 (9)
= 2.303 × k × log  (10)
(10)
= 2.303 × 1.3805 × 10-23 J K-1 × 1.813 × 1023 (11)
S = 5.76 J K-1 (12)
As far as entropy changes go, this one is minor. Regardless, it represents a massive shift in probabilities.
1.7.1 Maxwell-Boltzmann distribution
The Maxwell-Boltzmann equation, which underpins the kinetic theory of gases, defines the speed distribution for a gas at a given temperature. The most likely speed, average speed, and root-mean-square speed can all be calculated using this distribution function.
1.7.2 Introduction
The kinetic molecular theory is used to predict the motion of an ideal gas molecule under specific conditions. When looking at a mole of ideal gas, however, measuring the velocity of each molecule at each instant of time is impossible. To calculate how many molecules are moving between velocities v and v + dv, the Maxwell-Boltzmann distribution is used. The Maxwell-Boltzmann distribution, for example, is given by assuming that the one-dimensional distributions are The x and y velocities are independent of one another, and the x velocity is unaffected by the y or z velocities.

Where
- DN/N is the fraction of molecules moving at velocity v to v + dv,
- m is the mass of the molecule,
- kb is the Boltzmann constant, and
- T is the absolute temperature.
In addition, instead of the vector quantity velocity, the function can be written in terms of the scalar quantity speed c. The distribution of gas molecules moving at various speeds is defined by this form of the function c1 and c2, thus

Finally, the Maxwell-Boltzmann distribution can be used to calculate the kinetic energy distribution of a group of molecules. For any gas at any temperature, the distribution of kinetic energy is the same as the distribution of speeds.
1.7.3 Plotting the Maxwell-Boltzmann Distribution Function
The Maxwell-Boltzmann distribution of speeds for a given gas at a given temperature, such as nitrogen at 298 K, is depicted in Figure 1. The most probable speed is the one at the top of the curve because it is shared by the most molecules.
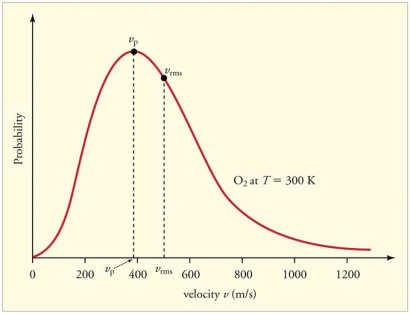
Figure 3: The Maxwell-Boltzmann distribution is shifted to higher speeds and is broadened at higher temperatures.
Figure 4 shows how temperature affects the Maxwell-Boltzmann distribution. Molecules have less energy at lower temperatures. As a result, the molecule speeds are slower, and the distribution has a narrower range. The distribution flattens as the temperature of the molecules rises. The molecules move faster at higher temperatures because they have more energy.
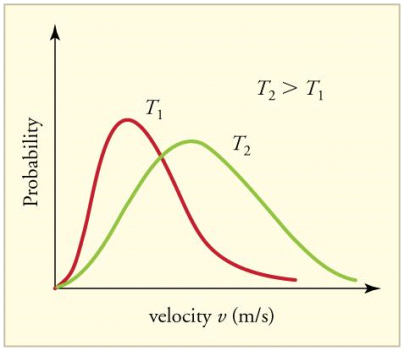
Figure 4: The Maxwell-Boltzmann distribution is shifted to higher speeds and is broadened at higher temperatures.
The Maxwell-Boltzmann distribution is shown to be dependent on molecule mass in Figure 3. Heavy molecules move at a slower rate than lighter molecules on average. As a result, the speed distribution of heavier molecules will be smaller, while the speed distribution of lighter molecules will be more spread out.
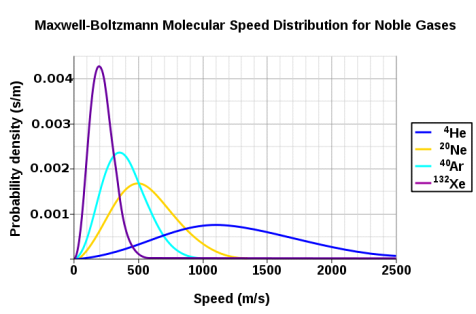
Figure 5: At a temperature of 298.15 K (25 °C), the probability density functions of the speeds of a few noble gases. Because the y-axis is in s/m, the area beneath any section of the curve (which represents the probability that the speed is in that range) is dimensionless. Wikipedia has granted permission for the use of this image.
1.7.4 Related Speed Expressions
The most probable speed, average speed, and root-mean-square speed are all speed expressions that can be derived from the Maxwell-Boltzmann distribution. The maximum value on the distribution plot represents the speed that is most likely. This is determined by determining the velocity at which the derivative after it is zero.

Which is
Cmp = 
The average speed is calculated by multiplying the total number of molecules by the sum of their speeds.
 (5)
(5)
The root-mean-square speed is square root of the average speed-squared.

Where
- R is the gas constant,
- T is the absolute temperature and
- M is the molar mass of the gas.
It always follows that for gases that follow the Maxwell-Boltzmann distribution (if thermallized)
Cmp < Cavg < Crms (7)
1.8.1 Partition Function P
P(n), sometimes also denoted p(n) (Abramowitz and Stegun 1972, p. 825; Comtet 1974, p. 94; Hardy and Wright 1979, p. 273; Conway and Guy 1996, p. 94; Andrews 1998, p. 1), gives the number of different ways to write the integer as a sum of positive integers, where the order of the addends is not important. Partitions are usually arranged in ascending order from largest to smallest by convention (Skiena 1990, p. 51). For instance, since 4 can be written in a variety of ways,
4 | = | 4 | (1) |
 | = | 3+1 | (2) |
 | = | 2+2 | (3) |
 | = | 2+1+1 | (4) |
 | = | 1+1+1+1, | (5) |
It follows that P(4)=5. P(n) is Partitions is the Wolfram Language implementation of the number of unrestricted partitions P[n].
The values of P(n) for n=1, 2, ..., are 1, 2, 3, 5, 7, 11, 15, 22, 30, 42, ... (OEIS A000041). The values of P(10n) for n=0, 1, ... Are given by 1, 42, 190569292, 24061467864032622473692149727991, ... (OEIS A070177).
The first few prime values of P(n) are 2, 3, 5, 7, 11, 101, 17977, 10619863, ... (OEIS A049575), corresponding to indices 2, 3, 4, 5, 6, 13, 36, 77, 132, ... (OEIS A046063). As of Feb. 3, 2017, the largest known n giving a probable prime is 1 000 007 396 with 35219 decimal digits (E. Weisstein, Feb. 12, 2017), while the largest known n giving a proven prime is 221 444 161 with 16 569 decimal digits
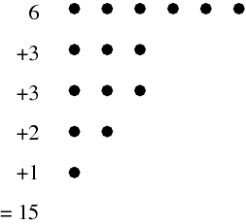
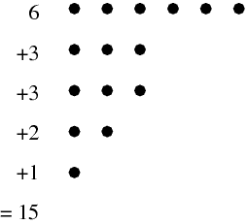
When explicitly listing a number's partitions, the simplest form is the so-called natural representation, which simply gives the representation's numerical sequence. (e.g., (2, 1, 1) for the number 4=2+1+1). Instead, the multiplicity representation shows how many times each number appears with another number (e.g., (2, 1), (1, 2) for 4=2.1+1.2). The Ferrers diagram is a diagram that depicts a partition. The Ferrers diagram of the partition, for example, is shown in the diagram above. 6+3+3+2+1=15.
Euler gave a generating function for P(n) using the q-series
(q)∞≡ (6)
(6)
 ≡
≡ (7)
(7)
 ≡1-q-q2+q5+q7-q12-q15+q22+q26+ ...(8)
Here, the exponents are generalized pentagonal numbers 0, 1, 2, 5, 7, 12, 15, 22, 26, 35, ... (OEIS A001318) and the sign of the  th term (counting 0 as the 0th term) is
  (with
(with  the floor function). Then the partition numbers P(n) are given by the generating function
1/(q)∞= (9)
(9)
 =1+q+2q2+3q3+5q4+ ...(10)
(Hirschhorn 1999).
The number of partitions into parts of a number is equal to the number of partitions into parts of which the largest is the largest. m, and the number of partitions into at most m parts is equal to the number of partitions into parts which do not exceed m. Both of these conclusions follow from the fact that a Ferrers diagram can be read either row-wise or column-wise (though row-wise is the default order).; Hardy 1999, p. 83).
For example, if an = 1 for all n, then the Euler transform bn is the number of partitions of n into integer parts.
Euler devised a generating function that produces a recurrence equation in mathematics.P(n),
P(n) =  (11)
(11)
(Skiena 1990, p. 57). Other recurrence equations include
P(2n+1) = P(n) +  (12)
(12)
And
P(n) =  (13)
(13)
Where σ1(n) is the divisor function (Skiena 1990, p. 77; Berndt 1994, p. 108), as well as the identity
 (14)
(14)
Where  is the floor function and
  is the ceiling function.
A recurrence relation involving the partition function Q is given by
P(n) =  (15)
(15)
Atkin and Swinnerton-Dyer (1954) obtained the unexpected identities
 ≡
≡  (16)
(16)
 ≡
≡  (17)
(17)
 ≡
≡  (18)
(18)
 ≡
≡  (19)
(19)
(Hirschhorn 1999).
MacMahon obtained the beautiful recurrence relation
P(n) – P(n-1)-P(n-2)+P(n-5)+P(n-7)-P(n-12) –P(n-15)+ ... = 0(20)
Where the sum is over generalized pentagonal numbers ≤n and the sign of the k th term is  , as above. Ramanujan stated without proof the remarkable identities
 (21)
(21)
(Darling 1921; Mordell 1922; Hardy 1999, pp. 89-90), and
 (22)
(22)
(Mordell 1922; Hardy 1999, pp. 89-90, typo corrected).
Hardy and Ramanujan (1918) used the circle method and modular functions to obtain the asymptotic solution
P(n)~ (23)
(23)
(Hardy 1999, p. 116), which was also independently discovered by Uspensky (1920). Rademacher (1937) subsequently obtained an exact convergent series solution which yields the Hardy-Ramanujan formula (23) as the first term:
P(n) =  (24)
(24)
Where
 (25)
(25)
δmn is the Kronecker delta, and  is the floor function (Hardy 1999, pp. 120-121). The remainder after
  terms is
R(N)<CN-1/2 + D  (26)
(26)
Where C and D are fixed constants (Apostol 1997, pp. 104-110; Hardy 1999, pp. 121 and 128). Rademacher's contour includes Farey sequences and Ford circles, which is rather remarkable (Apostol 1997, pp. 102-104; Hardy 1999, pp. 121-122). Erds demonstrated in 1942 that the Hardy and Ramanujan formula could be deduced using simple methods (Hoffman 1998, p. 91).
As a finite sum of algebraic numbers, Bruinier and Ono (2011) discovered the following algebraic formula for the partition function. Define the meromorphic modular form with weight two.
F(z) by
F(z) = ½  (27)
(27)
Were q = e2π/z, E2(q) is an Eisenstein series, and η(q) is a Dedekind eta function. Now define
R(z) = -  (28)
(28)
Where z=x+iy. Additionally let Qn be any set of representatives of the integral binary quadratic form's equivalence classes Q(x, y) = ax2+bxy+cy2 such that 6|a with a>0 and b ≡ 1(mod 12), and for each Q(x, y), let αQ be the so-called CM point in the upper half-plane, for which Q(αQ, 1) = 0. Then
P(n) =  (29)
(29)
Where the trace is defined as
Tr(n) =  (30)
(30)
Ramanujan found numerous partition function P congruences.
Let fo(x) be the number of partitions' generating function Po(x) of n containing odd numbers only and fD(x) be the generating function for the number of partitions PD(n) of n without duplication, then
Fo(x)=FD(x)(31)
 =
= (32)
(32)
 =
= (33)
(33)
 =
= (34)
(34)
 =½ (-q; x)∞(35)
 =1+x+x2+2x3+2x4+3x5+...(36)
Euler (Honsberger 1985; Andrews 1998, p. 5; Hardy 1999, p. 86) discovered the first few values of this function (Honsberger 1985; Andrews 1998, p. 5; Hardy 1999, p. 86), Po(n) =PD(n) for n=0, 1, ... As 1, 1, 1, 2, 2, 3, 4, 5, 6, 8, 10, ... (OEIS A000009). The identity
 (37)
(37)
Is known as the Euler identity (Hardy 1999, p. 84).
The difference between the number of partitions divided into an even number of unequal parts and the number of partitions divided into an odd number of unequal parts is given by the generating function
 =1-z-z2+z5+z7-z12-z15+ ...(38)
 =1+
=1+  (39)
(39)
Where
Ck =  (40)
(40)
Let PE(n) be the number of partitions of even numbers only, and let PEO(n)(PEO(n)) be the number of partitions with even (odd) and different parts. Then is given as the generating function of
FDO(x)= (41)
(41)
 =(-x; x2)∞(42)
(Hardy 1999, p. 86), and the first few values of are 1, 1, 0, 1, 1, 1, 1, 1, 2, 2, 2, 2, 3, 3, 3, 4, ... (OEIS A000700). Additional generating functions are given by Honsberger (1985, pp. 241-242).
Surprisingly, the number of partitions with no even part repeated is the same as the number of partitions with no part appearing more than three times and the number of partitions with no part divisible by four, all of which have the same generating functions.
P3(n)= (43)
(43)
 =
= (44)
(44)
 =
= (45)
(45)
 =
= (46)
(46)
The first few values of P*(n) are 1, 2, 3, 4, 6, 9, 12, 16, 22, 29, 38, ... (OEIS A001935; Honsberger 1985, pp. 241-242).
In general, the generating function for the number of partitions in which no part occurs more than  times is
Pd(n)= (47)
(47)
 =
= (48)
(48)
(Honsberger 1985, pp. 241-242). The generating function for the number of partitions in which every part occurs 2, 3, or 5 times is
P2,3,5(n)= (49)
(49)
 =
= (50)
(50)
 =
= (51)
(51)
 =
= (52)
(52)
The first few values are 0, 1, 1, 1, 1, 3, 1, 3, 4, 4, 4, 8, 5, 9, 11, 11, 12, 20, 15, 23, ... (OEIS A089958; Honsberger 1985, pp. 241-242).
The number of partitions in which no part occurs exactly once is
P1(n)= (53)
(53)
 =
= (54)
(54)
 =
= (55)
(55)
 =
= (56)
(56)
 =
= (57)
(57)
The first few values are, 1, 0, 1, 1, 2, 1, 4, 2, 6, 5, 9, 7, 16, 11, 22, 20, 33, 28, 51, 42, 71, ... (OEIS A007690; Honsberger 1985, p. 241, correcting the sign error in equation 57).
Some additional interesting theorems following from these (Honsberger 1985, pp. 64-68 and 143-146) are:
1. The number of partitions in which no even part is repeated is the same as the number of partitions in which no part occurs more than three times or is divisible by four.
2. The number of partitions in which no term is a multiple of is the same as the number of partitions in which no part occurs more frequently than times. d+1.
3. The number of partitions in which each part appears two, three, or five times is the same as the number of partitions in which each part is congruent mod 12 to two, three, six, nine, or ten times.
4. The number of partitions in which no part is congruent to 1 or 5 mod 6 is the same as the number of partitions in which no part appears exactly once..
5.The absolute difference between the number of partitions with odd and even parts equal the number of partitions in which the parts are all even and different.
P(n) satisfies the inequality
P(n)≤ ½ [P(n+1)+P(n-1)](58)
(Honsberger 1991).
P(n, k) denotes the number of ways of writing n as a sum of exactly k terms or, equivalently, the number of partitions into parts of which the largest is exactly k. (Note that if "exactly k" is changed to "k or fewer" and "largest is exactly k," is changed to "no element greater than k," then the partition function q is obtained.) For example (5,3)=2, since the partitions of 5 of length 3 are (3,1,1) and (2, 2,1), and the partitions of 5 with maximum element 3 are(3,2) and (3,1,1).
The P(n,k) such partitions can be enumerated in the Wolfram Language using Integer Partitions[n,  k
k ].
].
P(n,k) can be computed from the recurrence relation
P(n, k) = P(n-1, k-1)+P(n-k, k)(59)
(Skiena 1990, p. 58; Ruskey) with P(n, k)=0 for k>n, P(n,n)=1, and P(n, 0)=0. The triangle of P(k, n) is given by
1
1 1
1 1 1
1 2 1 1
1 2 2 1 1
1 3 3 2 1 1(60)
(OEIS A008284). The number of partitions of n with largest part k is the same as P(n, k).
The recurrence relation can be solved exactly to give
P(n, 1)=1(61)
P(n, 2)=¼ [2n – 1+ (-1)n](62)
P(n, 3)=1/72 [6n2 – 7 -9(-1)n + 16 cos (2/3 πn)](63)
P(n, 4)=1/864{3(n+1)[2n(n+2) – 13 + 9(-1)n] – 96
Cos(2nπ/3) + 108 (-1)n/2 mod(n+1, 2) + 32 √3 sin (2nπ/3)},(64)
Where P(n,k)=0 for n<k. The functions P(n, k) can also be given explicitly for the first few values of k in the simple forms
P(n, 2)=[1/2 n](65)
P(n, 3) [1/12 n2](66)
Where is the nearest integer function and is the floor function (Honsberger 1985, pp. 40-45). B. Schwennicke defines it in a similar way.
tk(n) = n+ ¼ k (k – 3)(67)
And then yields
P(n, 2)=[ ½ t2 (n)](68)
P(n, 3)=[1/12 t32 (n)](69)
P(n, 4)= (70)
(70)
Hardy and Ramanujan (1918) obtained the exact asymptotic formula
 (71)
(71)
Where  is a constant. However, the sum
 (72)
(72)
Diverges, as first shown by Lehmer (1937).
Key takeaway
- A partition function describes the statistical properties of a system in thermodynamic equilibrium. Partition functions are functions of the thermodynamic state variables, such as the temperature and volume.
- The partition function is dimensionless, it is a pure number.
- The partition function can be understood to provide a measure (a probability measure) on the probability space; formally, it is called the Gibbs measure.
References:
1. Statistical Mechanics, B.K.Agarwal and Melvin Eisner (New Age Inter-national)-2013
2. Thermodynamics, Kinetic Theory and Statistical Thermodynamics: Francis W.Sears and Gerhard L. Salinger (Narosa) 1998
3. Statistical Mechanics: R.K.Pathria and Paul D. Beale (Academic Press)- 2011
Unit - 1
Classical Statistics -1
A microstate is a specific configuration of a system's constituent parts that results in a macrostate that can be observed from the outside.
Consider a box with two particles and only one quantized unit of energy (meaning it can't be divided; it must go to one of the two particles entirely). Because assigning the unit of energy to particle A results in a different microstate than assigning the unit of energy to particle B, there are two microstates. The macrostate, in both cases, is the system's single unit of energy. The arrangement of the particles inside the box is irrelevant when discussing the macrostate, so there is only one.
When calculating entropy and internal energy, microstate considerations are extremely helpful. In fact, because entropy is defined in terms of a constant and the natural log of the number of microstates, the only input required to calculate it is the number of microstates.
S = kB ln Ω
Microstates
Combinatorics is typically required for problems involving the counting of microstates.
Example
Ten red or blue balls are contained in a box. How many different microstates are required to satisfy the macrostate of three red balls?
Solution: We have a ten-ball arrangement and need exactly three of them to be red, which can be done in ten different ways.
10C3 = 
Poker example
Consider the system of a poker hand drawn from a standard 52-card deck. The exact state of the system can be determined by answering the question, "What cards are in the hand?" There are 525 possible answers, including 5,K,J,2,3,4. Because it specifies the exact value of each card, this type of description is referred to as the system's microstate. Furthermore, because every hand has the same chance of coming out of the deck, every microstate is equiprobable, the probability of that exact hand being drawn is simply 1/ 525.
Fortunately, poker players are more interested in whether a hand is a "flush," "straight," or "four of a kind," rather than the exact microstate description. Because it captures the essential information (a pattern description) without specifying the details, this is referred to as the macrostate description of the system (the exact cards).
Consider using the microstate description to determine poker winners. The time-consuming solution for each set of hands entails consulting a 52 5 =2,598,960-entry lookup table, searching through the list for the exact match to each hand, and comparing their values.
Instead, concentrate on a much smaller set of possibilities in the macrostate description, such as "hands in which any four of the cards in the hand have the same number" or "hands in which the five cards are arranged in a consecutive sequence," the probabilities of which can be easily calculated using combinatorics. The only macrostates (and their probabilities) that matter in poker are the following:
Managing nine possibilities vs 2.5 × 10⁶ (a ∼ 100,000 – fold reduction) frees up quite a bit of thinking for other tasks.
1.2.1 Ensembles
Because a system is defined by a large number of particles, "ensembles" can be defined as a group of macroscopically identical but essentially independent systems. Each of the systems that make up an ensemble must meet the same macroscopic conditions, such as volume, energy, pressure, temperature, and total number of particles. The term essentially independent here refers to a system (in the ensemble) that is mutually non-interacting with others, i.e., the systems differ in microscopic conditions such as parity, symmetry, quantum states, and so on.
Ensembles can be divided into three categories:
- Micro-canonical Ensemble
- Canonical Ensemble
- Grand Canonical Ensemble
1.2.2 Ensemble Average
Every statistic has an approximate value rather than an exact value. During motion, the ensemble average equals the average of a statistical quantity.
If R(x) is a statistical quantity along the x-axis and N(x) is the number of phase points in phase space, then R(x) is the ensemble average of R(x).
1.3.1 Micro-canonical Ensemble
It is a collection of many essentially independent systems that have the same energy E, volume V, and total number of particles N.
The systems in a micro-canonical ensemble are separated by rigid impermeable and insulated walls, so the values of E, V, and N are unaffected by the mutual pressure of the other systems.
This ensemble is as shown in the figure below:
Here all the borders are impermeable and insulated.
1.4.1 Canonical Ensemble
It's a collection of many essentially independent systems with the same temperature T, volume V, and particle number N.
By bringing all of the systems into thermal contact, the temperature of all of them can be equalised. As a result, rigid impermeable but conducting walls separate the systems in this ensemble; however, the ensemble's outer walls are perfectly insulated and impermeable.
This ensemble is as shown in the figure:

The bold-colored borders are both insulating and impermeable, whereas the light-colored borders are both conducting and impermeable.
1.4.2 Grand Canonical Ensemble
It is the collection of a large number of essentially independent systems having the same temperature T, volume V & chemical potential μ.
The systems of a grand canonical ensemble are separated by rigid permeable and conducting walls. This ensemble is as shown in the figure:

Inner borders are rigid, permeable, and conducting, whereas outer borders are both impermeable and insulated. Because the inner separating walls are conducting and permeable, heat energy and particles are exchanged between the systems, bringing all of them to the same temperature T and chemical potential.
1.5.1 Phase Space: a Framework for Statistics
The state of a classical particle is completely specified by the measurement of its position and momentum, and statistics is concerned with counting states. If we have the six numbers, we can calculate the rest of the equation.
x,y,z,px,py,pz
In statistics, imagining a six-dimensional space made up of the six position and momentum coordinates is often helpful. The term "phase space" is commonly used. The counting tasks can then be visualised in a geometrical framework, with each point in phase space representing a specific position and momentum. In other words, each point in phase space corresponds to a distinct particle state. A given distribution of points in phase space represents the state of a system of particles.
The available volume in phase space is determined by counting the number of states available to a particle. Any finite volume in a continuous phase space could theoretically contain an infinite number of states. However, because we can't know both the position and the momentum at the same time, we can't really say that a particle is at a mathematical point in phase space. As a result, when we consider a "volume" element in phase space,
Du = dxdydzdpxdpydpz
Then the smallest "cell" in phase space which we can consider is constrained by the uncertainty principle to be
Duminimum = h3.
1.5.2 How phase spaces are used
The orbits of a single particle or a large number of particles can be described using phase space. It can even be used to describe a large number of N particle collections, where N is a big number. Finally, phase space can be used to model the probability distributions of how collections of N particles will behave if they are allowed to exchange particles and energy with the rest of the universe.
1.5.3 Single particle confined to one dimension creates a 2-dimensional phase space
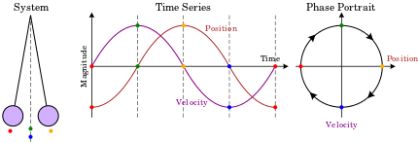
Fig. 1. A phase space of position and velocity for a simple pendulum.
A single particle is confined to one-dimensional motion under the influence of a conservative force field in the simplest phase space. Hamiltonian methods can be used to simulate such a system. Given a potential (x) (in this case, a uniform gravitational field), a suitable Hamiltonian is the total energy expressed as a function of position, x, and momentum, p:
H(p, x) = 
From w: Hamiltonian mechanics we have these equations of motion:

Newton's equations of motion follow immediately:  and
and  , and
, and  .
.
Figure 1b. Animations showing the motion in phase space for a pendulum.
1.5.4 Phase Space Probability Density
Consider a small volume of phase space with position ii between xi and xi+xi and momentum ii between pi and pi+pipi+pi. This is a 2N-dimensional phase space if the total number of positions and momenta is NN.
Assume that the system has a PP chance of being inside this volume. The probability density can then be defined as the probability-to-volume ratio:

The exact values of x and p, as we have seen, are largely irrelevant. Changing them simply scales the density of states by a constant factor that vanishes as soon as we use it in any calculations. As a result, we may as well set the limit to zero for both of them. The probability density then becomes a continuous function (x,p), in which I have combined all N positions into the vector x and all N momenta into the vector p.
I use the term "probabilities" here to refer to ensemble averages. Consider the task of preparing a large number of systems that are all macroscopically identical. A microstate's "probability" refers to the percentage of systems in that state. However, I'm not making any assumptions about the probability distribution. It doesn't have to be in balance. The probability density will change over time as all systems evolve according to the laws of classical mechanics.
As a simple example, consider a one-dimensional harmonic oscillator. As it moves back and forth, it traces out an ellipse in phase space as shown in Figure 8-1.
Its momentum is positive when it is in the top half of the figure, and thus its position is improving (moving to the right). Its momentum is negative when it is in the bottom half of the figure, so it moves to the left. Similarly, the force on the particle is negative in the right half of the figure, indicating that momentum is decreasing, while the force on the particle is positive in the left half, indicating that momentum is increasing. The system moves clockwise along the trajectory, forever tracing out the same ellipse.
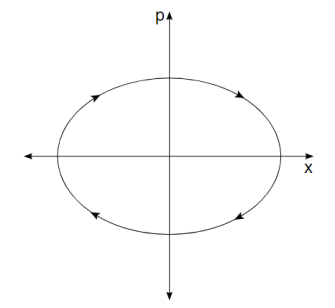
Figure 2. The trajectory in phase space of a harmonic oscillator.
An ellipse is formed by every point in phase space. Oscillators with larger amplitudes are represented by larger ellipses. Oscillators with the same amplitude but different phases are represented by two points on the same ellipse.
Consider a group of identical harmonic oscillators that move in different amplitudes and phases. They form a probability density in phase space when they are combined. As they move, they each trace an ellipse. Because a harmonic oscillator's frequency is independent of its amplitude, it takes exactly the same amount of time to complete one full rotation for all of them. Therefore the entire probability distribution simply rotates in phase space, returning to its starting point after one full period of oscillation.
Key takeaway
- A phase space is a space in dynamical system theory that represents all possible states of a system, with each possible state corresponding to a single unique point in the phase space. The phase space for mechanical systems usually contains all possible values of position and momentum variables.
- A quantum state's phase-space distribution f(x, p) is a quasi probability distribution. The phase-space distribution can be treated as the fundamental, primitive description of the quantum system in the phase-space formulation, without any reference to wave functions or density matrices.
1.6.1 Thermodynamic Probability W and Entropy
The section on atoms, molecules, and probability demonstrated that if we want to predict whether a chemical change is spontaneous or not, we must first determine whether the final state is more likely than the initial. The thermodynamic probability (W) is a number that can be used to do this. The number of different microscopic arrangements that correspond to the same macroscopic state is defined as W. The significance of this definition becomes more apparent once we have considered a few examples. At absolute zero, Figure a depicts a crystal made up of only eight atoms. Assume that the temperature is raised slightly by providing just enough energy to cause one of the crystal's atoms to vibrate. We could supply the energy to any of the eight atoms, so there are eight ways to do it. Figure 16.5.1 depicts all eight options.
At three different temperatures, the thermodynamic probability W of an eight-atom crystal. (a) At 0 K, the crystal can only be arranged in one way, with W = 1. (b) If enough energy is applied to cause just one of the atoms to vibrate (colour), eight different equally likely arrangements are possible, and W = 8. (c) If the energy is doubled, two different atoms can vibrate at the same time (light colour), or a single atom can contain all of the energy (dark color). W = 36, which is a lot more than before.
We say W = 8 for the crystal at this temperature because all eight possibilities correspond to the crystal being at the same temperature. Also, keep in mind that none of these eight arrangements will keep the crystal in place indefinitely. All eight arrangements are equally likely because energy is constantly transferred from one atom to the next.
Let's now add a second amount of energy that is exactly the same as the first, just enough to get two molecules vibrating. There are 36 different ways to assign this energy to the eight atoms (Figure 16.5.1c). At this temperature, we say W = 36 for the crystal. Because energy is constantly transferred from one atom to the next, any of the 36 possible arrangements has an equal chance of yielding the crystal.
Our eight-atom crystal at absolute zero is a third example of W. Because there is no energy exchange between atoms, there is only one possible arrangement, and W = 1. This holds true not only for this hypothetical crystal, but also for a real crystal containing a large number of perfectly aligned atoms at absolute zero.
Thermodynamic probability and heat flow. When two crystals, one containing 64 units of vibrational energy and the other (at 0 K) containing none, come into contact, the 64 units of energy will distribute themselves among the two crystals because there are many more ways to distribute 64 units among 200 atoms than there are to distribute 64 units among only 100 atoms.
We can use the thermodynamic probability W to determine how likely certain events are compared to others. Figure 16.5.2 depicts the heat flow from crystal A to crystal B. Each crystal will have 100 atoms, we'll assume. Crystal B starts out at a temperature of 0 degrees Celsius. Crystal A is hotter and contains 64 units of energy, which is enough to vibrate 64 atoms. When the two crystals are combined, the molecules of A lose energy while the molecules of B gain energy until the 64 units of energy are evenly distributed between both crystals.
64 units of energy are distributed among 100 atoms in the initial state. According to calculations, there are 1.0 1044 different ways to create this distribution. As a result, W1 is the initial thermodynamic probability, which is 1.0 1044. The 100 crystal atoms A constantly exchange energy and rapidly switch from one of these 1.0 1044 arrangements to another. There's an equal chance of finding the crystal in any of the 1.0 1044 arrangements at any given time.
When the two crystals collide, the energy can be distributed over twice as many atoms. The number of possible configurations skyrockets, with W2, the thermodynamic probability of this new situation, at 3.6 1060. Each of these 3.6 1060 arrangements will occur with equal probability during the constant reshuffle of energy among the 200 atoms. Only 1.0 1044 of them, however, correspond to the total amount of energy in crystal A. Therefore, the probability of the heat flow reversing itself and all the energy returning to crystal A is

In other words, the ratio of W1 to W2 gives us the relative probability of finding the system in its initial rather than its final state.
This example demonstrates how W can be used as a general criterion for determining whether or not a reaction is spontaneous. Moving from a less likely to a more likely molecular situation corresponds to moving from a smaller to a larger W state. In other words, for a spontaneous change, W rises. The problem of predicting whether a reaction will be spontaneous or not is solved if we can calculate or measure the initial and final values of W. If W2 exceeds W1, the reaction will happen on its own. Although there is nothing wrong with this approach to spontaneous processes in principle, it is extremely inconvenient in practise. W values for real samples of matter (as opposed to 200 atoms in Figure 2) are on the order of 101024—so large that manipulating them is difficult. However, because log 10x = x, W's logarithm is only on the order of 1024. This is more manageable, and chemists and physicists use an entropy quantity proportional to the logarithm of W.
Ludwig Boltzmann, an Austrian physicist, proposed this method of dealing with the extremely large thermodynamic probabilities that occur in real systems in 1877.(1844 to 1906). The equation
S = k ln W (2)
Boltzmann's tomb bears this inscription. The Boltzmann constant denotes the proportionality constant k. It's equal to R divided by Avogadro's constant.NA:

And we can regard it as the gas constant per molecule rather than per mole. In SI units, the Boltzmann constant k has the value 1.3805 × 10⁻²³ J K–1. The symbol ln in Eq. 16.5.2 indicates a natural logarithm,i.e., a logarithm taken to the base e. Since base 10 logarithms and base e logarithms are related by the formula
Ln x = 2.303 log x (4)
It is easy to convert from one to the other. Equation 16.5.2, expressed in base 10 logarithms, thus becomes
S = 2.303k log W (5)
Example
The thermodynamic probability W for 1 mol propane gas at 500 K and 101.3 kPa has the value. Calculate the entropy of the gas under these conditions.
Solution Since
W = 
Log W = 1025
Thus S = 2.303k log W = 1.3805 × 10⁻²³ J K-1 × 2.303 × 1025 = 318 J K-1
Note: The quantity 318 J K–1 is obviously much easier to handle than 101025.
It's worth noting that entropy has two dimensions: energy and temperature.
One of the properties of logarithms is that as we increase a number, the value of its logarithm increases as well. As a result, as a system's thermodynamic probability W increases, so must its entropy S. Furthermore, since W always increases in a spontaneous change, S must also increase.
The second law of thermodynamics states that when there is a spontaneous change, entropy increases. (Energy conservation is the first law.) One of the most fundamental and widely applied scientific laws is known as the second law. We'll only be able to look at some of the chemical implications in this book, but it's important in physics, engineering, astronomy, and biology as well. The second law is implicated in nearly all environmental issues.
When pollution rises, for example, we can expect entropy to rise as well.
The second law is frequently expressed as an entropy difference S. If the entropy increases from S1 to S2 as a result of a spontaneous change, then
∆S = S2 – S1 (6)
Since S2 is larger than S1, we can write
∆S > 0 (7)
In any spontaneous process, S is greater than zero, according to Equation 16.5.7. Let's look at the case of 1 mol of gas expanding into a vacuum to see how this relationship works and how we can calculate an entropy change. We've already argued that the final state of this process is 101.813 × 10²³ times more probable than the initial state. This can only be because there are 101.813 × 10²³ There are many more ways to get to the final state than there are to get to the starting point. To put it another way, we've been logging.
Log  = 1.813 × 10²³ (8)
Thus
∆S = S2 – S1 = 2.303 × k × log W2 – 2.303 × k × log W1 (9)
= 2.303 × k × log  (10)
(10)
= 2.303 × 1.3805 × 10-23 J K-1 × 1.813 × 1023 (11)
S = 5.76 J K-1 (12)
As far as entropy changes go, this one is minor. Regardless, it represents a massive shift in probabilities.
1.7.1 Maxwell-Boltzmann distribution
The Maxwell-Boltzmann equation, which underpins the kinetic theory of gases, defines the speed distribution for a gas at a given temperature. The most likely speed, average speed, and root-mean-square speed can all be calculated using this distribution function.
1.7.2 Introduction
The kinetic molecular theory is used to predict the motion of an ideal gas molecule under specific conditions. When looking at a mole of ideal gas, however, measuring the velocity of each molecule at each instant of time is impossible. To calculate how many molecules are moving between velocities v and v + dv, the Maxwell-Boltzmann distribution is used. The Maxwell-Boltzmann distribution, for example, is given by assuming that the one-dimensional distributions are The x and y velocities are independent of one another, and the x velocity is unaffected by the y or z velocities.

Where
- DN/N is the fraction of molecules moving at velocity v to v + dv,
- m is the mass of the molecule,
- kb is the Boltzmann constant, and
- T is the absolute temperature.
In addition, instead of the vector quantity velocity, the function can be written in terms of the scalar quantity speed c. The distribution of gas molecules moving at various speeds is defined by this form of the function c1 and c2, thus

Finally, the Maxwell-Boltzmann distribution can be used to calculate the kinetic energy distribution of a group of molecules. For any gas at any temperature, the distribution of kinetic energy is the same as the distribution of speeds.
1.7.3 Plotting the Maxwell-Boltzmann Distribution Function
The Maxwell-Boltzmann distribution of speeds for a given gas at a given temperature, such as nitrogen at 298 K, is depicted in Figure 1. The most probable speed is the one at the top of the curve because it is shared by the most molecules.
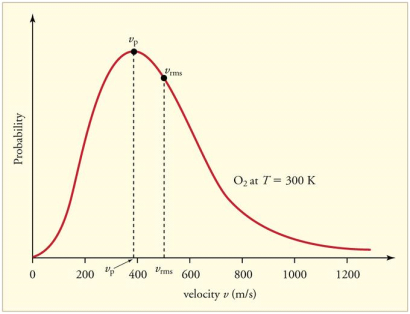
Figure 3: The Maxwell-Boltzmann distribution is shifted to higher speeds and is broadened at higher temperatures.
Figure 4 shows how temperature affects the Maxwell-Boltzmann distribution. Molecules have less energy at lower temperatures. As a result, the molecule speeds are slower, and the distribution has a narrower range. The distribution flattens as the temperature of the molecules rises. The molecules move faster at higher temperatures because they have more energy.
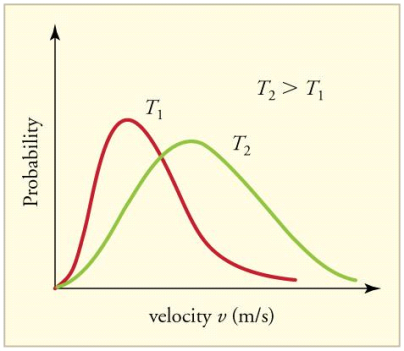
Figure 4: The Maxwell-Boltzmann distribution is shifted to higher speeds and is broadened at higher temperatures.
The Maxwell-Boltzmann distribution is shown to be dependent on molecule mass in Figure 3. Heavy molecules move at a slower rate than lighter molecules on average. As a result, the speed distribution of heavier molecules will be smaller, while the speed distribution of lighter molecules will be more spread out.
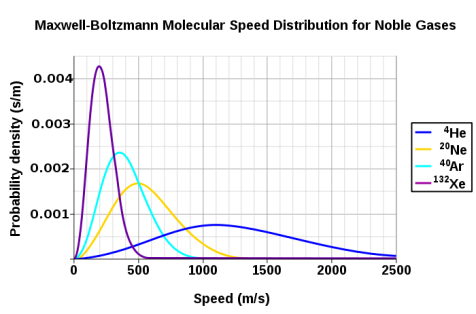
Figure 5: At a temperature of 298.15 K (25 °C), the probability density functions of the speeds of a few noble gases. Because the y-axis is in s/m, the area beneath any section of the curve (which represents the probability that the speed is in that range) is dimensionless. Wikipedia has granted permission for the use of this image.
1.7.4 Related Speed Expressions
The most probable speed, average speed, and root-mean-square speed are all speed expressions that can be derived from the Maxwell-Boltzmann distribution. The maximum value on the distribution plot represents the speed that is most likely. This is determined by determining the velocity at which the derivative after it is zero.

Which is
Cmp = 
The average speed is calculated by multiplying the total number of molecules by the sum of their speeds.
 (5)
(5)
The root-mean-square speed is square root of the average speed-squared.

Where
- R is the gas constant,
- T is the absolute temperature and
- M is the molar mass of the gas.
It always follows that for gases that follow the Maxwell-Boltzmann distribution (if thermallized)
Cmp < Cavg < Crms (7)
1.8.1 Partition Function P
P(n), sometimes also denoted p(n) (Abramowitz and Stegun 1972, p. 825; Comtet 1974, p. 94; Hardy and Wright 1979, p. 273; Conway and Guy 1996, p. 94; Andrews 1998, p. 1), gives the number of different ways to write the integer as a sum of positive integers, where the order of the addends is not important. Partitions are usually arranged in ascending order from largest to smallest by convention (Skiena 1990, p. 51). For instance, since 4 can be written in a variety of ways,
4 | = | 4 | (1) |
 | = | 3+1 | (2) |
 | = | 2+2 | (3) |
 | = | 2+1+1 | (4) |
 | = | 1+1+1+1, | (5) |
It follows that P(4)=5. P(n) is Partitions is the Wolfram Language implementation of the number of unrestricted partitions P[n].
The values of P(n) for n=1, 2, ..., are 1, 2, 3, 5, 7, 11, 15, 22, 30, 42, ... (OEIS A000041). The values of P(10n) for n=0, 1, ... Are given by 1, 42, 190569292, 24061467864032622473692149727991, ... (OEIS A070177).
The first few prime values of P(n) are 2, 3, 5, 7, 11, 101, 17977, 10619863, ... (OEIS A049575), corresponding to indices 2, 3, 4, 5, 6, 13, 36, 77, 132, ... (OEIS A046063). As of Feb. 3, 2017, the largest known n giving a probable prime is 1 000 007 396 with 35219 decimal digits (E. Weisstein, Feb. 12, 2017), while the largest known n giving a proven prime is 221 444 161 with 16 569 decimal digits
When explicitly listing a number's partitions, the simplest form is the so-called natural representation, which simply gives the representation's numerical sequence. (e.g., (2, 1, 1) for the number 4=2+1+1). Instead, the multiplicity representation shows how many times each number appears with another number (e.g., (2, 1), (1, 2) for 4=2.1+1.2). The Ferrers diagram is a diagram that depicts a partition. The Ferrers diagram of the partition, for example, is shown in the diagram above. 6+3+3+2+1=15.
Euler gave a generating function for P(n) using the q-series
(q)∞≡ (6)
(6)
 ≡
≡ (7)
(7)
 ≡1-q-q2+q5+q7-q12-q15+q22+q26+ ...(8)
Here, the exponents are generalized pentagonal numbers 0, 1, 2, 5, 7, 12, 15, 22, 26, 35, ... (OEIS A001318) and the sign of the  th term (counting 0 as the 0th term) is
  (with
(with  the floor function). Then the partition numbers P(n) are given by the generating function
1/(q)∞= (9)
(9)
 =1+q+2q2+3q3+5q4+ ...(10)
(Hirschhorn 1999).
The number of partitions into parts of a number is equal to the number of partitions into parts of which the largest is the largest. m, and the number of partitions into at most m parts is equal to the number of partitions into parts which do not exceed m. Both of these conclusions follow from the fact that a Ferrers diagram can be read either row-wise or column-wise (though row-wise is the default order).; Hardy 1999, p. 83).
For example, if an = 1 for all n, then the Euler transform bn is the number of partitions of n into integer parts.
Euler devised a generating function that produces a recurrence equation in mathematics.P(n),
P(n) =  (11)
(11)
(Skiena 1990, p. 57). Other recurrence equations include
P(2n+1) = P(n) +  (12)
(12)
And
P(n) =  (13)
(13)
Where σ1(n) is the divisor function (Skiena 1990, p. 77; Berndt 1994, p. 108), as well as the identity
 (14)
(14)
Where  is the floor function and
  is the ceiling function.
A recurrence relation involving the partition function Q is given by
P(n) =  (15)
(15)
Atkin and Swinnerton-Dyer (1954) obtained the unexpected identities
 ≡
≡  (16)
(16)
 ≡
≡  (17)
(17)
 ≡
≡  (18)
(18)
 ≡
≡  (19)
(19)
(Hirschhorn 1999).
MacMahon obtained the beautiful recurrence relation
P(n) – P(n-1)-P(n-2)+P(n-5)+P(n-7)-P(n-12) –P(n-15)+ ... = 0(20)
Where the sum is over generalized pentagonal numbers ≤n and the sign of the k th term is  , as above. Ramanujan stated without proof the remarkable identities
 (21)
(21)
(Darling 1921; Mordell 1922; Hardy 1999, pp. 89-90), and
 (22)
(22)
(Mordell 1922; Hardy 1999, pp. 89-90, typo corrected).
Hardy and Ramanujan (1918) used the circle method and modular functions to obtain the asymptotic solution
P(n)~ (23)
(23)
(Hardy 1999, p. 116), which was also independently discovered by Uspensky (1920). Rademacher (1937) subsequently obtained an exact convergent series solution which yields the Hardy-Ramanujan formula (23) as the first term:
P(n) =  (24)
(24)
Where
 (25)
(25)
δmn is the Kronecker delta, and  is the floor function (Hardy 1999, pp. 120-121). The remainder after
  terms is
R(N)<CN-1/2 + D  (26)
(26)
Where C and D are fixed constants (Apostol 1997, pp. 104-110; Hardy 1999, pp. 121 and 128). Rademacher's contour includes Farey sequences and Ford circles, which is rather remarkable (Apostol 1997, pp. 102-104; Hardy 1999, pp. 121-122). Erds demonstrated in 1942 that the Hardy and Ramanujan formula could be deduced using simple methods (Hoffman 1998, p. 91).
As a finite sum of algebraic numbers, Bruinier and Ono (2011) discovered the following algebraic formula for the partition function. Define the meromorphic modular form with weight two.
F(z) by
F(z) = ½  (27)
(27)
Were q = e2π/z, E2(q) is an Eisenstein series, and η(q) is a Dedekind eta function. Now define
R(z) = -  (28)
(28)
Where z=x+iy. Additionally let Qn be any set of representatives of the integral binary quadratic form's equivalence classes Q(x, y) = ax2+bxy+cy2 such that 6|a with a>0 and b ≡ 1(mod 12), and for each Q(x, y), let αQ be the so-called CM point in the upper half-plane, for which Q(αQ, 1) = 0. Then
P(n) =  (29)
(29)
Where the trace is defined as
Tr(n) =  (30)
(30)
Ramanujan found numerous partition function P congruences.
Let fo(x) be the number of partitions' generating function Po(x) of n containing odd numbers only and fD(x) be the generating function for the number of partitions PD(n) of n without duplication, then
Fo(x)=FD(x)(31)
 =
= (32)
(32)
 =
= (33)
(33)
 =
= (34)
(34)
 =½ (-q; x)∞(35)
 =1+x+x2+2x3+2x4+3x5+...(36)
Euler (Honsberger 1985; Andrews 1998, p. 5; Hardy 1999, p. 86) discovered the first few values of this function (Honsberger 1985; Andrews 1998, p. 5; Hardy 1999, p. 86), Po(n) =PD(n) for n=0, 1, ... As 1, 1, 1, 2, 2, 3, 4, 5, 6, 8, 10, ... (OEIS A000009). The identity
 (37)
(37)
Is known as the Euler identity (Hardy 1999, p. 84).
The difference between the number of partitions divided into an even number of unequal parts and the number of partitions divided into an odd number of unequal parts is given by the generating function
 =1-z-z2+z5+z7-z12-z15+ ...(38)
 =1+
=1+  (39)
(39)
Where
Ck =  (40)
(40)
Let PE(n) be the number of partitions of even numbers only, and let PEO(n)(PEO(n)) be the number of partitions with even (odd) and different parts. Then is given as the generating function of
FDO(x)= (41)
(41)
 =(-x; x2)∞(42)
(Hardy 1999, p. 86), and the first few values of are 1, 1, 0, 1, 1, 1, 1, 1, 2, 2, 2, 2, 3, 3, 3, 4, ... (OEIS A000700). Additional generating functions are given by Honsberger (1985, pp. 241-242).
Surprisingly, the number of partitions with no even part repeated is the same as the number of partitions with no part appearing more than three times and the number of partitions with no part divisible by four, all of which have the same generating functions.
P3(n)= (43)
(43)
 =
= (44)
(44)
 =
= (45)
(45)
 =
= (46)
(46)
The first few values of P*(n) are 1, 2, 3, 4, 6, 9, 12, 16, 22, 29, 38, ... (OEIS A001935; Honsberger 1985, pp. 241-242).
In general, the generating function for the number of partitions in which no part occurs more than  times is
Pd(n)= (47)
(47)
 =
= (48)
(48)
(Honsberger 1985, pp. 241-242). The generating function for the number of partitions in which every part occurs 2, 3, or 5 times is
P2,3,5(n)= (49)
(49)
 =
= (50)
(50)
 =
= (51)
(51)
 =
= (52)
(52)
The first few values are 0, 1, 1, 1, 1, 3, 1, 3, 4, 4, 4, 8, 5, 9, 11, 11, 12, 20, 15, 23, ... (OEIS A089958; Honsberger 1985, pp. 241-242).
The number of partitions in which no part occurs exactly once is
P1(n)= (53)
(53)
 =
= (54)
(54)
 =
= (55)
(55)
 =
= (56)
(56)
 =
= (57)
(57)
The first few values are, 1, 0, 1, 1, 2, 1, 4, 2, 6, 5, 9, 7, 16, 11, 22, 20, 33, 28, 51, 42, 71, ... (OEIS A007690; Honsberger 1985, p. 241, correcting the sign error in equation 57).
Some additional interesting theorems following from these (Honsberger 1985, pp. 64-68 and 143-146) are:
1. The number of partitions in which no even part is repeated is the same as the number of partitions in which no part occurs more than three times or is divisible by four.
2. The number of partitions in which no term is a multiple of is the same as the number of partitions in which no part occurs more frequently than times. d+1.
3. The number of partitions in which each part appears two, three, or five times is the same as the number of partitions in which each part is congruent mod 12 to two, three, six, nine, or ten times.
4. The number of partitions in which no part is congruent to 1 or 5 mod 6 is the same as the number of partitions in which no part appears exactly once..
5.The absolute difference between the number of partitions with odd and even parts equal the number of partitions in which the parts are all even and different.
P(n) satisfies the inequality
P(n)≤ ½ [P(n+1)+P(n-1)](58)
(Honsberger 1991).
P(n, k) denotes the number of ways of writing n as a sum of exactly k terms or, equivalently, the number of partitions into parts of which the largest is exactly k. (Note that if "exactly k" is changed to "k or fewer" and "largest is exactly k," is changed to "no element greater than k," then the partition function q is obtained.) For example (5,3)=2, since the partitions of 5 of length 3 are (3,1,1) and (2, 2,1), and the partitions of 5 with maximum element 3 are(3,2) and (3,1,1).
The P(n,k) such partitions can be enumerated in the Wolfram Language using Integer Partitions[n,  k
k ].
].
P(n,k) can be computed from the recurrence relation
P(n, k) = P(n-1, k-1)+P(n-k, k)(59)
(Skiena 1990, p. 58; Ruskey) with P(n, k)=0 for k>n, P(n,n)=1, and P(n, 0)=0. The triangle of P(k, n) is given by
1
1 1
1 1 1
1 2 1 1
1 2 2 1 1
1 3 3 2 1 1(60)
(OEIS A008284). The number of partitions of n with largest part k is the same as P(n, k).
The recurrence relation can be solved exactly to give
P(n, 1)=1(61)
P(n, 2)=¼ [2n – 1+ (-1)n](62)
P(n, 3)=1/72 [6n2 – 7 -9(-1)n + 16 cos (2/3 πn)](63)
P(n, 4)=1/864{3(n+1)[2n(n+2) – 13 + 9(-1)n] – 96
Cos(2nπ/3) + 108 (-1)n/2 mod(n+1, 2) + 32 √3 sin (2nπ/3)},(64)
Where P(n,k)=0 for n<k. The functions P(n, k) can also be given explicitly for the first few values of k in the simple forms
P(n, 2)=[1/2 n](65)
P(n, 3) [1/12 n2](66)
Where is the nearest integer function and is the floor function (Honsberger 1985, pp. 40-45). B. Schwennicke defines it in a similar way.
tk(n) = n+ ¼ k (k – 3)(67)
And then yields
P(n, 2)=[ ½ t2 (n)](68)
P(n, 3)=[1/12 t32 (n)](69)
P(n, 4)= (70)
(70)
Hardy and Ramanujan (1918) obtained the exact asymptotic formula
 (71)
(71)
Where  is a constant. However, the sum
 (72)
(72)
Diverges, as first shown by Lehmer (1937).
Key takeaway
- A partition function describes the statistical properties of a system in thermodynamic equilibrium. Partition functions are functions of the thermodynamic state variables, such as the temperature and volume.
- The partition function is dimensionless, it is a pure number.
- The partition function can be understood to provide a measure (a probability measure) on the probability space; formally, it is called the Gibbs measure.
References:
1. Statistical Mechanics, B.K.Agarwal and Melvin Eisner (New Age Inter-national)-2013
2. Thermodynamics, Kinetic Theory and Statistical Thermodynamics: Francis W.Sears and Gerhard L. Salinger (Narosa) 1998
3. Statistical Mechanics: R.K.Pathria and Paul D. Beale (Academic Press)- 2011