UNIT-6
Triangulation Survey
Figures and system
Triangulation is a surveying method that measures angles in a triangle formed by three survey control points. Using trigonometry and measured length of just one side, the other distances in the triangle are calculated.
Key takeaway
A triangulation figure or triangulation system is a group of triangles, with a single and common side to preceding and following figures.
The common figures or system used in the triangulation system are:
- Single Chain of Triangles
- Double Chain of Triangles
- Central Point Figures
- Quadrilaterals
1. Single Chain of Triangles in Triangulation
A single chain of triangles is used to survey narrow strip of terrain. This figure or system is rapid and economical. The figures made in this method is not so accurate and is not used for primary works. The number of conditions that are used to fulfil figure conditions is relatively small.
In this method, two independent routes cannot be used to determine the solution of the triangles. Hence, to reduce the accumulation of errors, it is recommended to introduce baseline frequently.
2. Double Chain of Triangles
Double chain figures are used for covering a larger area.
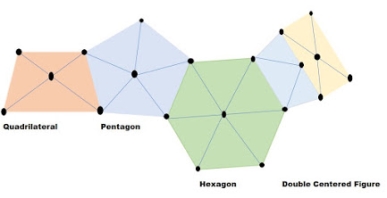
3. Centered Figures
It is used to cover the area in a flat country. It provides satisfactory results. The centred figures can be quadrilaterals, hexagons, or pentagons with central stations. The figure provides desired checks during computations. The progress of centred figures work is slow as they require more instrument setting.
4. Quadrilaterals
The quadrilateral with four corner stations and observed diagonal forms the best figures. It is best suited for hilly country. Since the computed length of the sides can be carried through the system by different combinations of sides and angles, the system is most accurate.
Key takeaway
The framework of the survey means the establishment of control points and subsidiary points. The control points should be established with higher accuracy than subsidiary points
It is the alignment as it forms the basis for the computations of the triangulation system the length of the baseline depends upon the grades of the triangulation.
Equipment for Baseline Measurements
- Tape
- Straining Device
- Spring balance or weight and pulley
- Thermometers and a finely divided scale
- Marking tripod or station rakes
- Supporting tripods or stakes
Key takeaway
The baseline is laid down with great accuracy of measurement
Methods used to measure Baseline
- Rigid bar method
- Wheeler’s method
- Jaderin’s method
- Hunter’s short base method
- Tacheometric method
Key takeaway
In triangulation, the baseline is of prime importance because it is the only horizontal distance to be measured. It should be measured very accurately since the accuracy of the computed sides of triangulation system depends on it. Length of the baseline varies from a fraction of (0.5-10) km and a fraction of a mile to 10 miles.
Extension of baseline correction
Chain / Tape corrections
1)Correction due to standardization
Correction per chain length


Total correction

True length of line
Alternate solution of Q →(1)
Core (1) L = 30m andL' = 30.40 m
1) C' = L'-L = 30.40-30 = (+) 0.40m
2) Number of chains = n = 
3) Total correction
 = 42.3×0.40=(+)169.20
4) Total length
l = 12690+169.20 = 16459.2 m
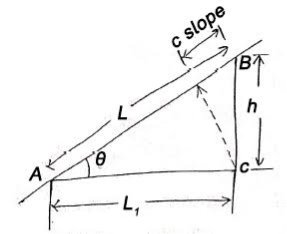
1) Correction due to slope
|
Fig-2 Correction due to slope
This correction is always a negative correction.
- Correct distance between any two points on ground is horizontal distance.
Correction required = L – 

 approximate formula
If  angle is given


2) Correction due to wrong alignment
|
Fig-2 Correction due to wrong alignment
Same as slope correction
If endpoint of chain is not put on the straight line between points to be measured


Correction is always negative.
3) Temperature correction
If  is the temperature at the time of standardization.
 is the temperature at the time of measurement
L = length of chain / tape
 = Coefficient of thermal expansion

| Length of chain | Noted down value | Error | Correct |
| Increase | Less | Negative | Positive |
| Decrease | More | Positive | Negative |
Table 1 Temperature correction
4) Pull correction
 = value of pull applied at the time of standardization
 value of pull applied at measurement
L = length of chain / tape
 Cross sectionarea of tape
E = Young's modulus
Pull correction = 
| Error | Correction |
| Negative | Positive |
| Positive | Negative |
Table 2 pull correction
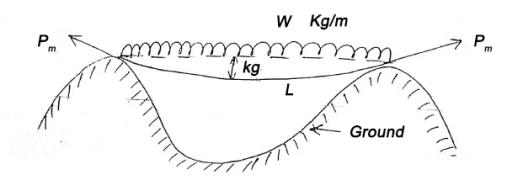
5) Sag correction
|
Fig-3 Sag correction

This collection is always negative.
Formal tension
The value of pull 
For which positive pull correction is exactly equal to negative sag correction is called normal tension.

Key takeaway
tape correction refers to correcting measurements for the effect of slope angle, expansion or contraction due to temperature, and the tape's sag, which varies with the applied tension
Measurement of horizontal and vertical angle
a) Horizontal angle:-
- Horizontal angle is used to find bearing and direction in control survey.
- It is also used for locating detail when mapping.
b) Vertical angle:-
-It is used to find out the height of points and to calculate slope connections.
Measurement of horizontal angle
1) To measure the angle of ABC, the instrument is set to B.
2) Upper clamp is loosened and the lower clamp is fixed.
3) Telescope is turned and vernier A is a set O and Vernier B to 180°.
4) Now lower clamp is loosened and tightened scope is pointed to A and bisect ranging rod at A.
5) Now lower clamp is tightened and lower tangent screw is turned to perfectly bisecting ranging rod at A.
6) Now upper clamp is loosened and the telescope is turned clockwise to bisect the C which is tightened at the upper clamp.
7) Now, vernier reading A and B is noted.
8) Vernier A result in angle directly and vernier B result reading by subtracting initial reading from final reading.
Measurement of vertical angle
- The zeros of Vernier are set to 0 degrees to vertical circle.
- The telescope is den clamped.
- Plate bubble is brought to centre with foot screw and altitude bubble is brought to the centre by clip screw.
- Telescope in bisect to point A and measure the angle of elevation.
- Finally reading of vernier is noted and the elevation angle is also noted.
- Now, the face of the instrument is changed and point A is bisected again and reading are noted.
- The telescope is lowered slowly and B is bisected to measure the angle of depression.
Horizontal and vertical control
Horizontal and vertical control is formed to create the framework around other surveys can be adjusted.
Horizontal and vertical control surveys are used inaccurate mapping projects in the construction of underground utility systems, and in roadways, power lines, tunnels.
Methods horizontal and vertical control
Horizontal positioning | Vertical positioning |
a) Triangulation | a) Geodetic levelling |
b) Trilateration | b) Trigonometric heighting |
c) Traversing | c)Basometric levelling |
d) Astronomical positioning |
|
e) GPS |
|
Table 3 Methods horizontal and vertical control
Key takeaway
vertical angle is an angle made by two connected lines in the vertical plane, which is, between a low point and two higher points. Since these angles are in the vertical plane, the lines that form them will usually be lines of sight
Theodolite must be centred on the point using plum bob. Centring and levelling the instrument was to ensure the horizontal angle that was measured
Satellite station
- It is also known as an eccentric station.
- Satellite station is a false station because it is not possible to set the instrument over the structure false station point is assumed.
- It is also a place where the movement of the satellite is followed and receive information from them.
Reduction to centre
It is defined as the process of computing the correct angle from an observed angle is called reduction to the centre.
This method is often applied in triangulation when it is not possible to occupy a triangulation station.
Signals:-
- It is a small device which is used to define the location of triangulation station such that it is easily observed from other stations.
- The signal must be vertical over the station.
- It is placed centrally over station mark.
- It is important to place over the station mark because the accuracy of the triangulation system depends on the signal that is entering the signal.
Signal:-
Opaque signal
Luminous signal
Opaque signal:-
Is a type of signal used where less accuracy and for short sight distance ( i.e. not more than 30 kilometres)
It must be used in day time only.
Cheaper than the luminous signal.
Example of opaque signal
(i)Target signal – suitable for distance up to 30 km
(ii) Pole signal- distance up to 6 km
(iii) Elevated signal – elevated tower is used as a signal and suitable for distance up to 30 to 40 km.
(iv)Stone signpost
(v)Pole and brush signal
b)Luminous signal:-
This type of signal used for geodetic survey because of quite distinct and have clear visibility even for long-distance (more than 30 km).
It is used for the day as well as night also.
Luminous signal
-Sun signal
-Light signal
(i) Sun signal - also known as heliotrope. Heliotrope reflects sunrays towards the station.
(ii) Night signals - observation is at night. Eg. Drummond's light and magnesium lamp with a parabolic reflector.
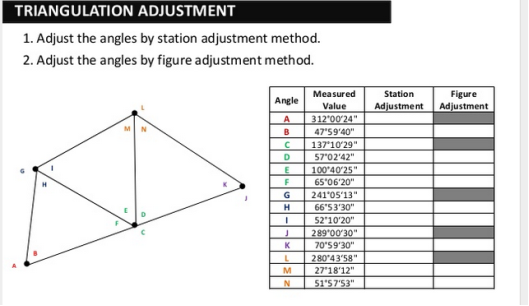
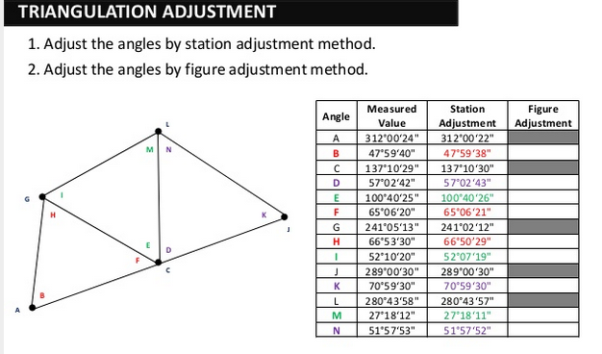
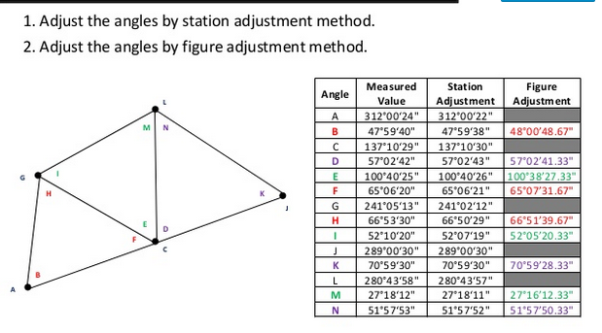
Principle of least squares-
Least squares’ is a powerful statistical technique that may be used for ‘adjusting’ or estimating coordinates in survey control networks. The term adjustment is one in popular usage but it does not have any proper statistical meaning. A better term is ‘least squares estimation’ since nothing, especially observations, are adjusted. Rather, coordinates are estimated from the evidence provided by observations.
The great advantage of least squares overall methods of estimation, such as traverse adjustments, is that least-squares are mathematically and statistically justifiable and, as such, is a fully rigorous method.
It can be applied to any over the determined network but has the further advantage that it can be used on one-, two- and three-dimensional networks. A by-product of least squares solution is a set of statistical statements about the quality of the solution. These statistical statements may take the form of standard errors of the computed coordinates, error ellipses or ellipsoids describing the uncertainty of a position in two or three dimensions, standard errors of observations derived from computed coordinates and other meaningful statistics described later.
The major practical drawback with least squares is that unless the network has only a small number of unknown points, or has very few redundant observations, amount of arithmetic manipulation makes method impractical without the aid of a computer and appropriate software.
The examples and exercises in this material use very small networks to minimize computational effort for the reader, while demonstrating the principles. Real survey networks are usually very much larger
Key takeaway
It involves the following process when a structure is taken as an instrument station, it is not possible to set the instrument over that structure and a false station point is assumed that can be referred as a satellite station.
Reference 1
|
|
Reference 2
Reference 3
|
Reference 4
|
Key takeaway
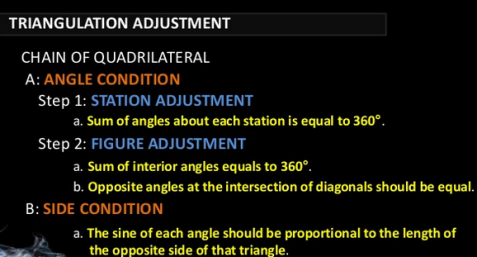
The positions of widely spaced stations were computed from observed angles and a minimal number of observed distances called baselines. The least-squares triangulation adjustment can use condition equations or observation equations written either in terms of azimuths or angles.
Reference:
1 Madhu, N, Sathikumar, R and Satheesh Gobi, Advanced Surveying: Total Station, GIS and Remote Sensing, Pearson India, 2006.
2 Manoj, K. Arora and Badjatia, Geomatics Engineering, Nem Chand & Bros, 2011
3 Bhavikatti, S.S., Surveying and Levelling, Vol. I and II, I.K. International, 2010
4 Chandra, A.M., Higher Surveying, Third Edition, New Age International (P) Limited, 2002.
5 Anji Reddy, M., Remote sensing and Geographical information system, B.S.
