UNIT-8
AREAS AND VOLUMES
How to Determine the Area of Field using Cross Staff Survey?
Equipment: –
1. Ranging rod – 7 Nos.
2. 30 m Chain – 1 Nos.
3. Arrow – 5 Nos.
4. Metallic tape (30m) – 1 Nos.
5. Cross staff withstand – 1 Nos.
Procedure: –
1. Fieldwork
2. Classroom work
(1.) Fieldwork
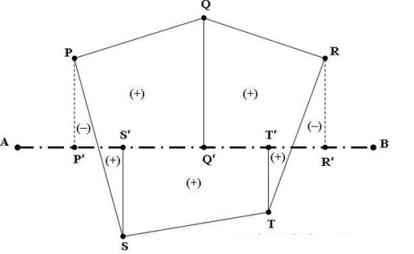
1. First of all first ranging rod is established at point A and makes fixed station taking measurement revising point A to two permanent structures.
2. Second ranging rod is established at point B and for makes fixed station taking measurement revising point B to two permanent structures.
3. Established grid line A to B using the ranging procedure by the judgment of eye and laying chain on it.
4. Remaining ranging rod established at point P, Q, R, and S, T on right and left side of grid line and it's maybe point of a permanent structure at a different location.
5. Sight point P perpendicular to the gridline using cross-staff, let’s meeting point is P’ on a grid line.
6. Measure the distance of AP’ and PP’ by chain (on-grid line) and metallic tape (between P to P’).
7. Write all observation in a field book or level book immediately.
8. Repeat Sighting procedure using cross-staff, let’s meeting point is Q’, R’, S’, and T’ on the grid line.
9. Measure a distance of AQ’, AR’, AS’ and AT’ by chain (on-grid line) and QQ’, RR’, SS’, TT’ using Metallic tape respectively.
10. Write all observation in a field book or level book respectively.
11. When complete all observation removes all ranging rods and packed in its cover.
2) Classroom work: –
1. Draw a complete figure in field book using field observation.
2. Draw a line meeting point P to S and R to T on field book or level book.
3. Calculate the area of the field by subtracting the outside (remaining) area of meeting line in total area in the field book
|
Fig-1 Classroom work
Once plotting and final plan of a geographical area has arrived at the surveyor is required to find its area. The plotted are need not be a regular figure like rectangular trapezium etc but invariably it will be an irregular figure
a. Concept
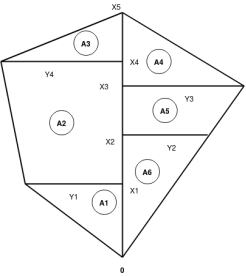
The area of a closed non-crossing plane polygon can be computed from the coordinates of the polygon's vertices. The area equations, depending on the coordinate format used, are shown here as Equations G-1 and G-2
In terms of X and Y coordinates
In terms of X and Y coordinates |
| ||
| Equation G-1 | ||
In terms of N and E coordinates |
| ||
| Equation G-2 | ||
These equations look complex, more so if you expand all the terms. Rather than memorize each equation, it's easier to remember their pattern and determine the area in tabular fashion.
To accurately compute the traverse area:
(1) Select a start point (it doesn't matter where you start)
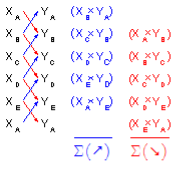
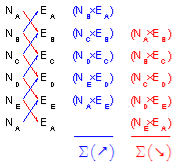
(2) Going in sequence around the exterior list each coordinate pair vertically, Figure G-5. The direction of travel around the traverse: clockwise or counter-clockwise doesn't matter, nor does coordinate precedence, eg, (X, Y) or (Y, X).
Using X,Y coords | Using N,E coords |
|
|
Figure G-5 | |
(3) The first coordinate pair must be repeated at the bottom of the list. In Figure G-5, the surveyor started at point A and then ended on point A.
(4) Cross multiply the coordinates and sum the products, Figure G-6. Arrows indicate "direction" of multiplication.
Using X,Y coords | Using N,E coords |
|
|
Figure G-6 | |
The units of the cross products are square linear units - if coordinates are in feet, cross products are sq ft.
(5) Using Equation G-3, compute the traverse area.
Sum each column () and ()
Sum each column ( ) and (
 )
)
| Equation G-3 |
The absolute value is used since area could be negative depending on the combination of direction around traverse, coordinate precedence (e.g. X, Y vs Y, X), and cross-multiplication order. Just as the square root of 4 can be either +2 or -2, so can the area be positive or negative. Because we're generally interested in the magnitude of the answer, we use the absolute value of the area computed.
Areas are determined using the so-called Double Meridian Distance Method. The area is equal to ½ the sum of the products of each abscissa value times the difference between the two adjacent ordinate values.
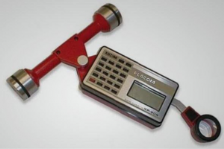
Planimeter
Planimeter is a measuring instrument used in surveying to compute the area of any given plan. Planimeter only needs plan drawn on the sheet to calculate area. It is directly used to measure the area bounded by an irregular curve.
Principle of planimeter
As the planimeter moves, wheel partially rolls and partially slides. The motion of the segment in the direction of the vector N causes the wheel to roll, which is recorded on a scale attached to the wheel. The motion of the segment along its length causes the wheel to slide, and this motion is not recorded
What is the digital planimeter?
The planimeter is used for finding out areas of irregular figures on the sheet there are several formulae available for calculating areas of regular figures, but the actual problem arises when the figure is irregular.
|
Fig-2 planimeter
Planimeter of conventional type like Amsler polar planimeter, rolling planimeter etc, require a lot of time for setting off the farcing arm scale etc. to overcome this, on electronic digital planimeter is used nowadays to obtained the areas of irregular figures directly, accurately as well as quickly, which saves a lot of time and labour.
Digital planimeter works on the built-in nickel-cadmium storage battery.
There is a rotary encoder, which has replaced integrating wheel by mechanical planimeter. An electronic circuit measures the pulses of rotary encoder and area is displayed in digital form.
The setting wheel is used to zero the scales without touching the internal mechanism. The planimeter is a simple instrument for the precise measurement of areas of plane figures of any shape.
Area
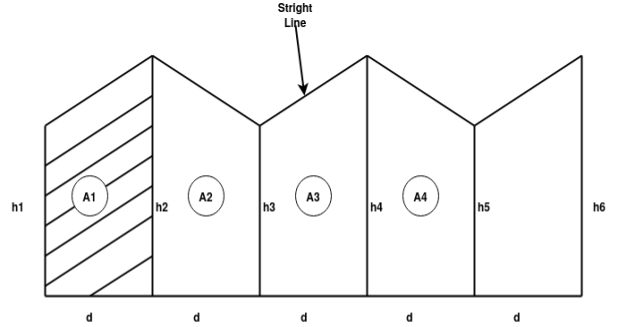
- Trapezoidal rule:
|
Fig-3 Trapezoidal rule
Area 

Total area =A = d(
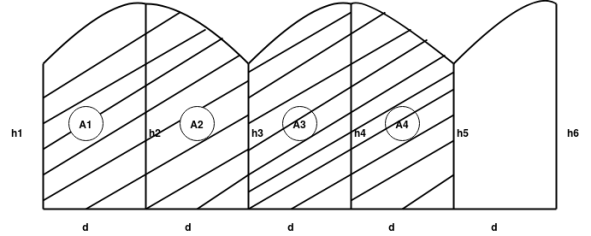
2. Simpson's rule:-
|
Fig-4 Simpson's rule
Total area=A= |
We need odd number of offsets.
If even number of offsets.
One area is calculated by trapezoidal formula and added with remaining area, calculated by Simpsons formula.
|
Fig-5 Simpson's rule example


Total A =?
Volume:-
If parallel areas at equal interval are available (or can be found)
1.Trapezoidal formula

2.Simpson's Formula:-
|
For the computation of the volume of earthwork, the sectional area of the cross-section which is taken to the longitudinal section during profile levelling is first calculated. After calculating the cross-sectional areas
Contours
Contour is a line joining the points of equal elevation.
- the storage capacity of a reservoir is determined from the contour map.
- The contour line indicating the full reservoir level (F.R.L) is drawn on the contour map.
- The area enclosed between successive contours are measured by planimeter
Characteristic of Contour
Contours show distinct characteristic features of the terrain as follows:
i) All points on a contour line are of the same elevation.
ii) No two contour lines can meet or cross each other except in the rare case of an overhanging vertical cliff or wall
iii) Closely spaced contour lines indicate a steep slope
iv)Widely spaced contour lines indicate the gentle slope
v) Equally spaced contour lines indicate the uniform slope
vi) Closed contour lines with higher elevation towards the centre indicate hills
vii) Closed contour lines with reducing levels towards the centre indicate pond or other depression.
viii) Contour lines of ridge show higher elevation within the loop of the contours. Contour lines cross the ridge at right angles
Methods of Contour Surveying
There are two methods of contour surveying:
1. Direct method
2. Indirect method
Direct Method of Contouring
It consists of finding vertical and horizontal controls of the points which lie on the selected contour line. Vertical control levelling instrument is commonly used. A level is set on a commanding position in the area after taking fly levels from the nearby benchmark. The plane of collimation of instrument is found and the required staff reading for a contour line is calculated.
The instrument man asks staff man to move up and down in the area till the required staff reading is found. A surveyor establishes the horizontal control of
that point using his instruments.
After that instrument man directs the staff man to another point where the same staff reading can be found. It is followed by establishing horizontal control.Then several points are established on a contour line on one or two contour lines and suitably noted. After required points are established from the instrument set, the instrument is shifted to another point to cover more area. The level and survey instrument need not be shifted at the same time. It is better if both are nearby to communicate easily.
For getting speed in levelling some times hand level and Abney levels are also used. This method is slow, tedious but got more precision. It is suitable for small areas.
Indirect Method of Contouring
In this, the levels are taken at some selected points and their levels are reduced therefore method horizontal control is established first and then the levels of those points found.
After locating the points on the plan, reduced levels are marked and contour lines are interpolated between the selected points.
For selecting points any of the following methods can be used:
- Method of squares
- Method of cross-section
- Radial line method
- Method of Squares
In this method, the area is divided into several squares and all grid points are marked
Commonly used size of square varies from 5 m × 5 m to 20 m × 20 m. Levels of all grid points are established by levelling. Then grid square is plotted on the drawing sheet. Reduced levels of grid points are marked and contour lines are drawn by interpolation
- Method of Cross-Section
In this method, cross-sectional points are taken regularly. By levelling the reduced level of all those points are made. The points are marked on the drawing sheets, their reduced levels are marked and contour lines are changed.
The spacing of cross-section relies upon the nature of the ground, the scale of the map and the contour interval needed. It varies from 20 m to 100 m. Closer intervals are required if ground level varies.
The cross-sectional line need not be always at right angles to the mainline.
- Radial Line Method
In this method, several radial lines are taken from a point in the area. The direction of each line is written down. On these lines at selected distances points are marked and levels determined. This method is ideally suited for hilly areas.
For interpolating contour points between the two points any one of the following methods may be used:
(a) Estimation
(b) Arithmetic calculation
(c) Mechanical or graphical method
Uses of Contour
Contour maps are extremely useful for various engineering works:
- An engineer studies the contours and finds out the nature of the ground to identify. A suitable site for the project works to be taken up.
- By drawing the section in the plan, it is possible to find out the profile of the ground along that line. It helps in finding out the depth of cutting and filling if the formation level of road/railway is decided.
- Intervisibility of any two points can be found by drawing the profile of the ground along that line.
- The routes of the railway, road, canal or sewer lines can be decided to minimize and balance earthworks.
- Catchment area and hence the quantity of water flow at any point of nalla or river can be found. This study is very important in locating bunds, dams and also to find out flood levels.
- From the contours, it is possible to determine the capacity of a reservoir.
The storage capacity of a reservoir is determined from the contour map. The contour line indicating the full reservoir level (F.R.L) is drawn on the contour map. The area enclosed between successive contours are measured by planimeter
Reference:
1 Madhu, N, Sathikumar, R and Satheesh Gobi, Advanced Surveying: Total Station, GIS and Remote Sensing, Pearson India, 2006.
2 Manoj, K. Arora and Badjatia, Geomatics Engineering, Nem Chand & Bros, 2011
3 Bhavikatti, S.S., Surveying and Levelling, Vol. I and II, I.K. International, 2010
4 Chandra, A.M., Higher Surveying, Third Edition, New Age International (P) Limited, 2002.
5 Anji Reddy, M., Remote sensing and Geographical information system, B.S.
