Unit - 6
Applications of Fourier Representations
Fourier Transform is a mathematical procedure which transforms a function from time domain to frequency domain. Fourier analysis is useful in almost every aspect of the subject ranging from solving LDE to developing computer models, to the processing & analysis of data.
The Fourier Transform is a magical mathematical tool that decomposes any function into the sum of sinusoidal basis functions.
The Fourier Transform is a tool that breaks a waveform (a function or signal) into an alternate representation characterized by sine & cosines.
Suppose our input signal is x(t) X(t) = A ei2πfot + iɸ--------------------------------------(1)
Where A is the real valued amplitude, fo is the frequency and ɸ is the phase parameter.
The output y(t) =
=
Suppose x(t) is sine wave then y(t) =
The Fourier transform of h(t) to obtain the input output relationship y(t) = H(fo) [ A ei2πfot+iɸ] or y(t) = H(fo) x(t) The LTI system passes sine wave input to the output after scaling it by complex number H(fo) where fo is the frequnecy of the sine wave and H(f) is the Fourier transform of the impulse response . Linear systems do not create new frequnecy components they can only scale each frequency component at the input to produce the output. |
By property of translation in the frequency domain we get
Suppose x(t) is a periodic signal with period T which admits Fourier series representation Then x(t) = where ck = 1/T since the Fourier transformation is linear the above result can be used to obtain Fourier transform of the periodic signal X(f) = Therefore X(f) = By putting the inverse Fourier transform equation one can indeed confirm that one obtains the Fourier series representation of x(t)
=
=
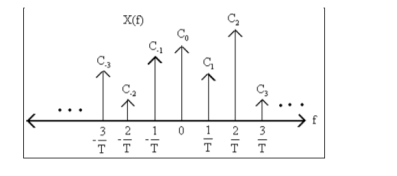
Thus, the Fourier transform of a periodic signal having the Fourier series coefficients is a train of impulses, occurring at multiples of the fundamental frequency, the strength of the impulse at k/T being ck which looks like |
Figure 1. Fourier representation of periodic signals |
6.4 Fourier transform representation of discrete time signals.
The Discrete Time Fourier Transform (DTFT) is the member of the Fourier transform family that operates on aperiodic, discrete signals. The best way to understand the DTFT is how it relates to the DFT. By using the DFT, the signal can be decomposed into sine and cosine waves, with frequencies equally spaced between zero and one-half of the sampling rate. By padding the time domain signal with zeros makes the period of the time domain longer, as well as making the spacing between samples in the frequency domain narrower. As N approaches infinity, the time domain becomes aperiodic, and the frequency domain becomes a continuous signal. This is the DTFT, the Fourier transform that relates an aperiodic, discrete signal, with a periodic, continuous frequency spectrum. Re X(w) = Im X(w) = The DTFT equation is given by x[n] = 1/π |
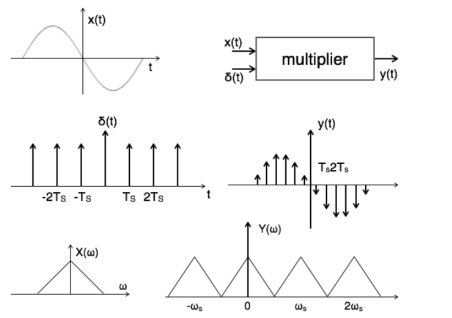
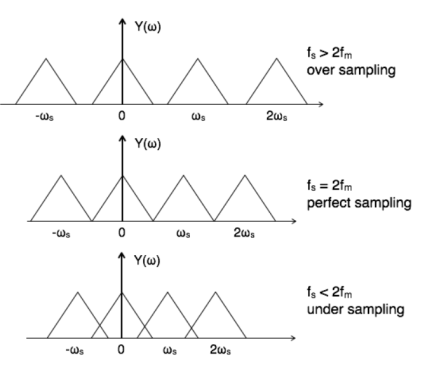
Sampling theorem states that “The continues form of a time-variant signal can be represented in the discrete form of a signal with help of samples and the sampled can be recovered to original form when the sampling signal frequency Fs having the greater frequency value than or equal to twice the input signal frequency Fm. If the sampling frequency (Fs) equals twice the input signal frequency (Fm), then such a condition is called the Nyquist Criteria. When sampling frequency equals twice the input signal frequency is known as “Nyquist rate”. Fs=2Fm If the sampling frequency (Fs) is less than twice the input signal frequency, such criteria called an Aliasing effect. Fs<2Fm Consider a continuous time signal x(t). The spectrum of x(t) is a band limited to fm Hz that is the spectrum of x(t) is zero for |ω|>ωm. Sampling of input signal x(t) can be obtained by multiplying x(t) with an impulse train δ(t) of period Ts. The output of multiplier is a discrete signal called sampled signal which is represented with y(t) in the following diagrams:
Figure2. Spectrum of the sampled signal The sampled signal y(t) = x(t) . δ(t) ---------------------------------(1) The Fourier series representation of δ(t) is given by δ (t) = ao + where ao = 1/Ts an = 2/Ts bn= 2/Ts Therefore δ (t) = 1/Ts + The sampled signal y(t) = x(t). δ(t) = x(t) [1/Ts + = 1/Ts [ x(t) + 2 y(t) = 1/Ts [ x(t) + 2 cos wst . x(t) + 2 cos 2wst. x(t) + 2 cos 3ws(t) . x(t) +………..] Taking Fourier transform on both the sides we get Y(w) = 1/Ts [ X(w) + X(w-ws) + X(w+ws) + X(w-2ws) + X(w+2ws) +…..] Y(w) = 1/Ts
Figure 3. Sampled spectrum with different conditions
Key Takeaways:
|
References:
- Signals and Systems by Simon Haykin
- Signals and Systems by Ganesh Rao
- Signals and Systems by P. Ramesh Babu
- Signals and Systems by Chitode


