Unit-5
Instrumental methods of analysis and Nanomaterials
The instrument is widely used in biological systems. This instrument is used to determine the intensity of compounds in a coloured solution, the principle includes that when a light of specific wavelength of visible spectrum passes through a solution in a photoelectric colorimeter, the reading of reflection is observed on the galvanometer, that shows the quantity of light observed.
The instrument has three specific filters with corresponding light wavelength transmission rays namely Red-490nm, blue 500-530 nm, 620-680nm respectively.
In the calorimetric estimation the two fundamental laws involved are Lambert law and Beer’s law, According to Lambert law “when a monochromatic light passes through a solution that has a constant concentration, the absorption by the solution is directly proportional to the length of the solution”.
In contrast, The Beers law states that “when a monochromatic light passes through a solution of constant length, the absorption by the solution is directly proportional to the concentration of the solution:”
Thus, both the laws can be expressed as:
Lambert’s law: log10 I0/I = K1I
Beer’s law: log10 I0/I = K2I
[where I0 = Intensity of incident light (light entering a solution);
I = Intensity of transmitted light (light leaving a solution);
l = Length of absorbing solution;
c = Concentration of coloured substance in solution;
K1 and K2 = Constants.]
Both Beer-Lambert law are combined together for getting the expression transmittance (T).
T = I/I0
(where I0 is the intensity of incident radiation and I is the intensity of transmitted radiation).
If “T” attains a 100% value, it shows the substance is totally transparent, showing no radiations. When “T” is zero with no radiations, the solution is totally opaque and shows complete absorption. of ‘T’ represent a totally transparent substance, being aborted, for intermediate value we can define the absorbance (A) or extinction (E) that is given by the logarithm (to base 10) of the reciprocal of the transmittance:
A = E = log10 (I/T) = log10 (I0/I)
Absorbance used to be called optical density (OD) but continued use of this term should be discouraged. Also, as absorbance is a logarithm it is, by definition, unit-less and has a range of values from 0 (= 100% T) to cc (= 0% T).
Thus, the basis of colorimetric analysis is the colour of the reaction mixture or system with change in substrate concentration.
The colour of the solution is formed due to the reaction between the substances and reagents in fixed proportions. The intensity of the colour formed is compared with the mixture that also contains the substrate.
The instrumentation is very simple, it consists of a simple light source (lamp), a filter and a curette and a detector that is photosensitive to collect the transmitted light. The incident light is measured by another detector, alternatively a single detector is used to measure the incident and transmitted light. This is much cheap and analytically better as it removes the variations between detectors. The filter that is used here is to get an appropriate range of wavelengths within the bands.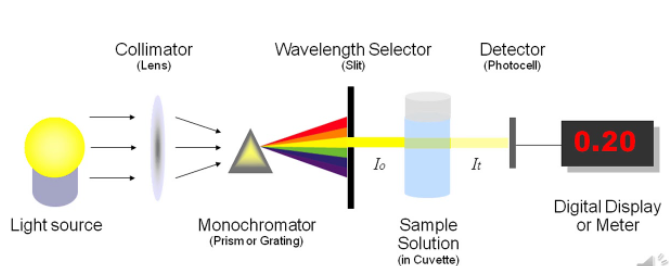
Flame photometry is a process where the emission of radiations obtained by the neutral atoms is measured, the name Flame Photometry is obtained because the sample is introduced into the flame. Since radiations are emitted it is also called flame emission spectroscopy.
Principle
When a metallic salt solution, and sprayed into the flame as fine droplets, upon reaching the flame due to the heat of the flame, the droplets dry leaving a fine residue of salt., the fine residue formed is converted into neutral atoms. These atoms get excited due to the thermal energy of the flame, the excited electrons later return to ground state, while the electrons return to ground state, in excited state they emit specific radiations. For every element the wavelength of emitted radiation is specific. The process is applicable only to few elements like Li, Na, K, Ca and Mg). The intensity of radiations depends on the concentration of the element. E.g.: Na is 589nm, K 767nm etc.
Flame photometer instrumentation:
- Burner
2. Monochromators
3. Detectors
4. Recorder and display.
Burner: The flame here is homogeneous and has stable intensity. It’s the part that produces the excited atoms, when the sample is sprayed into the fuel and oxidant combination.
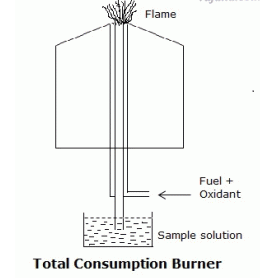
There are different types of burners like Total consumption burner, Laminar flow and
Mecker burner.
Fuel and oxidants: Both are used in combination to produce the required flames wherein the sample changes to neutron atoms and get excited by the heat energy of the flames. It is necessary to keep the flame ideal and stable also. It should be noted that if the flame is high the elements can turn into ions instead of turning into neutral atoms. If the flame is low, atoms may not reach the excited state, therefore the temperature should be perfect, and the combination of fuel and oxidants accurate. The following combination of fuel and oxidants are commonly used.
Fuel | Oxidant | Temperature of Flame |
Propane + | Air | 2100 Degree C |
Propane + | Oxygen | 2800 Degree C |
Hydrogen + | Air | 1900 Degree C |
Hydrogen + | Oxygen | 2800 Degree C |
Acetylene + | Air | 2200 Degree C |
Acetylene + | Oxygen | 3000 Degree C |
Monochromators:
Filters and monochromators are very essential to isolate the light for a specific wavelength, from the other light of the flame. This requirement is met by the simple filters that helps to study the few elements. In this a filter wheel for each element is taken, therefore when an element is taken for analysis, only that particular filter is used as a result all other wavelengths are filtered
Detector: The detector in flame photometric is same as in spectrophotometry, the emissions are in the visible region of 400 to 700nm, the radiations for each element is specific, therefore simple detectors are sufficient for this purpose.
Recorders and display: These are he devises to read out the recording from detectors.
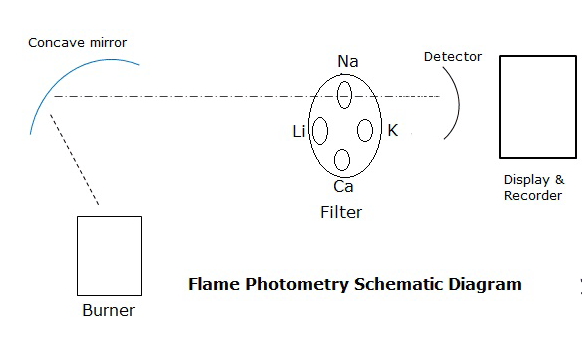
Flame photometer Applications
1. For qualitative analysis of samples by comparison of spectral emission wavelengths with that of standards.
2. For quantitative analysis to determine the concentration of group IA and IIA elements. For example,
a) Concentration of calcium in hard water.
b) Concentration of Sodium, potassium in Urine
c) Concentration of calcium and other elements in bio-glass and ceramic materials.
When we pass white light through a substance that is coloured, some of the light gets absorbed. A solution having hydrated copper (II) ions, for example looks pale blue because the solution absorbs light from the red end of the spectrum. The other wavelengths in the light combine with the eye and the brain to give the appearance of cyan (pale blue).
Some colourless materials are also found to absorb light - but in the ultra-violet region. Different materials absorb different wavelengths of light, and this can be used to help to find the substance - the presence of particular metal ions.
The amount of absorption of light also depends on the concentration of the substance in solution. The measurement of the amount of absorption can be used to find concentrations of very dilute solutions. An absorption spectrometer measures the amount of light is absorbed by a compound varies across the UV and visible spectrum.
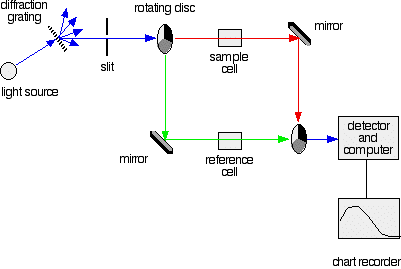
A simple double beam spectrometer
We need a light source which gives the entire visible spectrum together with the near ultra-violet so that you are covering the range from about 200 nm to about 800 nm. (This extends slightly into the near infra-red as well.)
This range of wavelengths is not obtained from a single lamp, and so a combination of two is used - a deuterium lamp for the UV part of the spectrum, and a tungsten / halogen lamp for the visible part. The combined output of these two bulbs is focused on to a diffraction grating.
A diffraction grating does it but more efficiently.

The diffraction grating and the slit
The blue arrows show the way the various wavelengths of the light are sent off in different directions. The slit only allows light of a very narrow range of wavelengths through into the rest of the spectrometer. By gradually rotating the diffraction grating, we allow light from the whole spectrum (a tiny part of the range at a time) through into the rest of the instrument.
The rotating disks
Each disk is made up of a number of different segments. Those that are in the machine are described to have three different sections - other designs may have a different number.
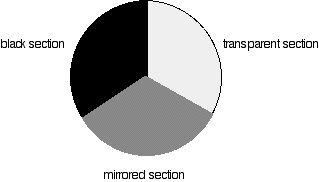
Different sections of rotating disc
The light coming from the diffraction grating and slit will hit the rotating disk and one of three things can happen.
- If it hits the transparent section, it will go straight through and pass through the cell containing the sample. It is then bounced by a mirror onto a second rotating disk. This disk rotates in such a manner that when the light moves from the first disk, it meets the mirrored section that is present on the second disk that bounces it onto the detector.
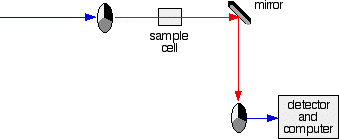
The red path shows the sequence of steps in the diagram
2. If the original beam of light that comes from the slit hits the mirrored section of the first rotating disk, it is bounced down along the green path as shown in the diagram. After the mirror, it passes through a small reference cell. Finally, the light moves to the second disk which rotates in a way that it meets the transparent section. It goes straight through to the detector and then to the computer.
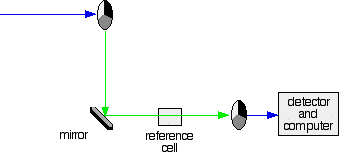
Green path shows the movement of light from disc to the detector
If the light meets the first disk at the black section, it will be blocked - and for some time no light passes through the spectrometer. This will allow the computer to permit any current generated by the detector in the absence of any light.
The sample and reference cells
These are very small rectangular glass or quartz containers or called cuvettes. They are so that the light beam travels a distance of 1 cm through the contents inside the cuvette. The sample cell contains a solution of the substance for testing - usually that is very dilute. The solvent is chosen so that it doesn't absorb any significant amount of light in the wavelength range we are interested in (200 - 800 nm). The reference cell contains only the pure solvent.
Detector converts the light coming into a current. The higher the current, the greater will be the intensity of the light. For each wavelength of light passing through the spectrometer, the intensity of the light passing through the reference cell and is measured. This is usually referred to as Io - where I stand for Intensity.
The intensity of the light passing through the sample/cuvette cell is also measured for that wavelength - given the symbol, I for intensity.
If I is lesser than Io, then assuredly the sample has absorbed some of the light. A simple math is then done in the computer to convert this into something called the absorbance of the sample – which is given the symbol, A.
For reasons which will become clearer, the relationship between A and the two intensities is given by:
A=log(I/Io)
The absorbance ranges from 0 to 1, but it can go higher than that. An absorbance of 0 at some wavelength means that absolutely no light of that particular wavelength has been absorbed. The intensities of the sample solution and solvent beam are both the same, so the ratio Io/I is 1. Log10 of 1 is zero.
The absorption spectrum is a plot of absorbance against wavelength. The output on the computer will look like this:
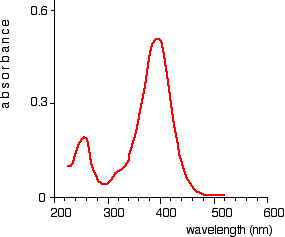
Absorption spectrum showing sharp curve at 255 and 395 nm
This particular substance has a sharp curve at and is known as absorbance peaks at 255 and 395 nm.
A potentiometer (also known as a pot or potmeter) is defined as a 3 terminal variable resistor in which the resistance is manually varied to control the flow of electric current
A potentiometer is a passive electronic component. Potentiometers work by varying the position of a sliding contact across a uniform resistance. In a potentiometer, the entire input voltage is applied across the whole length of the resistor, and the output voltage is the voltage drop between the fixed and sliding contact as shown below.
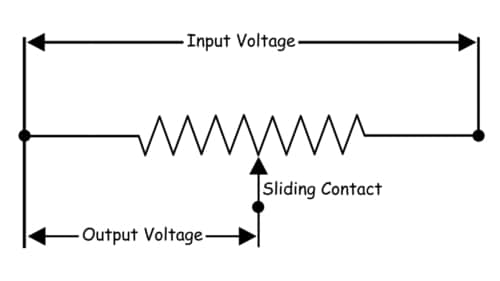
A potentiometer has the two terminals of the input source fixed to the end of the resistor. To adjust the output voltage the sliding contact gets moved along the resistor on the output side.
This is a very basic instrument used for comparing the emf of two cells and for calibrating ammeter, voltmeter, and watt-meter.
The basic working principle of a potentiometer is quite simple. Suppose we have connected two batteries in parallel through a galvanometer. The negative battery terminals are connected together and positive battery terminals are also connected together through a galvanometer as shown in the figure below.
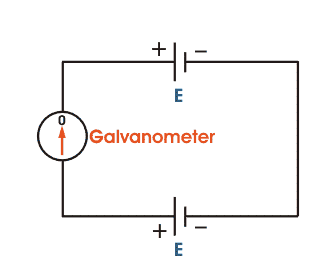
Here, if the electric potential of both battery cells is exactly the same, there is no circulating current in the circuit and hence the galvanometer shows null deflection. The working principle of potentiometer depends upon this phenomenon.
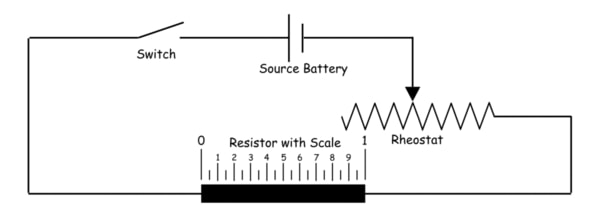
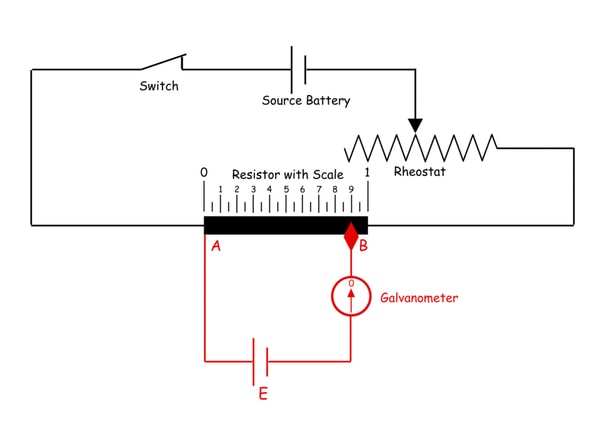
Applications of Potentiometer
There are many different uses of a potentiometer. The three main applications of a potentiometer are:
- Comparing the emf of a battery cell with a standard cell
- Measuring the internal resistance of a battery cell
- Measuring the voltage across a branch of a circuit
Conductance: is the ability of the medium to carry the electric current. Electric current passes through metallic conductors, e.g., wires of iron or copper in the form of electron flow. But conduction of electricity through an electrolyte solution involves migration of positively charged species towards the cathode and negatively charged ones through the anode, i.e. current is carried by all ions present in solution. The conductance of the solution is a reciprocal of its resistance and has the units of ohm-1 (seimen). That is, From Ohm’s law E is the potential difference, i is the current intensity. 
Strong acid and strong base
In a Strong acid with a strong base titration, both the strong acid and the base completely dissociate in water, resulting in a strong acid base neutralisation reaction. The equivalence point is determined when the strong acid is dispensed in to the strong base or vice versa.
Introduction
The purpose of a strong acid-strong base titration is to determine the concentration of the acidic solution by titrating it with a basic solution of known concentration, or vice-versa, until neutralization occurs. As both the acid and base are strong (high values of Ka and Kb), they will both fully dissociate, which means all the molecules of acid or base will completely separate into ions. At the equivalence point, equal amounts of H+ and OH- ions will combine to form H2O, resulting in a pH of 7.0 (neutral). The pH at the equivalence point for this titration will always be 7.0, note that this is true only for titrations of strong acid with strong base. In addition, the anion (negative ion) created from the dissociation of the acid combines with the cation (positive ion) created from the dissociation of the base to create a salt. Therefore, the reaction between a strong acid and strong base will result in water and a salt.
Strong Acid
A strong acid is completely dissociated into ion in an aqueous solution. Therefore, when placed in water, all the strong acid dissociates into ions, the general equation for dissociation of strong acid is.
HA(aq)→H+(aq)+A−(aq)(1)(1)HA(aq)→H+(aq)+A−(aq)
The H represents hydrogen and the A represents the conjugate base (anion) of the acid.
Strong Base
In an aqueous solution the base is completely ionised., when placed in water the base gets completely dissociated in to water to form ions. The general equation of the dissociation of a strong base is:
XOH(aq)→X+(aq)+OH−(aq)(2)(2)XOH(aq)→X+(aq)+OH−(aq)
The OH represents hydroxide and the X represents the conjugate acid (cation) of the base.
The reaction
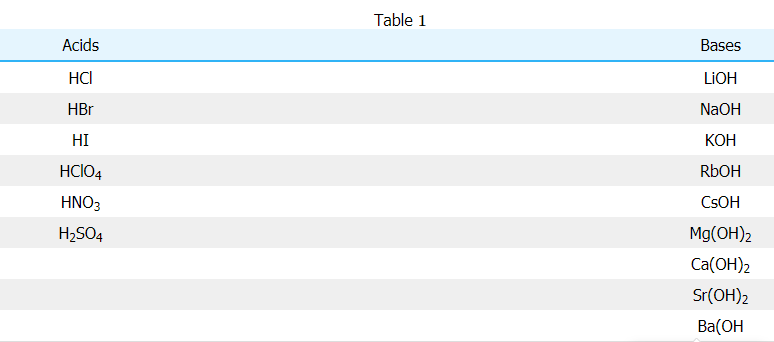
For reactions with strong acid and strong base, the net ionic equation will always be the same since the acid and base completely dissociate and the resulting salt also dissociates. This leaves the final product to simply be water, this is displayed in the following example involving hydrochloric acid (HCl) and sodium hydroxide (NaOH). From Table 11, you can see that HCl is a strong acid and NaOH is a strong base. Therefore, the reaction between HCl and NaOH is initially written out as follows:
HCl(aq)+NaOH(aq)→H2O(l)+NaCl(aq
Weak acid and a strong base
The titration of a weak acid with a strong base involves the direct transfer of protons from the weak acid to the hydroxide ion. The reaction of the weak acid, acetic acid, with a strong base, NaOH, can be seen below. In the reaction the acid and base react in a one-to-one ratio.
C2H4O2(aq)+OH−(aq)→C2H3O−2(aq)+H2O(l)
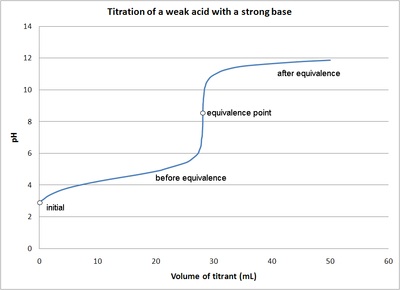
The titration curve is a graph of the volume of titrant, or in our case the volume of strong base, plotted against the pH. There are several characteristics that are seen in all titration curves of a weak acid with a strong base. These characteristics are stated below.
- The initial pH (before the addition of any strong base) is higher or less acidic than the titration of a strong acid
- There is a sharp increase in pH at the beginning of the titration. This is because the anion of the weak acid becomes a common ion that reduces the ionization of the acid.
- After the sharp increase at the beginning of the titration the curve only changes gradually. This is because the solution is acting as a buffer. This will continue until the base overcomes the buffers capacity.
- In the middle of this gradually curve the half-neutralization occurs. At this point the concentration of weak acid is equal to the concentration of its conjugate base. Therefore, the pH=pKa. This point is called the half-neutralization because half of the acid has been neutralized.
- At the equivalence point the pH is greater than 7 because all of the acid (HA) has been converted to its conjugate base (A-) by the addition of NaOH and now the equilibrium moves backwards towards HA and produces hydroxide, that is:
A−+H2O⇌AH+OH−(2)
The steep portion of the curve prior to the equivalence point is short. It usually only occurs until a pH of around 10.
The image of a titration curve of a weak acid with a strong base is seen below. All of the characteristics described above can be seen within it.
Mixture of Strong acid weak base with a strong base
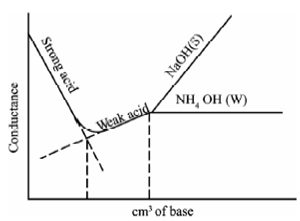
Two break points occur within the curves, the first break point occurs at the neutralisation of strong acid, as the strong acid neutralises, the weak base begins to neutralise, the second break point corresponds to the neutralisation of the weak acid after which the conductance increases, due to excess of OH- ions within case of a strong base as the titrant.
Therefore, while the titrant is a weak base, it remains almost constant after the end points same to Figure.
Nanoscale means one billionth part of a meter or it is also referred to as the dimension of 10-9 meters. The term nanoscale refers to the dimension of 10-9 meters. It is the one billionth part of a meter. Therefore, the particles that have a dimension with respect to their external, internal and surface structure and lie in the range of 1nm to 100nm are called as Nanomaterials
These materials are not visible to the eye, the material that have a science approach to nanotechnology are considered nanomaterials. These materials have unique properties and compared to their molecular-scale behaviour, they show properties that include optical, electronic, quantum and mechanical properties.
A nanomaterial may include nano object or a nanostructured material. Nano objects are the discrete pieces of material, whereas, Nanostructured materials have their internal or surface structure in the nanoscale dimension.
Nanomaterials can occur naturally or can be, artificially manufactured or incidentally formed. With the advance in the research and technology, nanomaterials are being commercialized and are being used as commodities.
Properties of Nano materials
The physical properties of the bulk are less known when compared to viewing its properties from a condensed range matter as unique properties are displayed, between the dimensions on an atomic scale and the normal dimensions. Some such peculiar properties are known, many properties are still to be discovered. Some known physical properties of nanomaterials are related to different origins: for example, (i) imperfections are reduced large fraction of surface atoms, (ii) surface energy, (iii) spatial confinement, and (iv) surface atoms having large fractions. The following are just a few examples:
- Nanomaterials, show huge fraction of surface atoms, from the total amount of atoms, they are known to significantly lower melting point or phase transition temperature and also lattice constants are reduced.
- Mechanical properties of nanomaterials include strength that is higher than the single crystals in the bulk form, which may be a few magnitudes higher. The minimal absence of defects may be the reason for the enhancement in mechanical strength.
- The properties that are optical in nature are markedly different from the nanomaterial and the bulk crystals. For example, for a given semiconductor the optical absorption peak is shifted to a shorter wavelength, as the band gap shows an increase. The colour of metallic nanoparticles may change with their sizes due to surface plasmon resonance.
The Electrical conductivity of Nanoparticles shows a decrease with a reduced dimension that is caused due to increased scattering of surface. However, this feature of electrical conductivity in nanomaterials could also be improved, due to the better ordering in microstructure, e.g. In polymeric fibrils
Definition of Top-down Approach
In the top-down approach, the complex problem or the algorithm is divided into smaller parts or modules, the modules are further divide, until the resulting module cannot be further divided and forms the fundamental program. After a certain level of modesty is reached the division of modules is ceased. This is a step wise process where the large programs modules form simpler and smaller modules to organise and code programs in an efficient way, the flow of this approach is always in the downward direction. The top-down approach is implemented in the “C” programming language by using functions.
Definition of Bottom-up Approach
This approach is opposite to the downward approach, in this case initially the designing of the most fundamental parts is combined to make the higher-level module. The integration of submodules and modules into higher level is repeatedly performed until the required complete algorithm is obtained.
Bottom-up approach functions with layers of abstraction. The primary application of the bottom-up approach is testing as each fundamental module is first tested before merging it to the bigger one. The testing is accomplished using the certain low-level functions.
In material science, this method is used for producing solid materials from smaller molecules. The method is used in fabrication of metal oxides, like silicon and titanium, it involves conversion of monomers into colloidal solution that act as precursor for an integrated network of either discrete particles or network polymers.
Sol-gel method: Add 7.21 mL dibutyl phthalate into 20 mL absolute ethyl alcohol, on magnetic stirrer to stir it for 0.5 h to make liquid A. After measuring and fully mixing 1.50 mL de-ionized water and 20 mL absolute ethyl alcohol, add three drops of concentrated hydrochloric acid to make liquid B. Add B into A, stir it intensely, after 0.5 h there will be gel which is a little bit milky white (there will be twice ultrasonic dispersions in-between), stop stirring and left for 12 h. Put the gel in the 80 °C constant-temperature drying box for 7 h. Porphyrize the product and put it to bake for 2 h in the 550 °C muffle and obtain the sample after cooling it.
Prepare dilute solution of titanium tetrachloride. First add 10 mL hydrochloric acid in the beaker with 40 mL de-ionized water and put the beaker in the ice-water bath. Then placed it on the magnetic stirrer, add 6 mL pure solution of titanium tetrachloride drop by drop while stirring and prepare the expected solution. Keep the temperature of the solution of titanium tetrachloride under 10 °C, add excessive H2O2 into it, in the process the solution will turn dark red first, then it will get darker and finally it turns to black liquid. Under the effect of magnetic stirring, add ammonia gradually in the above-mentioned solution and adjust the pH to 10. When adding ammonia, a white sediment is obtained, but it dissolved with the stirring. A dense yellow particulate seasoning the solution for 12 h, pour out the upper solution, centrifugate the sediment after washing it for three times by the de-ionized water. Place the white sediment in the 60 °C drying box for 12 h, white powders will be produced. Put them to bake in the 550 °C muffle for 2 h, to obtain the nano titanium dioxide powder
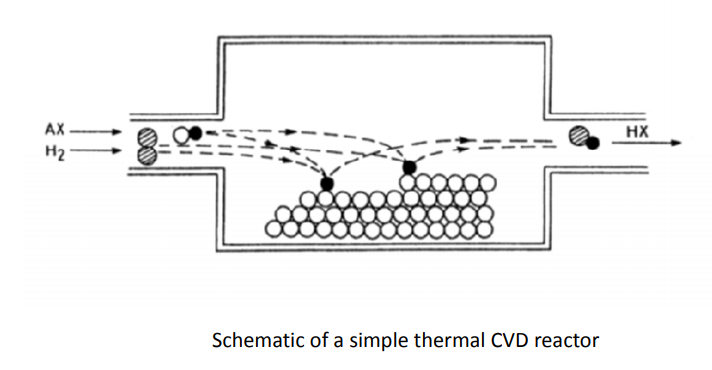
CVD is a chemical process used to produce high-purity, high-performance solid materials. This technique is suitable for the manufacture of coatings, powders, fibres and monolithic components. This technique is often used in many thin film applications. By varying the experimental conditions—substrate material, substrate temperature, composition of the reaction as mixture, total pressure gas flows, etc.— materials with different properties can be grown. Chemical vapour deposition may be defined as the deposition of a solid on a heated surface from a chemical reaction in the vapour phase. It belongs to the class of vapour-transfer processes which is atomistic in nature, that is the deposition species are atoms or molecules or a combination of these
Fullerene, also called buckminsterfullerene, any of a series of hollow carbon molecules that form either a closed cage (“buckyballs”) or a cylinder (carbon “nanotubes”). The first fullerene was discovered in 1985 by Sir Harold Kroto and by Richard smalley, using a laser to vaporize graphite rods in an atmosphere of helium gas, these chemists and their assistants obtained cagelike molecules composed of 60 carbon atoms (C60) joined together by single and double bonds to form a hollow sphere with 12 pentagonal and 20 hexagonal faces—a design that resembles a football or soccer ball. In 1996 the trio was awarded the Nobel prize for their pioneering efforts. The C60 molecule was named buckminsterfullerene (or, more simply, the buckyball) after the American architect R.Buckminster fuller , whose geodesic dome is constructed on the same structural principles. The elongated cousins of buckyballs, carbon nanotubes, were identified in 1991 by Iijima Sumio of Japan.
The C60 molecule undergoes a wide range of novel chemical reactions. It readily accepts and donates electrons, a behaviour that suggests possible applications in batteries and advanced electronic devices. The molecule readily adds atoms of hydrogen and of the halogen elements. The halogen atoms can be replaced by other groups, such as phenyl (a ring-shaped hydrocarbon with the formula C6H5 that is derived from benzene, thus opening useful routes to a wide range of novel fullerene derivatives. Some of these derivatives exhibit advanced materials behaviour. Particularly important are crystalline compounds of C60 with alkali metals and alkaline earth metals; these compounds are the only molecular systems to exhibit superconductivity at relatively high temperatures above 19 K. Superconductivity is observed in the range 19 to 40 K, equivalent to −254 to −233 °C or −425 to −387 °F.
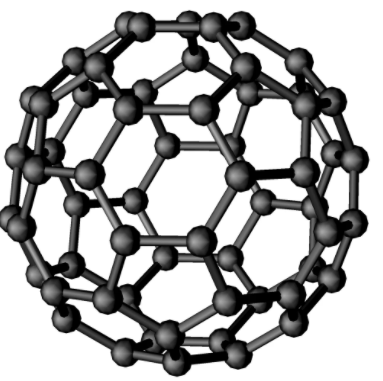
A Fullerene
Iijima of Japan found that the solids consisted of tiny tubes made up of numerous concentric “graphene” cylinders, each cylinder wall consisting of a sheet of carbon atoms arranged in hexagonal rings. The cylinders usually had closed-off ends and ranged from 2 to 10 micrometres (millionths of a metre) in length and 5 to 40 nanometres (billionths of a metre) in diameter. High-resolution transmission electron microscopy later revealed that these multiwalled carbon nanotubes (MWNTs) are seamless and that the spacings between adjacent layers is about 0.34 nanometre, close to the spacing observed between sheets of graphite. The number of concentric cylinders in a given tube ranged from 3 to 50, and the ends were generally capped by fullerene domes that included pentagonal rings (necessary for closure of the tubes). It was soon shown that single-walled nanotubes (SWNTs) could be produced by this method if a cobalt-nickel catalyst was used. These nanotubes are essentially elongated fullerenes.
Individual carbon nanotubes may be metallic or semiconducting, depending on the helical orientation of the rows of hexagonal rings in the walls of the tubes.
Carbon nanotubes exhibit faster phonon transport than diamond, which was previously recognized as the best thermal conductor,
Nanotubes can be “decapped” by oxidation and the resulting opened tubes filled with metals, such as lead, or even with buckyballs. Boron and nitrogen atoms may be incorporated into carbon nanotube walls.
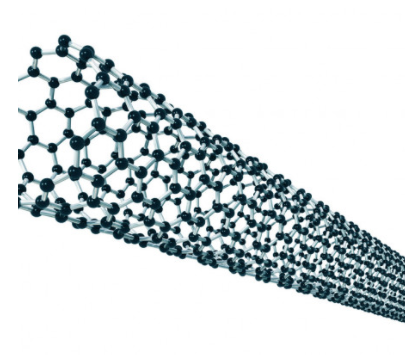
Carbon nano tubes
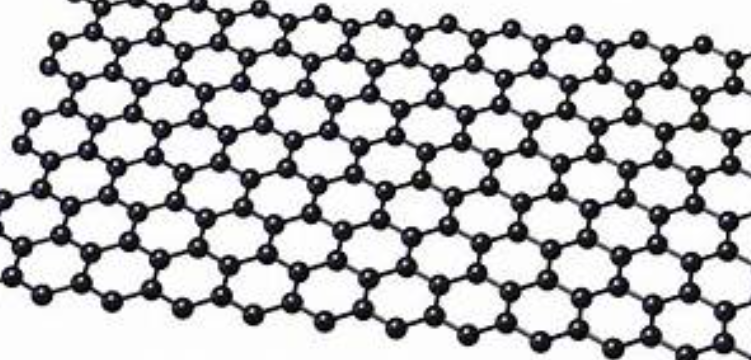
The name represents an atom honeycomb sheet of carbon atoms that is thick in nature, they form the building blocks for other graphitic materials (since a typical carbon atom has a diameter of about 0.33 nanometres, there are about 3 million layers of graphene in 1 mm of graphite).
The units of graphene are called as nanographene; they are specific to certain functions like fabrication process, which is more complicated than generic graphene.
They are known to be Harder than diamond yet more elastic than rubber; graphene is tough like steel but lighter than aluminium.
Graphene is the strongest known material Graphene possesses other amazing characteristics: Its high electron mobility is 100x faster than silicon; its heat conductivity is better two times than that of than diamond, it absorbs only 2.3% of reflecting light; it is impermeable in nature that even the smallest atom (helium) can't pass through a defect-free monolayer graphene sheet; and its high surface area of 2630 square meters per gram
Graphene applications are virtually unlimited and promise to revolutionize many fields: from electronics, sports, food industry and computing to construction and even health care.
Graphene
References:
- O.G. Palanna, "Engineering Chemistry", Tata McGraw Hill Education Pvt. Ltd. New Delhi, Fourth Reprint (2015- Edition).
- R.V. Gadag & A. Nityananda Shetty., "Engineering Chemistry", I K International Publishing House Private Ltd. New Delhi (2015- Edition).
- "Wiley Engineering Chemistry", Wiley India Pvt. Ltd. New Delhi. Second Edition-2013.
- B. Jaiprakash, R. Venugopal, Sivakumaraiah and Pushpa Iyengar, Chemistry for Engineering Students, Subhash Publications, Bengaluru, (2015-Edition).