Unit-II
Consumer Theory
Q1). The indifference curve must be convex to the origin at the consumer equilibrium point. True or false.
Sol: that statement is true. At the point of consumer equilibrium, for the consumer equilibrium to be stable, the marginal substitution rate of goods must be reduced. This means that the indiscriminate curve must be convex at the origin at the equilibrium point. If at this point the indiscriminate curve is concave with respect to the origin, the marginal utility is still increasing.
Q2). Please explain why you "agree" or "disagree" with the following statement: There is no omission to the law of demand.
Sol: this statement is false. Exceptions to the law of demand are:
- Changes in prices of related products
- Tastes and preferences of consumers
- Consumer income
- Technology changes
- Changes in the tax system
- Changes in consumer price expectations.
Q3) .Which of Veblen's good is next?
A. Potatoes
B. Salt
C. Luxury cars
d. None of the above
Sol: The correct answer is c. They are expensive products that become more valuable if the price is higher. The more expensive the product, the higher its value.
Q4). The figure shows the demand for shoes. Give one factor that causes the movement from B to A?

Sol: the demand curve DD in the figure represents the inverse relationship between demand and price. Therefore, price is the determining variable of demand. Thus, the increase in the price of shoes shifts the required amount from A to B.
Q5). Explain the nature of the indifference curve.
Sol: Downward inclination: the indifference curve tilts downwards from left to right.
This means that when the amount of one good in a combination increases, the amount of another must necessarily be reduced so that the total satisfaction is constant.
If the indifference curve is a horizontal straight line (parallel to the X-axis),
Then the indifference curve is a horizontal straight line (parallel to the X-axis),
As shown in the figure. 2.4 (a) means that as the amount of good X increases,
The amount of good Y will remain constant, but the consumer will remain indifferent among the various combinations. This cannot be done, because consumers always prefer a large amount of good to a small amount of its good. Similarly, the indifference curve cannot be a vertical straight line


 Commodity XCommodity XCommodity X
Fig.2.4 (a) Horizontal Fig.2.4 (b) Vertical Fig.2.4(c) Upward Sloping
Indifference CurveIndifference CurveIndifference Curve
A vertical straight line means that while the amount of good y in combination increases the amount of good X remains constant. The third possibility for the curve is to lean upward to the right.
Q6). Explain the statement. “If a successful individual purchases a specific product, the chance cost of that purchase”.
Sol: If a successful individual purchases a specific product, the chance cost of that purchase are going to be as follows
- Forgone goods that buyers may have bought instead.
- Develop models that map or graphically derive consumer preferences. These are
- Measured in terms of the extent of satisfaction that buyers get from various consumption
- Combination or bundle of products. The aim of the buyer is to pick a bunch of products which offers the very best level of satisfaction as they define it consumer? But consumers they are very constrained in their choice. These constraints are defined by the buyer
- Income and the price that buyers buy goods.
Q7). Write note on Theory of consumer preferences.
Sol: Consumer preferences are defined as subjective (personal) tastes as measured by utilities. Various bundles of products. Goods consistent with their permission a bunch of ranks to consumers. The level of utilities they provide to consumers. Please note that preferences are independent of income Price. The power to shop for goods doesn't determine the likes and dislikes of consumers. One can
Have a preference for Porsche than Ford, but only have the financial means to drive Ford. These settings are often modeled and mapped using the indifference curve. In order to graphically depict consumer preferences, you would like to define several terms. First, because we will be working in two dimensions (2D graph), we assume two good worlds. These are arbitrary two goods. Common processing defines not only the food, but also the opposite good composite of all other goods. For descriptive simplicity (which makes things easier for me). Define two goods nearly as good X and good Y. The amount of excellent X for horizontal and good Y for vertical. Each point of this Cartesian space then defines some combination of products X and Y.
Q8). With the help of diagram explain Product bundle.
Sol: The goal of the idea of preference is to permit consumers to rank these goods bundle counting on the quantity of usefulness obtained from them. In other words, consumers have different preferences than different combinations of products defined by a group of products.
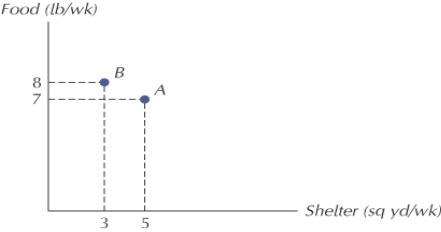
Assumptions about Preference Orderings
- Integrity: consumers can rank all possible bundles of goods and services.
For any two bundles A and B, the consumer knows whether a is good, B is good, or they are just as good
- Transitivity: for any three bundles a, B, and C, if A is a minimum of nearly as good |pretty much as good"> nearly as good as B and B is a minimum of as good as C, then A is at least as good as C.
- These two assumptions mean the principle of ranking.
Q9). What are the assumptions of Price consumption curve?
Sol: The price consumption curve(PCC) shows the varying amounts of products purchased by consumers as their prices change. The marshalian demand curve also shows different amounts of products demanded by consumers at various prices, while others remain an equivalent . Given the income of the consumer's money and his indifference map, it's possible to draw a requirement curve for any commodity from the PCC.The conventional demand curve is straightforward to draw from a given price demand schedule for a commodity, whereas the drawing of the demand curve from the PCC is somewhat complicated. However, the latter method has more edges than the previous . It reaches an equivalent result without making dubious assumptions of the measurable utility of utility and therefore the constant utility of cash .
The derivation of the demand curve from the PCC also explains the income and alternative effects of a given decline or rise within the price of products that the Marshallian demand curve can't be explained. Therefore, the ordinal method for deriving the demand curve is superior to the marshalian method.
Assumption:
In this analysis、:
(a) the cash spent by the buyer is given and constant; it's Rs10.
b) the worth of an honest X falls.
(c) the costs of other related products won't change.
(d) consumer preferences and preferences are constant.
In double story figure 38, money is taken in rupees on the vertical axis and an honest X on the horizontal axis. PQ,PQ1 and PQ2 are the budget lines of consumers where R, S and T are the equilibrium positions forming the PCC curve, and if the entire gold income of consumers in OA, OB and OC units of X respectively at these points on the PCC curve divided by the amount of products purchased with it, we get per unit price of excellent . For X, OA unit, he pays OP/OQ price;for OB unit,OP/OQ1 price; and for OC unit, OP / OQ2.This is, in fact, the buyer price demand schedule for the great X shown in Table 5..
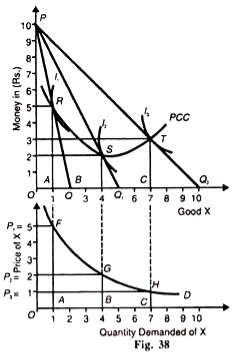
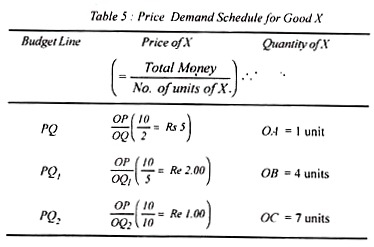
Consumer price demand for an honest X schedule shows that given his money income OP (Rs.10) when he spends his income on buying an oq amount (2 units), it means the worth of X is OP/OQ (Rs).5) consumers buy an honest X OA (one unit) per budget line PQ this is often indicated by the purpose R on the F curve.
If OP/OQ is valued by A, by the budget line PQ (Rs. 2), the worth consumption curve shows that he buys X OB (4 units). When the worth of excellent X is decided as OP/OQ2(=Re1)as the budget line PQ2 and therefore the curve L at the purpose T, the buyer buys OC(7 units)of X.Points R, S,and T on the PCC curve indicate the price-quantity relationship permanently X.
These points are plotted in the figure below figure 38. The price of X is the amount taken on the vertical axis and required on the horizontal axis. To draw a demand curve from PCC, draw a vertical from the top point R in Figure 38 to the bottom figure that should pass through point A, and then draw a line at point P1 (=5) on the price axis (figure below).
Points G and H are drawn in a similar way. This curve shows the amount of X that consumers demand at different prices. As the price of X falls, consumers buy more units of it, and the demand curve D tilts downward to the right.
Q10). Explain Law of demand. Mention its exceptions.
Sol: Now the law of demand states that as the price of a product increases, all conditions become equal, the demand for that product decreases. Therefore, as the price of a product decreases, the demand for it increases. For example, if the price is Rs, consumers can buy Twenty of the bananas.50.
But if the price rises to Rs.70, then the same consumer can limit the purchase to a dozen. Therefore, the demand for bananas, in this case, decreased by a dozen. Thus, the law of demand defines the inverse relationship between the price factor of the product and the quantity factor.
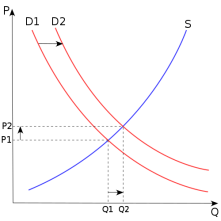
Exceptions to the law of demand
It should be noted that the law of demand is true in most cases. Prices continue to fluctuate until an equilibrium is created. There are certain exceptions to the law of demand. These include Giffen goods, Veblen goods, possible price changes, and essential goods. Let's discuss these exceptions in more detail.Giffen goods
Giffen Collectibles is a concept introduced by Sir Robert Giffen. These products are inferior to luxury goods. However, a unique feature of Giffen products is that demand also increases as its price increases. This the only feature which makes this exception for law.
The Irish Potato Famine is a classic example of the concept of Giffen merchandise. Potatoes are a staple of the Irish diet. Potatoes during the Famine, when the price of potatoes rose, people did not spend too much on high-end foods such as meat and ate more potatoes to stick to their diet, so did the demand as the price of potatoes rose, but this is a complete reversal of the law of demand.