UNIT-3
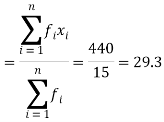
Question-1: Find the mean of the following dataset.
Solution:
We have the following table-
x | f | Fx |
20 | 5 | 100 |
30 | 6 | 180 |
40 | 7 | 160 |
| Sum = 15 | Sum = 440 |
Then Mean will be-

Question-2: Find the arithmetic mean of the following dataset-

Solution:
We have the following distribution-
Class interval | Mid value (x) | Frequency (f) | Fx |
0-10 | 05 | 3 | 15 |
10-20 | 15 | 5 | 75 |
20-30 | 25 | 7 | 175 |
30-40 | 35 | 9 | 315 |
40-50 | 45 | 4 | 180 |
|
| Sum = 28 | Sum = 760 |

Question-3: Find the median of the following dataset-

Solution:
Class interval | Frequency | Cumulative frequency |
0 - 10 | 3 | 3 |
10 – 20 | 5 | 8 |
20 – 30 | 7 | 15 |
30 – 40 | 9 | 24 |
40 – 50 | 4 | 28 |

So that median class is 20-30.
Now putting the values in the formula-


So that the median is 28.57
Question-4: Find the mode of the following dataset-

Solution:
Class interval | Frequency |
0 - 10 | 3 |
10 – 20 | 5 |
20 – 30 | 7 |
30 – 40 | 9 |
40 – 50 | 4 |
Here highest frequency is 9. So that the modal class is 40-50,
Put the values in the given data-


Hence the mode is 42.86
Question-5: If coefficient of skewness is 0.64. Standard deviation is 13 and mean is 59.2, then find the mode and median.
Solution:
We know that-

So that-


And we also know that-


Question-6: Calculate the Karl Pearson’s coefficient of skewness of marks obtained by 150 students.

Solution:
Mode is not well defined so that first we calculate mean and median-
Class | f | x | CF |  | Fd |  |
0-10 | 10 | 5 | 10 | -3 | -30 | 90 |
10-20 | 40 | 15 | 50 | -2 | -80 | 160 |
20-30 | 20 | 25 | 70 | -1 | -20 | 20 |
30-40 | 0 | 35 | 70 | 0 | 0 | 0 |
40-50 | 10 | 45 | 80 | 1 | 10 | 10 |
50-60 | 40 | 55 | 120 | 2 | 80 | 160 |
60-70 | 16 | 65 | 136 | 3 | 48 | 144 |
70-80 | 14 | 75 | 150 | 4 | 56 | 244 |
Now,


And

Standard deviation-

Then-


Question-7: A die is thrown 8 times then find the probability that 3 will show-
1. Exactly 2 times
2. At least 7 times
3. At least once
Solution:
As we know that-


Then-
1. Probability of getting 3 exactly 2 times will be-

2. Probability of getting 3 at least 7 or 8 times will be-

3. Probability of getting 3 at least once or (1 or 2 or 3 or 4 or 5 or 6 or 7 or 8 times)-


Question-8: If the percentage of failure in a test is 20. If six students appear in the test, then what will be the probability that at least five students will pass the test?
Solution:
Here


Then the probability of at least five students will pass the test-


Question-9: Find mean and variance of a binomial distribution with p = 1/4 and n = 10.
Solution:
Here 
Mean = np = 
Variance = npq = 
Question-10: : If cars arriving at workshop follow the Poisson distribution. If the average number of cars arrivals during a specified period of an hour is 2.
Find the probabilities that during the given hour-
1. No car arrive
2. At least two cars arrive.
Solution:
Here the average of car arrivals is - 2
So that mean = 2

Let X be the number of cars arriving during the given hour,
By using Poisson distribution, we get-

So that the required probability-
1. P [no car will arrive] = P [X = x] = 
2. P [At least two cars will arrive] = P [X≥2] = P [X =2] + P [X = 3] + ……….
= 1 - P [[X =1] + P [X =0]]


Question-11: If the probability that a vaccine given to the patients shows bad reaction is 0.001, then find the probability that out of 2000 patients-
1. Exactly 3 patients
2. More than 2 patients
3. No patient
Will show bad reaction.
Solution:
Here p = 0.001 and number of patients (n) = 2000
Then 
By using Poisson distribution, we get-

1. Probability that exactly 3 patients show bad reaction is-

2. Probability that more than 2 patients show bad reaction-


3. Probability that no patient shows bad reaction-

Question-12: If a book has 600 pages and it has 40 printing mistakes. Assume that these mistakes are randomly distributed and x the number of mistakes per page follow Poisson distribution.
What is the probability that there will not be any mistake if 10 pages selected at random?
Solution:
Here 
We get by using Poisson distribytion-

Then-

Question-13: 1. If X  then find the probability density function of X.
2. If X  then find the probability density function of X.
Solution:
1. We are given X 
Here 
We know that-

Then the p.d.f. will be-

2. . We are given X 
Here 
We know that-

Then the p.d.f. will be-

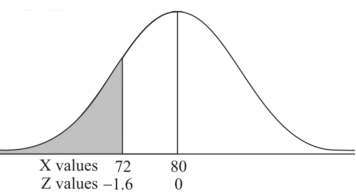
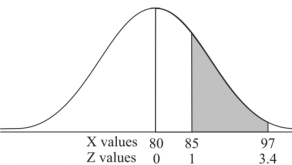
Question-14: : If a random variable X is normally distributed with mean 80 and standard deviation 5, then find-
1. P[X > 95]
2. P[X < 72]
3. P [85 < X <97]
[Note- use the table- area under the normal curve]
Solution:
The standard normal variate is – 
Now-
1. X = 95,

So that-


2. X = 72,

So that-


3. X = 85,

X = 97,

So that-


Question-15: In a company the mean weight of 1000 employees is 60kg and standard deviation is 16kg.
Find the number of employees having their weights-
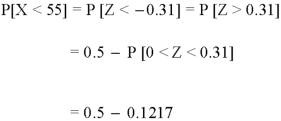
1. Less than 55kg.
2. More than 70kg.
3. Between 45kg and 65kg.
Solution:
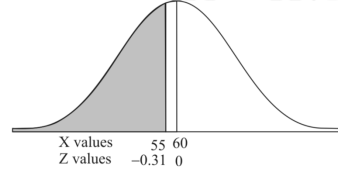
Suppose X be a normal variate = the weight of employees.
Here mean 60kg and S.D. = 16kg
X 
Then we know that-

We get from the data,

Now-
1. For X = 55,

So that-

2. For X = 70,

So that-


3. For X = 45,

For X = 65,


Hence the number of employees having weights between 45kg and 65kg-

Question-16: Compute the Spearman’s rank correlation coefficient of the dataset given below-
Person | A | B | C | D | E | F | G | H | I | J |
Rank in test-1 | 9 | 10 | 6 | 5 | 7 | 2 | 4 | 8 | 1 | 3 |
Rank in test-2 | 1 | 2 | 3 | 4 | 5 | 6 | 7 | 8 | 9 | 10 |
Solution:
Person | Rank in test-1 | Rank in test-2 | d =  |  |
A | 9 | 1 | 8 | 64 |
B | 10 | 2 | 8 | 64 |
C | 6 | 3 | 3 | 9 |
D | 5 | 4 | 1 | 1 |
E | 7 | 5 | 2 | 4 |
F | 2 | 6 | -4 | 16 |
G | 4 | 7 | -3 | 9 |
H | 8 | 8 | 0 | 0 |
I | 1 | 9 | -8 | 64 |
J | 3 | 10 | -7 | 49 |
Sum |
|
|
| 280 |


Question-17: Two variables X and Y are given in the dataset below, find the two lines of regression.
x | 65 | 66 |
| 67 | 67 | 68 | 69 | 70 | 71 |
y | 66 | 68 |
| 65 | 69 | 74 | 73 | 72 | 70 |
Solution:
The two lines of regression can be expressed as-

And

x | y |  |  | Xy |
65 | 66 | 4225 | 4356 | 4290 |
66 | 68 | 4356 | 4624 | 4488 |
67 | 65 | 4489 | 4225 | 4355 |
67 | 69 | 4489 | 4761 | 4623 |
68 | 74 | 4624 | 5476 | 5032 |
69 | 73 | 4761 | 5329 | 5037 |
70 | 72 | 4900 | 5184 | 5040 |
71 | 70 | 5041 | 4900 | 4970 |
Sum = 543 | 557 | 36885 | 38855 | 37835 |
Now-

And

Standard deviation of x-


Similarly-


Correlation coefficient-


Put these values in regression line equation, we get
Regression line y on x-


Regression line x on y-


Question-18: Find the straight line that best fits of the following data by using method of least square.
X | 1 | 2 | 3 | 4 | 5 |
y | 14 | 27 | 40 | 55 | 68 |
Solution:
Suppose the straight line
y = a + bx…….. (1)
Fits the best-
Then-
x | y | Xy |  |
1 | 14 | 14 | 1 |
2 | 27 | 54 | 4 |
3 | 40 | 120 | 9 |
4 | 55 | 220 | 16 |
5 | 68 | 340 | 25 |
Sum = 15 | 204 | 748 | 55 |
Normal equations are-


Put the values from the table, we get two normal equations-


On solving the above equations, we get-

So that the best fit line will be- (on putting the values of a and b in equation (1))

Question-19: Fit the second degree parabola of the following data by using method of least squares.
X | 1929 | 1930 | 1931 | 1932 | 1933 | 1934 | 1935 | 1936 | 1937 |
Y | 352 | 356 | 357 | 358 | 360 | 361 | 361 | 360 | 359 |
Solution:
By taking u = x – 1933 and v = y – 357
Then equation  becomes
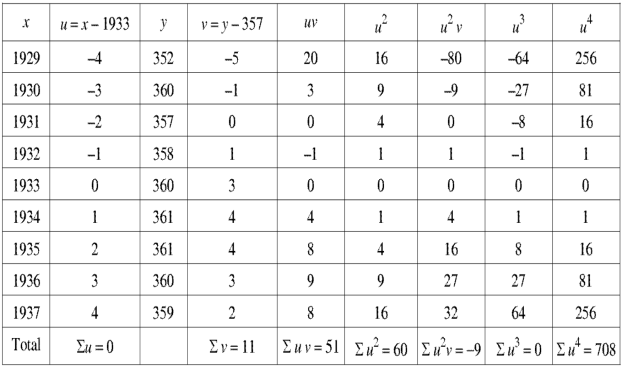
Putting the values from the table in normal equations-
We get-
11 = 3A + 0B + 60C or 11 = 9A + 60C
51 = 0A + 60B + 0C or B = 17 / 20
-9 = 60A + 0B + 708C or -9 = 60A + 708C
On solving, we get-


On solving the above equation, we get-

Question-20: Fit the curve  by using the method of least square.
X | 1 | 2 | 3 | 4 | 5 | 6 |
Y | 7.209 | 5.265 | 3.846 | 2.809 | 2.052 | 1.499 |
Solution:
Here-


Now put-
Then we get-

x | Y |  | XY |  |
1 | 7.209 | 1.97533 | 1.97533 | 1 |
2 | 5.265 | 1.66108 | 3.32216 | 4 |
3 | 3.846 | 1.34703 | 4.04109 | 9 |
4 | 2.809 | 1.03283 | 4.13132 | 16 |
5 | 2.052 | 0.71881 | 3.59405 | 25 |
6 | 1.499 | 0.40480 | 2.4288 | 36 |
Sum = 21 |
| 7.13988 | 19.49275 | 91 |
Normal equations are-

Putting the values form the table, we get-
7.13988 = 6c + 21b
19.49275 = 21c + 91b
On solving, we get-
b = -0.3141 and c = 2.28933
c = 
Now put these values in equations (1), we get-
