Unit - 4
Mechanics of Solids
Q1) What Concept of Stress at a Point?
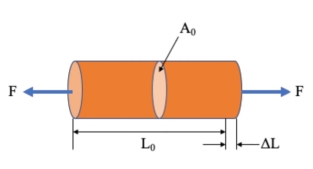
A1) Stress is the force applied to a material, divided by the material’s cross-sectional area.

σ = stress (N/m2, Pa)
F = force (N)
A0 = original cross-sectional area (m2)
Strain is the deformation or displacement of material that results from an applied stress.

ε = strain
L = length after load is applied (mm)
L0 = original length (mm)
Note: A material’s change in length (L – L0) is sometimes represented as δ.
Stress Transformation
It is suitable to neglect the small stress, and in its place of calculating the stress acting on a cubic element inside the material, we can examine the stress acting on a plane.
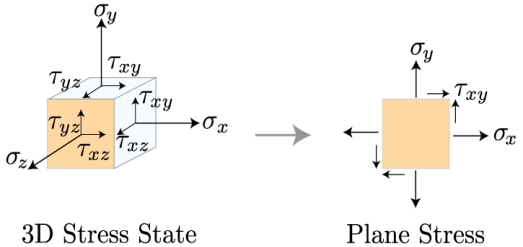
These two states of stress, the 3D stress and plane stress, are frequently discussed in a matrix, or tensor, procedure. As we decrease the dimensionality of the tensor from 3D to 2D, we get free of all the terms that comprise a component in the z direction, such that

Now that we've reduced our state of stress to two dimensions, we can study how to convert the coordinates beside which these stress components act into any coordinate frame we are interested in. Why would we want to do that? Well, take a look at the image below. >
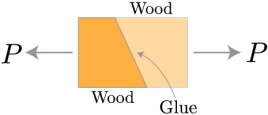
Two parts of wood, cut at an angle, and glued together. The wood is being pulled apart by a tensile force P. How do we distinguish if the glued combined can stand the resultant stress that this force produces?
We need to estimate the normal and shear stresses perpendicular and parallel to the joint. Thus, we need to rotate, or transform, the coordinates linked with the force P to the direction associated with the angle of the glued joint. Then, we can evaluate the stresses along these new directions, x' and y'.
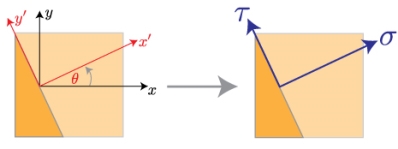
Once we've rotated the coordinate system, we need to convert the forces substitute in the old coordinate frame to this new coordinate frame. That means, we need draw a full free body diagram.
If we takings a differential element closes the origin of the new coordinate system, we can acquire the forces performing on each surface from the stress times the differential area.
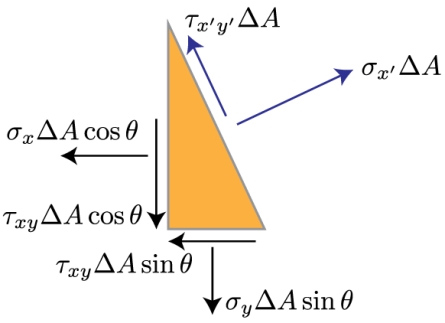
As you'll notice from the free body diagram, most of the forces aren't directing in the directions we're involved in, that is x' and y'. So, we must to break these forces into their components, and sum the resulting forces in the directions of our new coordinate system.
This consequences in a long, but straightforward, calculation given below
We can stop here if we'd like. However, if we make use of a couple trigonometric identities, we can make these equations a bit more friendly looking.
By means of these characteristics, we can get free of all those squared sines and cosines. The final result for the normal and shear stresses in our new coordinate system denoted by theta, which is a counter clockwise rotation from the x axis to the x' axis is given by
Q2) What is Principal Stress & Mohr's Circle?
A2) We have just shown that the size of the cut and normal stress will depend on the coordinate system chosen. If you rotate the coordinate system at any angle, the magnitude of these stresses will change.
As can be suspected, certain angles will correspond to the maximum and minimum values of these stresses.
As One way to determine the ends of a function is to differentiate it from the variable of interest and set the resulting equation equal to zero.
Now, we can resolve for by recalling the connection between sines, cosines, and tangents, such that
Included We have included an index p in theta to identify this angle as the plane corresponding to the normal maximum and minimum stresses. These equations have two roots, that is, two theta values will satisfy you.
These two values will be separated by 900 (or 2 * theta will be separated by 1800). One corner will correspond to the maximum normal effort and the other will correspond to the minimum.
We will talk about identifying which one is that short. First, we note that we can repeat this same procedure to determine the angle at which the element will be subject to the maximum and minimum cut:
Now that we have plans where the stress will be maximum and minimum, we need to identify the extent of these main stresses. There are several ways to do this, but the general idea should be familiar to anyone who has seen linear algebra techniques.
Our goal is to diagonalize our flat stress tensor and the resulting eigenvalues will correspond to the extremes of our state of stress.
Objective Our objective in finding the main stresses in an element is to eliminate the dependence of the theta stress transformation equations.
The equations that describe stress transformation are the parametric equations of a circle.
We can remove the theta by squaring both sides and adding them (I took the liberty of transposing the first term on the right side of the equation, which is independent of the theta and corresponds to the average stress).
This calculation looks much worse than it is. Again, we simply transpose the average stress, square both sides and add the equation for normal stress to the equation for shear stress.
Things are pretty good. The second term on the right side of each equation is cancelled. What we are left with are the terms sine square plus cosine square and from our trigonometric identities we remember that this term is equal to zero.
Result The resulting equation contains the main normal and shear stresses. The main normal stress will occur when the shear stress is zero, which means
The principal shear stress is simply the square root term
An alternative to using these equations for the main stresses is to use a graphical method known as the Circle of Mohr. This involves creating a graph with sigma as abscissa and tau as ordinate and representing the state of stress given. The sign convention is as follows
We draw two points. The normal and shear stress acting on the right side of the plane constitutes a point, and the normal and shear stress on the upper face of the plane constitutes the second point.
These two points are located in a circle. The centre of that circle is the average normal stress. The radius of that circle is the extreme shear stress. The highest sigma value is the first major stress and the smallest sigma value is the second largest stress.
Q3) What is Mohr's Circle?
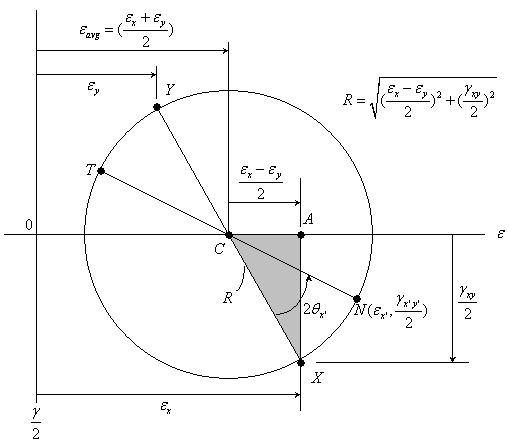
A3) Circle Mohr's circle is not actually a new derived formula, but only a new way of viewing the relationships between normal deformations and shear deformations when the rotation angle changes. To determine the effective equation for the Mohr circle, the deformation transformation equations can be rearranged to provide,
Each side of these equations can be squared and then added together to give Grouping like terms and cancelling other terms gives
Using the trigonometry identity, cos22θ + sin22θ = 1
Basic Mohr's Circle for Strain:
This is basically an equation of a circle. The circle equation can be better visualized if it is simplified to
This circular equation is drawn on the left using r and εave. An advantage of the Mohr circle is that the main deformations, ε1, ε2 and the maximum shear strain, (γmax / 2), are easily identifiable on the circle without further calculations.
A displacement field is a displacement vector mapping for all points in a region or body that moves from one state to another. A displacement vector specifies the position of a point or particle with reference to a previous origin or position. For example, a displacement field can be used to describe the effects of deformation on a solid body.
Before considering displacement, it is necessary to define the state before deformation. It is a state in which the coordinates of all points are known and described by the function.
Q4) What is Principal Strain?
A4) In-Plane Principal Strains: 
In-Plane Principal Directions: 

Q5) What Mohr's circle for two-dimensional Strain?
A5) Similar to the stress-transformation equations, the strain-transformation equations can be simplified but presenting the double-angle trigonometric characteristics. This yields
 ----1
----1
 -----2
So


Calculation of a circle in the plane with center at
 and radius R, with the angle
  existence a parameter is

Q6) What Three-Dimensional Material Anisotropy?
A6) For a three-dimensional elastic anisotropic body (Fig. 6.1), the general Hooke's law is stated as
 (I,j=1,2,3) (6.1)
where  besides
  are the stress and strain tensors, correspondingly, and
  are the elastic constants. Here the indices i, j, k and l can assume values of 1, 2 and 3. This suggests that there may exist 34 = 81 independent elastic constants. Though, it is known from the theory of elasticity, that both stress tensor
  and strain tensor
  are symmetric. As
and as  (6.2)
(6.2)
Thus,  (6.3)
(6.3)
This effects in reduction of likely independent elastic constants to thirty-six.
Additional, if there exists a strain energy U such that
 (6.4)
(6.4)
with the property that  , then
 (6.5)
(6.5)
Equation 6.5 in combination with Eq. 6.3 lastly reduce the total number of independent elastic constants from thirty-six to twenty-one only. Such an anisotropic material with twenty-one independent elastic constants is called as triclinic. Now, using the following contracted single index notations

The constitutive relations for the general case of material anisotropy are specified as
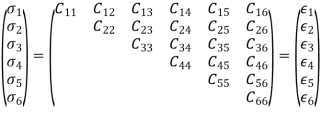 (6.7)
(6.7)
or, ; i, j = 1, 2,.,6 (6.8)
Now, [ ] is the elastic constant matrix.
Equally, {  } = [Sij ] {
 } ; i, j =1, 2,�..,6 (6.9)
where [Sij] is the submission matrix.
Note that
[Sij] = [Cij ]-1 (6.10)
Similarly, [ ] =[
] =[ ] and [Sij] = [Sji] due to symmetry.
We refer to the proportionality constant between stress and tension as the elastic modulus. But why do we call it that? What does it mean that an object is elastic and how can we describe its behavior?
Elasticity is the tendency of solid and material objects to return to their original shape after the external forces (load) that cause deformation are removed. An object is elastic when it returns to its original size and shape when the load is no longer present. The physical reasons for elastic behavior vary between materials and depend on the microscopic structure of the material. For example, the elasticity of polymers and gums is caused by the elongation of the polymer chains under an applied force. On the contrary, the elasticity of the metals is caused by the change in size and by the remodeling of the crystalline cells of the networks (which are the material structures of the metals) under the action of externally applied forces.
The two parameters that define the elasticity of a material remain its elastic modulus and its elastic limit. A high elastic modulus is typical for materials that are difficult to deform; in other words, materials that require a high load to obtain significant voltage. An example is a steel band. A low elastic modulus is typical for materials that deform easily under load; for example, an elastic band. If the stress under a load is too high, when the load is removed, the material no longer returns to its original shape and size, but relaxes in a different shape and size: the material is permanently deformed. The elastic limit is the tension value beyond which the material no longer behaves elastically but deforms permanently.
Our perception of an elastic material depends both on its elastic limit and on its elastic modulus. For example, all tires are characterized by a low elastic modulus and a high elastic limit; therefore, it is easy to stretch them and the elongation is remarkably large. Of the materials with identical elastic limits, the most elastic is the one with the lowest elastic modulus.
When the load increases from zero, the resulting stress is directly proportional to the stress, but only when the stress does not exceed a limit value. For stress values within this linear limit, we can describe the elastic behavior in analogy with Hooke's law for a spring. According to Hooke's law, the elongation value of a spring under an applied force is directly proportional to the amount of force. On the contrary, the response force of the spring to an applied elongation is directly proportional to the elongation.
Similarly, the deformation of a material under a load is directly proportional to the load and, on the contrary, the resulting stress is directly proportional to the stress. The linearity limit (or proportionality limit) is the highest voltage value beyond which the voltage is no longer proportional to the voltage. Beyond the linearity limit, the relationship between stress and tension is no longer linear. When the stress becomes greater than the linearity limit but still within the elastic limit, the behavior remains elastic, but the relationship between stress and tension becomes nonlinear.
For stresses beyond the elastic limit, a material exhibits a plastic behavior. This means that the material irreversibly deforms and does not return to its original shape and size, even when the load is removed. When the tension gradually increases beyond the elastic limit, the material undergoes a plastic deformation. Rubber-like materials show an increase in tension as tension increases, which means that they become more difficult to stretch and eventually reach a breaking point where they break.
Ductile materials such as metals show a gradual reduction of stress with increasing stress, which means that they become easier to deform when the stress deformation values approach the breaking point. The microscopic mechanisms responsible for plasticity of materials are different for different materials.
We can trace the relationship between stress and tension on a stress-strain diagram. Each material has its own characteristic stress deformation curve. Typical stress-strain diagram for a ductile metal under load. In this figure, deformation is a fractional stretch (not drawn to scale). When the load gradually increases, the linear behavior (red line) that begins at the non-load point (the origin) ends at the linearity limit at point H.
For a higher load it increases beyond the H point, the voltage relationship - non-linear deformation, but still elastic. In the figure, this nonlinear region is seen between the points H and E. The increasing loads bring the stress to the elastic limit E, where the elastic behavior ends and the plastic deformation begins. In addition to the yield strength, when the load is removed, for example in P, the material relaxes in a new shape and size along the green line. This means that the material is permanently deformed and does not return to its initial shape and size when the tension becomes zero.
The material undergoes plastic deformation for loads large enough to cause the stress to overcome the yield strength on E. The material continues to be deformed plastically until the stress reaches the fracture point (breaking point). Beyond the fracture point, we no longer have a sample of material, so the diagram ends at the fracture point. To complete this qualitative description, it should be said that linear, elastic and plastic limits indicate a range of values rather than an acute point.
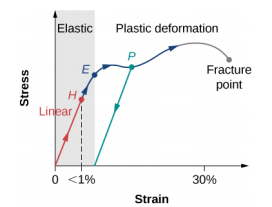
Figure: typical stress-strain graph for a metal under load: the graph ends at the fracture point. The arrows show the direction of the changes under increasing load. The points H and E are the limits of linearity and elasticity, respectively. Between points H and E, the behavior is not linear. The green line from P illustrates the response of the metal when the load is removed. Permanent deformation has a deformation value at the point where the green line intersects the horizontal axis.
The stress value at the fracture point is called breaking stress (or final stress). Materials with similar elastic properties, such as two metals, can have very different breaking stresses. For example, the final stress for aluminum is 2.2 x 10⁸ Pa and for steel it can reach 20.0 x 10⁸ Pa, depending on the type of steel. We can make a quick estimate, based on equation, that for bars with a cross-sectional area of 1 inch, the breaking load for an aluminum rod is 3.2 x 10⁴ lbs and the load breaking point for a steel bar is about nine times larger.
Q7) What Thermal expansion?
A7) Through a change in temperature ΔT, from an ambient temperature, a piece of material will change in volume — it obtains a thermal strain.
A simple model for how this thermal strain ϵth varies with the change in temperature ΔT is
ϵth=αΔT(1)(1)ϵth=αΔT
where α [1/∘C] is a material parameter entitled the coefficient of thermal expansion.
During a grouping of mechanical and thermal load (change in temperature), we get the total (noticeable) strain as the sum of mechanical and thermal strain.
ϵσ=ϵmech+ϵth=σE+αΔT⇒=E(ϵ–αΔT)(2)(3)(2)ϵ=ϵmech+ϵth=σE+αΔT⇒(3)σ=E(ϵ–αΔT)

Only mechanical strains give rise to stresses.
For example, if the material only experiences thermal strain (the total strain), then the stress converts zero:
ϵ=ϵth⇒σ=E(ϵth–ϵth)=0(4)(4)ϵ=ϵth⇒σ=E(ϵth–ϵth)=0
Thermal deformation:
The deformation of a bar with length L is obtained as the integral of the strain along the bar
δth=∫Lϵthdx=∫Lα ΔTdx(5)δth=∫Lϵthdx=∫Lα ΔTdx
A common case is having a bar with a homogenious material and supposing a constant change in temperature along the whole bar. The thermal deformation can then be written
δth=α ΔT∫Ldx=α L ΔT(6)
Q8) What is Axial force?
A8) Axial force
it is the force in the radius that acts parallel to the longitudinal axis.
Below is a drawing of a simply supported beam of length L under uniform load, q:

This beam has the following support reactions:
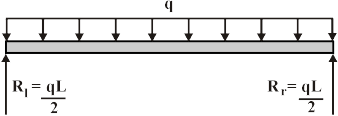
where Rl and R rare the responses at the left and right ends of the beam, correspondingly.
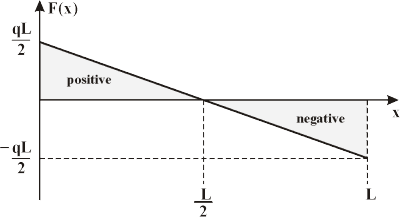
The shear forces at the ends of the beam are equivalent to the vertical forces of the support responses. The shear force F(x) at some other point x on the beam can be establish by using the succeeding equation.

here x is the distance from the left side of the beam.
Shear force diagrams are only plots of the shear force (on the y-axis) versus the position of various points along the beam (on the x-axis). Thus, the succeeding is the generalized shear force diagram for the beam shown above.
Q9) What Torsion of Shaft and Combined Stresses?
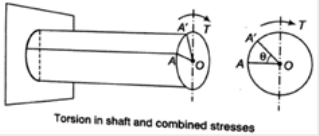
A9) Torsion state that twisting a structural Member when it is loaded by couple that Produces rotation around longitudinal axis.
If  stand the intensity of shear stress, on slightly layer at a distance r from the centre of shaft, now

Sign Convention:
Sign convention of torque can be described by right hand thumb rule. A positive torque is that in which here is tightening effect of nut going on the bolt. From either side of the cross-section. If torque is useful in the direction of right-hand fingers than right hand thumbs direction signifies movement of the nut.
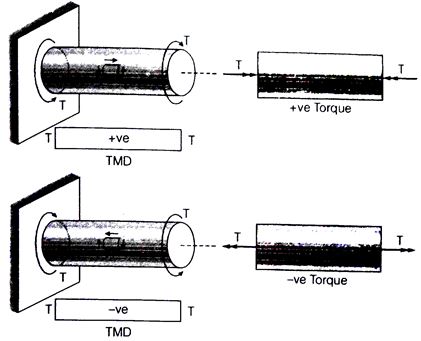
TMD = Torsion moment diagram
T = Torque
Rate of twist:

Total angle of twist:
Where, T = Torque,
J = Polar moment of inertia
G = Modulus of rigidity,
θ = Angle of twist
L = Length of shaft,
GJ = Torsional rigidity
 Torsional stiffness;
 Torsional flexibility
 Axial stiffness;
 Axial flexibility
Q10) What Torsion of a thin circular tube?
A10) Introduction:
The simplest torsion problematic is that of the twisting of an even thin circular tube.
Description:
The tube revealed in Figure is of thickness f, and the mean radius of the wall is r, L is the length of the tube.
Shearing stresses T are useful around the circumference of the tube at each end and in differing directions.
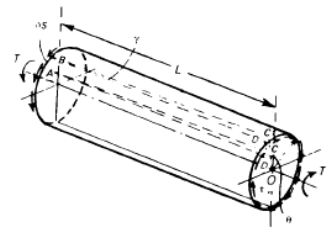
Figure: Torsion of a thin-walled circular tube.
If the stresses T are uniform round the boundary, the total torque T at individually end of the tube is

Therefore, the shearing stress round the Circumference due to an applied torque T is

We study next the strains produced by these shearing stresses. We note firstly that balancing shearing stresses are set up in the wall parallel to the longitudinal axis of the tube.
If δs is a small length of the boundary then an element of the wall ABCD, is in a state of pure shearing stress. If the remote end of the tube is theoretical not to twist, then the longitudinal element ABCD is distorted into the parallelogram ABC'D', Figure the angle of shearing strain existence

if the material is elastic, and requires a shearing (or rigidity) modulus G. However, if is the angle of twist of the near end of the tube we must

hence

It is occasionally more convenient to define the twist of the tube as the rate of change of twist per unit length; this is given by (θ/L)




or

