Unit-2
Alloys, substitutional and interstitial solid solutions
Question 1: Define alloys. Explain the substitutional solid solution.
A1: Alloy is a metallic substance that is composed of two or more elements.
For example: - Bronze, Al-alloy, Phosphor bronze, silicon bronze, Beryllium bronze, Brasses, etc.
Substitutional Solid Solution:
A solute atom may occupy two alternative positions in the lattice of solvent(matrix) metal.
If the atoms are of compressible size, the solute atom will substitute at random for one of the matrix atoms in the crystal lattice. This kind of structures is called a substitutional solid solution.
For Example, brass is an alloy of copper and zinc which forms solid solution most readily as the atoms of these elements have similar sizes and electron structure.
Substitutional solid solution is of two types:
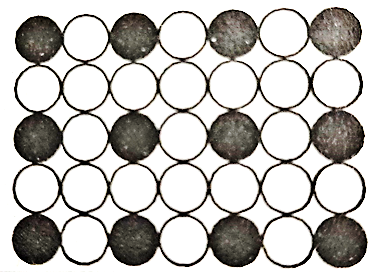
Figure: Substitutional Solid Solution
Question 2: Define Interstitial Solid Solution.
A2: There are few relatively small atoms that can be accommodated in the intersites between solvent atoms to form an interstitial solid solution.
Carbon in iron is the example of such a type of solution which is the basis of steel hardening.
Interstitial solid solution normally has very limited solubility and is generally considered of secondary importance.
In some alloys, both interstitial and substitutional solid solutions are formed to an appreciable extent.
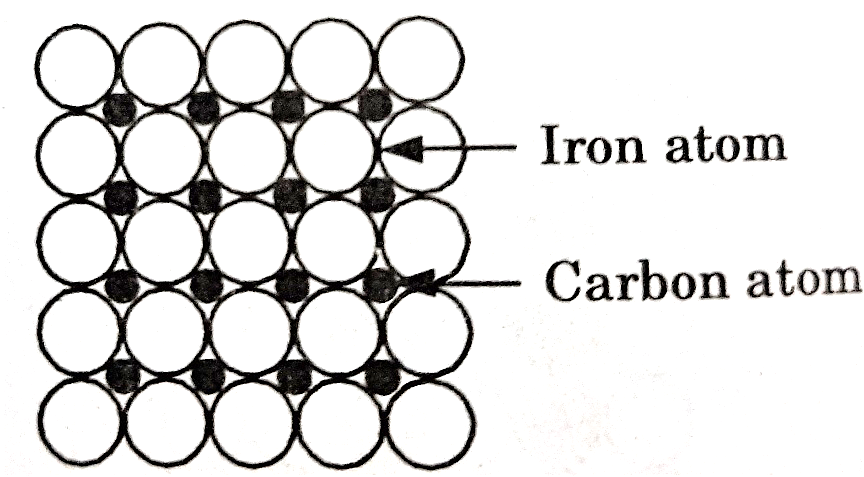
Figure: Interstitial Solid Solution
Question 3: Define phase work and its types.
A3: The existence of different phases in an alloy system can be represented by a diagram known as phase diagram.
In phase diagrams, graphical representations of changes in state due to variations in concentration and temperature enables the phase content of the alloy to be determined at any temperature and composition.
They enable the phase transformations to be followed in heating or cooling the alloy under equilibrium conditions i.e., when all processes in the given system are reversible.
All phase diagrams have temperature as the vertical scale (ordinate) and percentage composition by weight as the horizontal scale (abscissa).
A phase diagram permits the control and study of metallurgical processes.
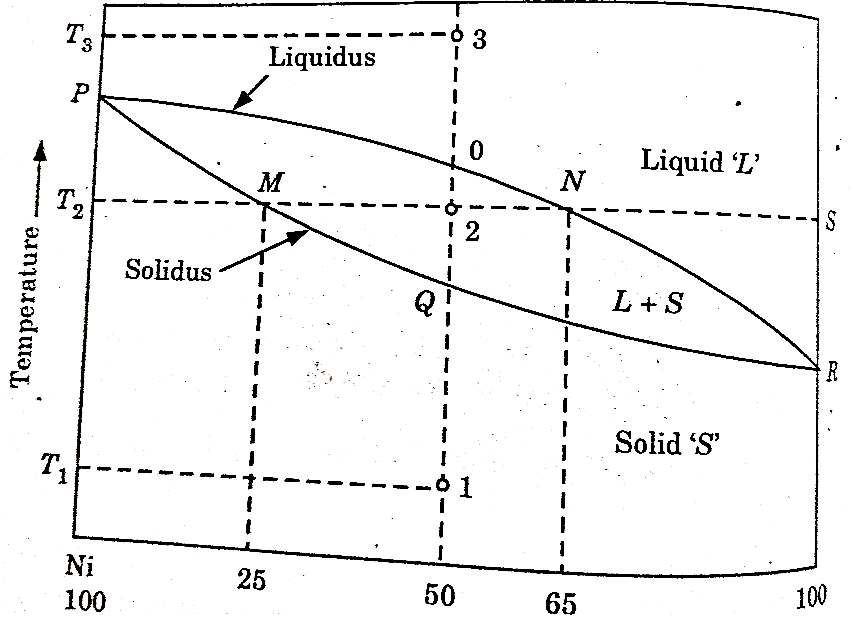
Figure: Phase diagram of nickel and copper
A phase diagram is of three types:
Question 4: Define Interpretation of binary phase diagram and microstructure development:
A4: A graphical representation of a mixture or alloy of two metals instead of pure substance is known as binary phase diagram.
Pure copper is a one component system, whereas an alloy of copper and nickel is a two-component system. Sometimes a compound in an alloy is also considered a separate component.
For example, plain carbon steels containing iron and iron carbide are considered two component systems.
In some binary metallics system the two elements are completely soluble in each other in both the liquid and solid states.
In these systems only a single type of crystal structure exists for all compositions of the components and therefore they are called isomorphous system.
A phase diagram of copper-nickel system with temperature as the ordinates and chemical composition in weight percent as the abscissa is shown in fig.
This diagram has been determined for slow cooling or equilibrium conditions at atmospheric pressure and does not apply to alloys that have been rapidly cooled through the solidification temperature range.
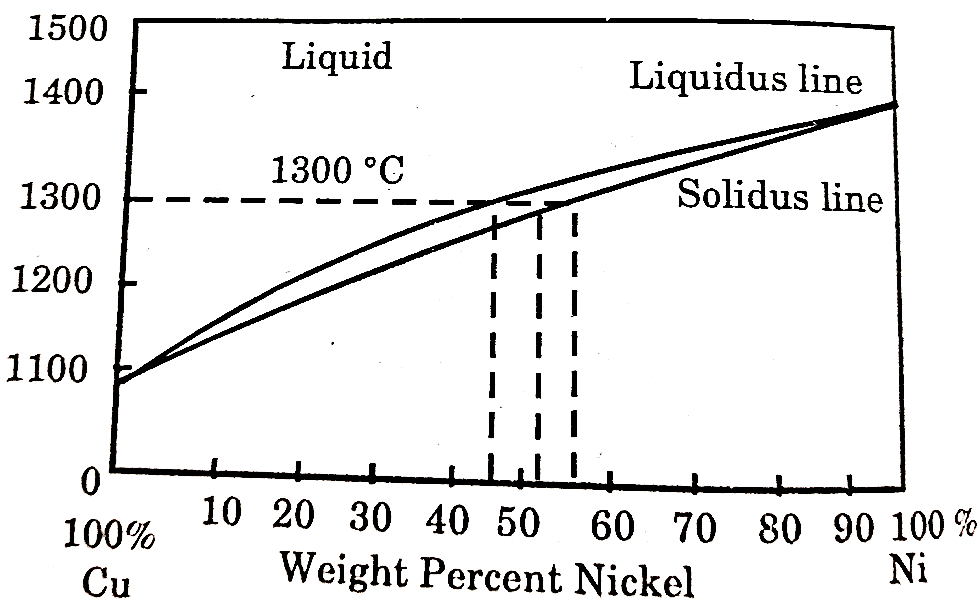
Figure 4: Binary Phase Diagram
The area above the upper line in the diagram called the liquids corresponds to the region of the stability of the liquid phase and the area below the lower line or solidus represents the region of stability for the solid phase.
The region between the solidus and liquids represent a two-phase region where both the liquid and solid phase co-exists.
The amount of each phase present depends on the temperature and chemical composition of the alloy.
Question 5: What is Eutectic Phase Diagram?
A5: When the melting points of the two components are not much different and a partial or negligible solid solubility exists between them. The phase diagram is called eutectic phase diagram.
In the figure, we choose lead and tin as there is not much difference in their melting points. The two-solid phase’s  present.
In  – phase very small amount of tin is dissolved is lead and in
  - phase very small amount of lead is dissolved in tin.
In  phase both (line and lead) are dissolved in each other sufficiently.
BDE line separate the two-phase regions of  and
and  ,
,  and
and  ,
,  and
and  . This line is called eutectic line and temperature corresponding to this line is called eutectic temperature.
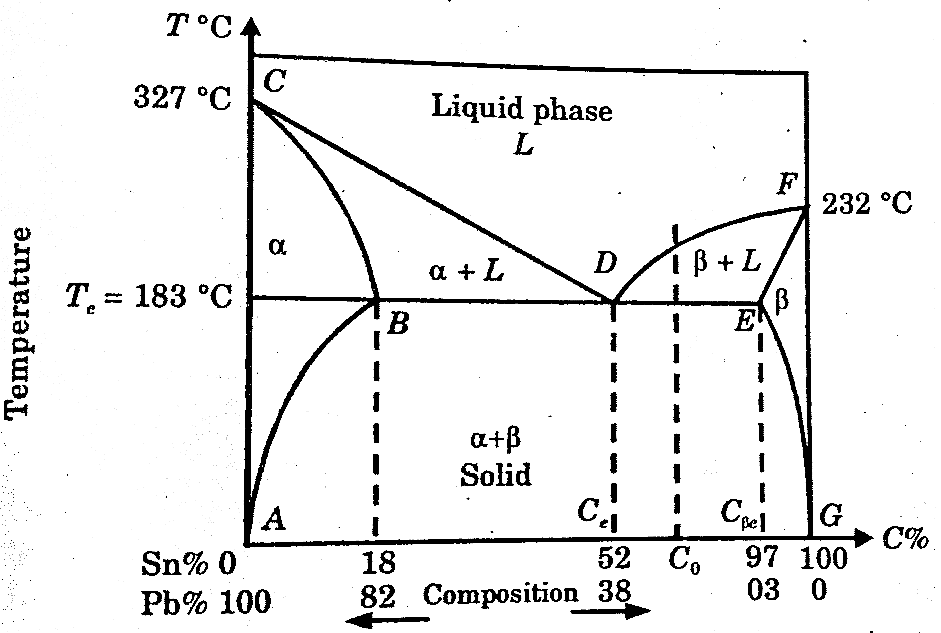
Figure: Binary Phase Diagram of lead-Tin showing phases, eutectic point and eutectic composition.
At point D eutectic reaction occurs as liquid phase is inn equilibrium with two solid phases.

At point D,
Degree of freedom, D = C – P + 1
C = 2, P=3
So, D = 2 – 3 + 1 = 0
At point D, eutectic temperature and eutectic reaction are called invariant temperature and invariant reaction.
Question 6: Explain Peritectic phase diagram and peritectoid phase diagram.
A6:
When there is a much difference in the melting point of two components, peritectic phase diagram can be obtained.
Peritectic point is that point at which there is an equilibrium between one solid-liquid phase and a single solid phase.
Temperature of this point is called as peritectic temperature and composition is called peritectic composition.
The degree of freedom is zero at this point. Hence the peritectic reaction is an invariant reaction.
At point B,

From figure two components A and B are chosen (such that there is a much difference in their melting point).
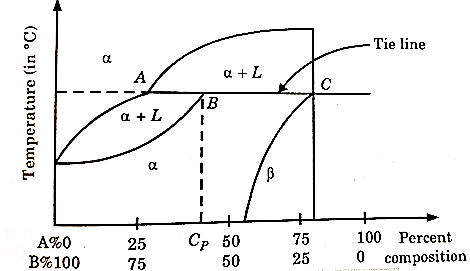
Figure: Peritectic Phase Diagram
Their phase diagram consists of two solid phases  and a liquid phase ‘L’.
At a point B,  (solid phase) + L (liquid phase) is in equilibrium with a solid phase.
This point B is called peritectic point. The temperature and composition wit respect to point B is called peritectic temperature and peritectic composition respectively.
2. Peritectoid Phase Diagram:
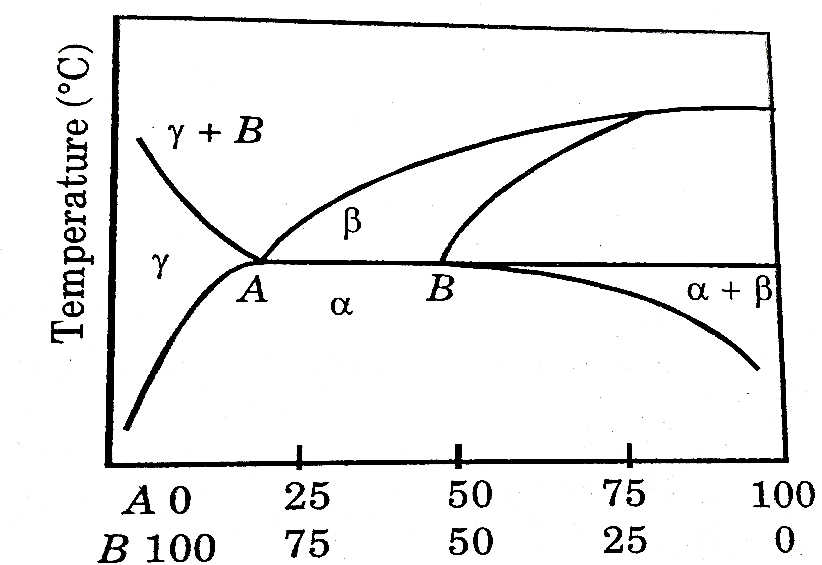
Figure 8: Peritectoid Phase Diagram
When two different solid phases change to a single solid phase, phase diagram is called peritectoid phase diagram and temperature and composition with respect to this peritectoid temperature and peritectoid composition.
Let there are two solid phases  which is in equilibrium with a single solid phase
  at point A. Point A is called peritectoid point.
In the given fig., at point A

Question 7: Explain Monotectic reaction.
A7: A liquid phase that transforms into a solid phase and anotherliquid phase is called as monotectic reaction.
Mathematically,
L1 →α(solid) + L2
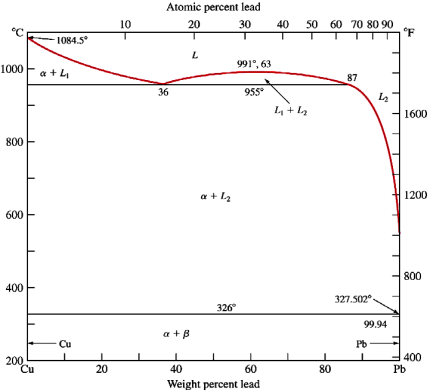
Figure: Binary Monotectic system diagram
Summary of Reactions:
Phases | Reaction |
Eutectic | Liquid →α + β |
Eutectoid | α→β + γ |
Peritectic | Liquid + α→β |
Peritectoid | α + β→γ |
Monotectic | L1 →α+ L2 |
Question 8: Explain Iron Carbide phase diagram.
A8: The iron-iron carbide (Fe-Fe3C) phase diagram:
In this Fe-C phase diagram, Carbon is an interstitial impurity in iron and soluble in iron.
There are different types of solid phases of iron-carbon solid solution.
At room temperature ferrite ( - iron) is stable it has a BCC crystal structure.
At temperature  ferrite transforms to austenite (
 .
.
Above the temperature  austenite transforms to a BCC crystal structure
  .
.  has a melting point
  .
.
Cementite (Fe3C) forms when solubility limit of carbon in α- ferrite is exceeded below  .
.
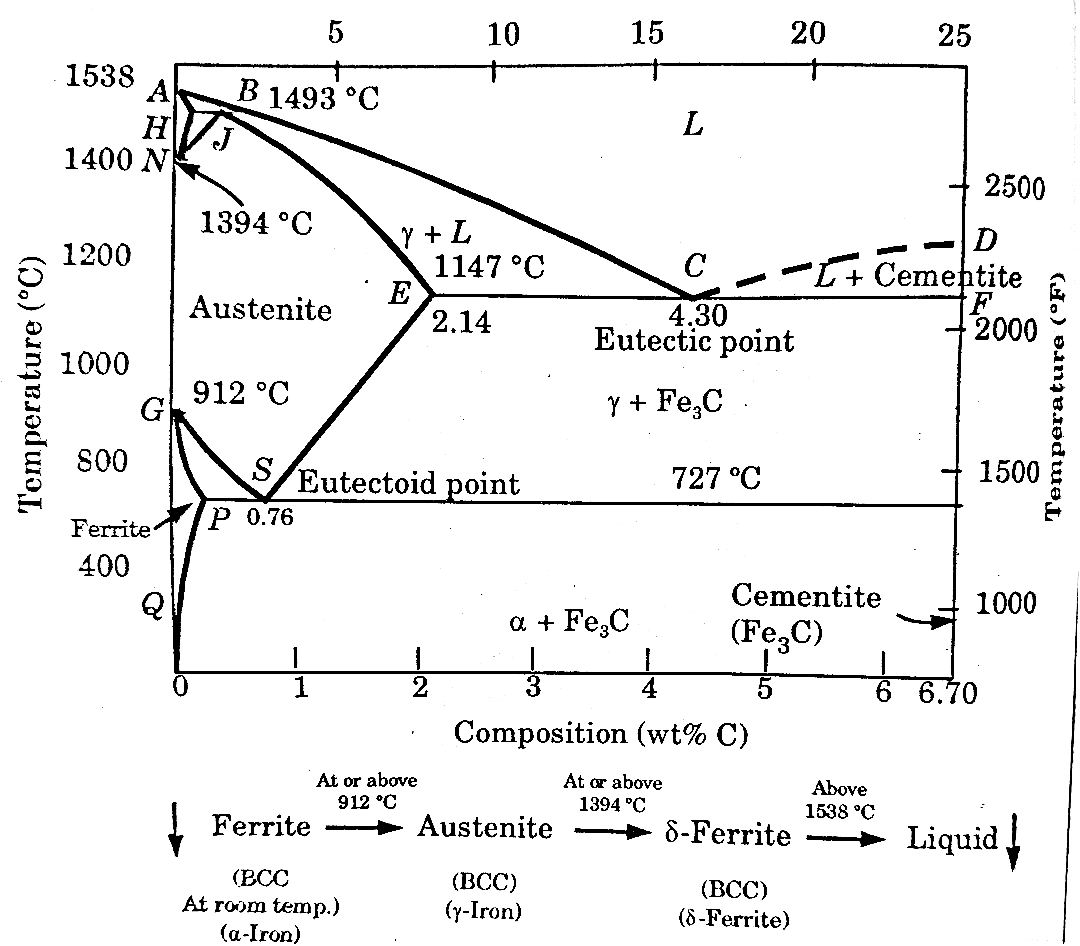
Figure: Fe-C phase diagram
Question 9: Mention the Eutectic point and Eutectoid point.
A9:
(i). Eutectic Point:
Eutectic point is shown in the phase diagram indicated as point C.
At point, Eutectic composition = 4.3% carbon
Eutectic temperature = 
There is an equilibrium state phase between liquid state (L) and two solid phases (

(i) Eutectoid Point:
Point S is indicated as Eutectoid point.
At point S, there is an equilibrium state between solid state and two solid phases ( ).
).
Eutectoid composition = 0.76% carbon

Question 10: Discuss the features of Iron-Carbide Diagram.
A10: Feature of the Fe-C Diagram:
The salient feature of the equilibrium diagram is as follows:
Iron-carbon equilibrium diagram concerns transformation that occurs in alloys having composition from pure iron to 6.67% carbon.
Point A is the highest melting point ( ) of pure iron and point Dis the melting point (approx.
  ) of the iron carbide having 6.67%C.
The line through A-B-C-D are liquidus lines and the lines through point A-H-J-E-C-F are the solidus lines. The lowest temperature for solidification is  , and it happens along the constant temperature line E-C-F.
The upper left-hand portion of the diagram represents the allotropic transformations at high temperature. Line H-J-B represents peritectic transformation that is taking place at room temperature  . The result of the peritectic reaction is the formation of the solid solution of carbon in gamma iron (austenite). This portion of the diagram is ignored generally, since it has not much practical importance.
When the alloy crosses, the liquid line A-B-C-D, solidification starts and complete along A-E-C-F. Austenite is precipitated along A-B-C and cementite along C-D.
At point C ( and 4.3% C) austenite and cementite are simultaneously precipitated from the liquid alloy to form eutectic cast iron called ledeburite. This formation obeys the rules of eutectic transformation.
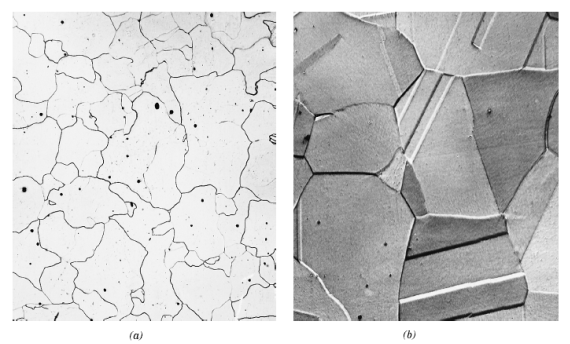
α- ferrite austenite
Figure: Microstructures of iron