Unit - 4
Stability
Q1) For the CLTF G(s) =  . Find Kp, Kv and Ka?
A1) Kp =  G(s)
G(s)
= 

= 1
Kv =  SG(s)
SG(s)
=  S
S 
= 0
Ka =  s2 G(s)
=  s2
s2 
= 0
Q2) For a unity feedback system G(s) =  an input t3u(t) is applied. Find the steady state error?
A2) ess= 

r(t) = t3u(t)
R(s) = 6/s4
H(s) =1
ess= 

= 
= 
= 5/3
Q3) Determine the type and order of the system G(s)= K/S(S+1)
G(S)= K(S+1)/S2(S+2)
A3) G(s)= K/S(S+1)
It is order 2 and type 1 system
G(S)= K(S+1)/S2(S+2)
It is order 3 and type 2 system
Q4) Derive position error coefficient?
A4) R(s)= Unit step
R(t) = u(t)
R(s) = 1/s
Ess =  s [ R(s)/1+G(s)]
=  s[ys/1+G(s)]
ess=  1+1/1+G(s)
=1/1+lt G(s) s- 0
Kp =  G(s)
G(s)
(Position error coefficient)
Q5) The block diagram of a system using PI controllers is shown in the figure 18 Calculate:
(a). The steady state without and with controller for unit step input?
(b). Determine TF of newly constructed sys. With controller so, that a CL Poles is located at -5?

Fig: Block diagram with PI controller
A5)
(a). Without:
C(S)/R(S) = 0.2/ (S + 1)
C(S) = R(S) 0.2/ (S + 1) + 0.2
For unit step
Ess = 1/1 + Kp
Kp = lt G(S)
S 0
= lt 0.2/(S + 1)
S 0
Kp = 0.2
Ess = 1/1.2 = 5/6 = 0.8
(b). With controller:
Gc(S) = Kp + Ki/S
G’(S) = Gc(S). G(S)
= ( Kp + Ki/S )0.2/ (S + 1)
= (KpS + Ki)0.2/S (S + 1)
Ess = 1/1 + Kp = 0
So, the value of ess is decreased.
(b). Given
Kpi/Kp = 0.1
G’(S) = (Kp + Ki/S) (0.2/S + 1)
= (KpS + Ki)0.2/S (S + 1)
As a pole is to be added so, we have to examine the CE,
1 + G’(S) = 0
1 + (Kp + Ki)0.2/S (S + 1) = 0
S2 + S + 0.2KpS + 0.2Ki = 0
S2 + (0.2Kp + 1) S + 0.2Ki = 0
Given,
Kpi = 0.1Ki
Kp = 10Ki
S2 + (2Ki + 1) S + 0.2Ki = 0
Pole at S = -5
25 + (2Ki + 1) (-5) + 0.2Ki = 0
-10Ki – 5 + 25 + 0.2Ki = 0
-9.8Ki = -20
Ki = 2.05
Kp = 10Ki
= 20.5
Now,
G’(S) = (KpS + Ki) (0.2)/S (S + 1)
= (20.5S + 2.05) (0.2)/S (S + 1)
G’(S) = 4.1S + 0.41/S (S + 1)
Q6) The block diagram of a system using Pd controller is shown, the PD is used to increase ξ to 0.8. Determine the T.F of controller?

Fig: Block diagram with PD controller
A6)
(1). Kp = 1
Without controller:
C(S)/R(S) = 16/S2 + 1.6S + 16
wn = 4
2 ξwn = 16
ξ = 1.6/2 x 4 = 0.2
(b). With derivative:
ξS = 0.2 to 0.8
Undamped to critically damped,
G’(S) = (1 + KdS)(16)/(S2 + 1.6S)
CE:
S2 + 1.6S + 16(1 + KdS) = 0
S2 + (1.6 + Kd)S + 16 = 0
2 ξwn = 1.6 + Kd1.6
wn = 4
ξS = 0.8
2 x 4 x 0.8 = 1.6 + Kd1.6
6.4 – 1.6 = Kd1.6
4.8/16 = Kd
Kd = 0.3
TF = (1 + 0.3S)16/S(S + 16)
Q7) Consider the following system
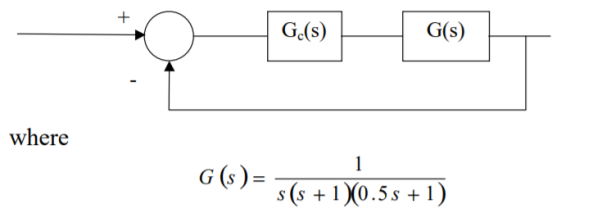
Performance requirements for the system:
Steady state: Kv =5
Transient response:
Phase margin > 40°
Gain margin > 10 dB
A7)
Analysis of the system with Gc(s) = K

For K = 5, the closed-loop system is unstable
Design of a lag compensator


1) 
2) Phase margin of the system 5G(s) is -13°, the closed-loop system is unstable. From the Bode diagram of 5G(jω) we obtain that the additional required phase margin of 40° + 12° = 52° is obtained at ω=0.5 rad/sec. The new gain crossover frequency will be: ωc = 0.5 rad/sec.
3) Place the zero of lag compensator at ω=1/T=0.1rad/sec.
4) The magnitude of 5G(jω) at the new gain crossover frequency ωc =0.5 rad/sec is 20 dB. In order to have ωc as the new gain crossover frequency, the lag compensator must give an attenuation of -20db at ωc.
5) Therefore - 20log  = - 20 dB,
  =10.
=10.
6) 
The Bode diagram is
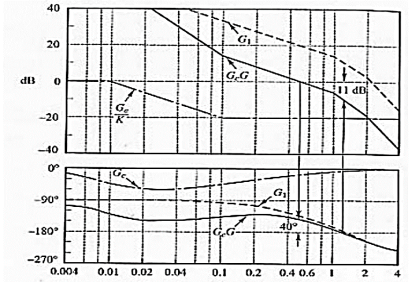
Bode diagrams for:
- G1(jω) = 5G(jω) (gain-adjusted KcβG(jω) open-loop transfer function)
- Gc(jω)/K = Gc(jω)/5 (compensator divided by gain Kcβ = 5)
- Gc(jω)G(jω) (compensated open-loop transfer function)
The effect of the lag compensator is:
- The original unstable closed-loop system is now stable.
- The phase margin 400 is acceptable transient response.
- The gain margin 11dB is acceptable transient response. Kv is 5 as required this is acceptable steady-state response.
- The gain at high frequencies has been decreased.
Q8) Given the control system
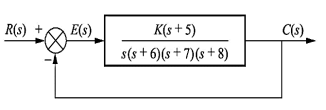
Find K such that there is a 10 percent error in steady state?
A8)
Since system type is 1 the finite steady state error should be for a ramp input.
e(∞) = 1/ Kv = 0.1

We obtain K = 672
Q9) Consider the System (with one integrator) in the following figure

The steady state error for r(t) = 5u(t) will be?
A9)
The steady state error for r(t) = 5u(t) will be

Q10) Consider the System (with one integrator) in the following figure

The steady state error for r(t) = 5tu(t) will be?
A10)
The steady state error for r(t) = 5tu(t) will be

Q11) Consider the System (with one integrator) in the following figure

The steady state error for r(t) = 5t2u(t) will be?
A11)
The steady state error for r(t) = 5t2u(t) will be

Q12) Consider the System (with no integrator) in the following figure

The steady state error for r(t) = 5u(t) will be?
A12)
The steady state error for r(t) = 5u(t) is

Q13) Consider the System (with no integrator) in the following figure

The steady state error for r(t) = 5tu(t) will be?
A13)
The steady state error for r(t) = 5tu(t) is

Q14) What is disturbance rejection in control system explain?
A14) Disturbances are unwanted signals entering into a feedback control system. A disturbance may act at the input or output of the plant. Here we consider the effect of input disturbance.
To characterize the effect of a disturbance input on the feedback control system, we consider the modified block diagram that includes a disturbance input.

Fig: Modified Block Diagram
Let r(t) denote a reference, and d(t) a disturbance input; then the system output is expressed in the Laplace domain as

Assuming unity-gain feedback configuration (H(s)=1) the tracking error, e(s), is computed as:

By using the Final Value Theorem, the steady-state error is expressed as:

Where Kp is the position error constant.
A large loop gain (large Kp) reduces steady-state error in the presence of both reference and disturbance inputs. A large controller gain, K, can be used to increase Kp, however, a large K would generate a large magnitude input signal to the plant, which may cause saturation in the actuator devices (amplifiers, mechanical actuators, etc.).
To analyse the control requirements for simultaneous tracking and disturbance rejection, we consider a unity-gain feedback control system (H(s)=1).
Let G(s)=n(s)d(s) represent the plant and K(s)=nC(s)dC(s) represent the controller; then, the output in the presence of reference and disturbance inputs is given as:

The characteristic polynomial is given as: Δ(s)=n(s)nc(s)+d(s)dc(s)
Asymptotic tracking. For asymptotic tracking, d(s)dc(s) should contain any unstable poles of r(s). For example, an integrator in the feedback loop ensures zero steady-state error to a constant reference input.
Disturbance Rejection. For disturbance rejection, n(s)dc(s) should contain any unstable poles of d(s). For example, a notch filter centered at 60 Hz removes power line noise from the measured signal.
Q15) How we meet the reduction of parameter variation by use of feedback?
A15)
The feedback systems are having many advantages over the non-feedback system as we have seen earlier. So, some performance parameters can be controlled through this feedback system such as sensitivity, noise etc. Sensitivity is a parameter which forecasts the effectiveness of feedback in reducing the influence of these variations on system performance. [Reference 4]
The output of the open loop system is given by
C(s) = G(s)R(s)
Now due to variation in parameters G(s) changes to [G(s)+ G(s)]. The output will now become
C(s)+ C(s) = [G(s)+
 G(s)] R(s)
 C(s) =
  G(s)R(s)
For closed loop system the output is given as
C(s) =  R(s)
R(s)
Now due to variation in parameters it becomes
C(s)+ C(s) =
 R(s)
R(s)
The above equation shows that if there is variation in parameters then G(s) is reduced by factor of 1+G(s)H(s). The variation in overall transfer function T(s) due to change in G(s) is defined as sensitivity.
Sensitivity = 
When there is small change in G(s) then sensitivity becomes

 : Sensitivity of T w.r.t G
For closed loop system the sensitivity will be
 =
=  x
x  =
= 
For open loop system
 = 1
= 1
As T=G
The sensitivity of T w.r.t H is given as
 =G [
=G [ ]
]  =
= 
The above equation shows that for large values of GH sensitivity of the feedback system w.r.t H approaches to unity.
Q16) Explain control system dynamics by use of feedback?
A16)
The dynamics of the system can be controlled by the feedback by adjusting the location of poles. In this section we will see how the location of poles effect the dynamics of the system.
Let us consider a system which has open loop transfer function of G(s) defined as
G(s) =  (1)
(1)
Let K =  /
/
 = 1/
= 1/
The poles for the above system lie at s= - and
and  =1/
=1/ is time constant.
The dc gain of the system is given by G(0) = K =  /
/
For closed loop system the transfer function is given by
 (2)
(2)
 =
= 
 =
=  /(1+K)
The above equation shows that due to feedback the system pole shifts from - to (–
to (– +K’). Due to this change the dynamic response of the system is also affected. For studying the dynamic response, we assume that the input to the system is an impulse.
r(t) =  (t)
(t)
And it can also be written as
R(s) = 1
Taking inverse Laplace transform of equation 1 we get
For open loop system
c(t) = K’
Taking inverse Laplace transform of equation 2 we get
For closed loop system
c(t) = K’
The system dynamic response decays in both the open system as well as closed loop system. The closed loop system time constant is  =
=  /(1+K) so its response decays faster than open loop system by factor of (1+K).
Q17) How the control of effect of disturbance signals by use of feedback is achieved?
A17)
The feedback helps to control the disturbances as they generate an error signal. The sfg for closed loop system is given by
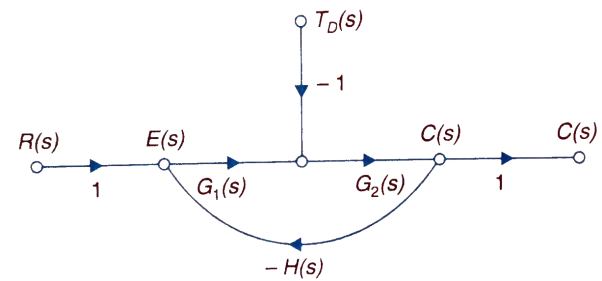
Fig: Closed loop system with disturbance signal
 =
= 
Where:
TD(s) = Disturbance signal.
For |G1G2H(s)|>>1 over the range of s
 =
=
The signal flow graph of a system with noise signal N(s) in the feedback path. The gain is given by
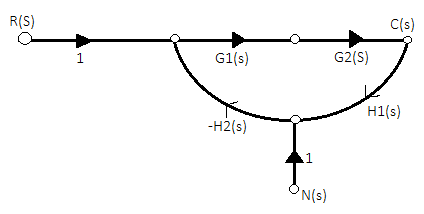
Fig: SFG for noise feedback function
 =
= 
For  >>1
>>1
Cn(s) = 
The feedback reduces sensitivity, improves transient response and minimises the effects of disturbance signal in control system.
Q18) Explain frequency domain design steps for lag compensator?
A18)
The transfer function of a phase-lag controller is given by

The corresponding magnitude and phase frequency diagrams for a phase-lag controller are presented in Figure
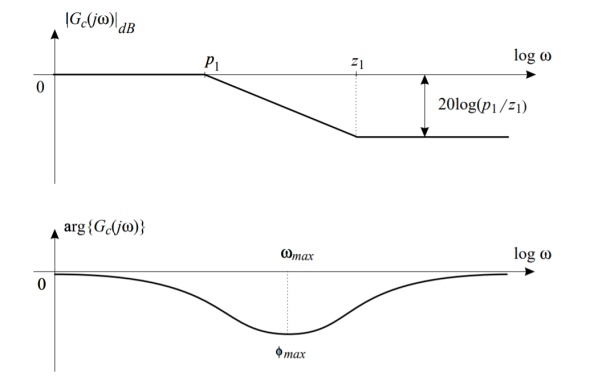
Fig: Magnitude approximation and exact phase of a phase-lag controller
Note that for the magnitude diagram it is sufficient to use only the straight line approximations for a complete understanding of the role of this controller. In general, straight line approximations can be used for almost all Bode magnitude diagrams in controller design problems. However, phase Bode diagrams are very sensitive to changes in frequency in the neighborhood of the corner frequencies, and so should be drawn as accurately as possible.
Due to attenuation of the phase-lag controller at high frequencies, the frequency bandwidth of the compensated system (controller and system in series) is reduced. Thus, the phase-lag controllers are used in order to decrease the system bandwidth (to slow down the system response). In addition, they can be used to improve the stability margins (phase and gain) while keeping the steady state errors constant.
Expressions for ωmax and ɸmax of a phase-lag controller will be derived in the next subsection in the context of the study of a phase-lead controller. As a matter of fact, both types of controllers have the same expressions for these two important design quantities.
Q19) Explain the methods for tuning of PID?
A19)
They proposed the rules for determining values of proportional gain kp, derivative time Td and integral time Ti. They have proposed from (1) methods.
1) First Method: The basic PID controller is shown in figure below. In this method a unit step response of a plant. Is obtained if the plant has neither integrator non-dominant complex conjugal poles, then the output step curve is of shape s. As shown below. These curves are generated experimentally.
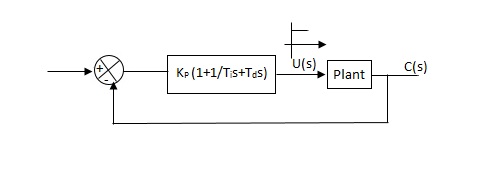
Fig: PID CONTROLLER
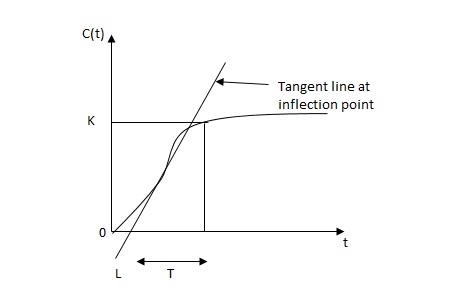
Fig: S-SHAPED RESPONSE CURVE

c(s) / l(s) = ke-l1s / ts+1
The values of KP, Ti and td should be set according to the table suggested by Ziegler Nichols tuning rules shown below.
Type of controller
Types of controller | Kp | Ti | Td |
|
P | T/L | 00 | 0 |
|
PI | 0.9T/L | L/0.3 | 0 |
|
PID | 1.2T/L | 2L | 0.5L |
|
Controller gain Gc(s)= kp(1+1/Tis+Tds)
= 1.2T / L (1+1 / 2LS+0.5 LS)
= 1.2t/l+0.6t / L2S+0.6TS
= 0.6T(2/L+1/L2S+S)
Gc(s) = 0.6 T(S+1/L)2/S
Thus, the PID controller has a pole at the origin and double zeros at S=-1/ L
Second Method -
1) Firstly, set Ti= and Td=0
2) use proportional control action only, increase kp from 0 to Kcr (Critical value).
3)then Kcr and pcr (period) are determined experimentally.

Fig: Closed loop with proportional controller
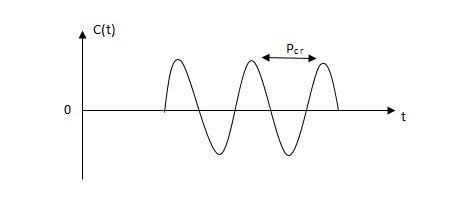
Fig: Sustained oscillation with period pcr.
4)For this method Ziegler Nichols suggested new set of values for kp, ti and td shown in table below.
Types of controller | KP | TI | Td |
P | 0.5Kcr |  | 0 |
PI | 0.45 KCR | 1/1.2PCR | 0 |
PID | 0.6KCR | 0.5PCR | 0.125PCR |
|
|
|
|
GC(S) = KP (1.1/Tis+Tds)
=0.6 Kcr(1+1/0.5PcrS+ 0.125 PCRS)
=0.075 KcrPcr(s+4/Pcr)2 / s
Thus, the PID controller has a pole at the origin and double zeros at s= -4/Pcr
Q20) List the difference between lead and lag compensator?
A20)
Phase Lead Network | Phase Lag Network |
1. It is used to improve the transient response. | 1. It is used to improve the Steady state response. |
2. It acts as a high pass filter. | 2. It acts as a low pass filter. |
3. The system becomes fast as Bandwidth increases as rise Time decreases. | 3. The Bandwidth decreases through rise time the speed is slow. |
4. As the circuit acts as differentiator, signal to noise ratio is poor. | 4. Signal to noise ratio is higher as it a acts as integrator. |
5. Maximum peak overshoot is reduced. | 5. It reduces steady state error thus |