Unit – 3
Node and Network Management
Q1) Write short notes on power management?
A1) Power managements
Because of the shortage of energy, the power consumption of a wireless sensor network (WSN) is a major concern. Although energy is a limited resource in all wireless devices, the problem is exacerbated in WSNs for the following reasons:
The issue of electricity consumption can be tackled from two different perspectives. One approach is to create energy-efficient communication protocols (self-organization, medium access, and routing protocols) that take into account the unique characteristics of WSNs. The other is to identify and limit the impact of inefficient and needless actions in the networks.
Wasteful and unneeded activities can be classified as local (restricted to a single node) or global (affecting multiple nodes) (having a scope network-wide). In any instance, these activities might be viewed as unintended consequences of inefficient software and hardware implementations (configurations).
Q2) Explain Local Power Management Aspects?
A2) Local power management aspects
Understanding how power is spent by the various subsystems of a wireless sensor node is the first step toward developing a local power management strategy. This knowledge allows for the avoidance of unnecessary activities and the prudent budgeting of financial resources. It also allows one to calculate the overall power dissipation rate in a node and how this rate affects the network's lifetime.
Processor Subsystem
Microcontrollers, such as Intel's StrongARM and Atmel's AVR, are used in the majority of existing processing subsystems. These microcontrollers can be set to work in a variety of power modes. Idle, ADC noise reduction, power save, power down, standby, and extended standby are just a few of the power modes available on the ATmega128L microcontroller. The CPU is turned off in idle mode, while the SRAM, Timer/Counters, SPI port, and interrupt system continue to work. Until the next interrupt or Hardware Reset, the power off mode saves the contents of the registers while freezing the oscillator and disables all other chip functions.
The asynchronous timer continues to run in power save mode, allowing the user to keep a timer basis while the rest of the device goes into sleep mode. Except for the asynchronous timer and the ADC, the CPU and all I/O modules are turned off in the ADC noise reduction mode. During ADC conversions, the goal is to reduce switching noise. A crystal/resonator oscillator runs in standby mode, while the remaining hardware components go to sleep. This enables a very quick start-up while also consuming extremely little power. Both the primary oscillator and the asynchronous timer continue to run in extended standby mode.
Communication Subsystem
The modulation type and index, the transmitter's power amplifier and antenna efficiency, the transmission range and rate, and the receiver's sensitivity all have an impact on the communication subsystem's power consumption. Some of these features can be changed on the fly.
The communication subsystem can also activate or deactivate the transmitter and receiver, or both. Even when the device is idle, a significant amount of quiescent current flows due to the existence of a large number of active components in the communication subsystem (amplifiers and oscillators). It's not easy to figure out which active state operational mode is the most efficient.
For example, just lowering the transmission rate or transmission power may not be enough to minimize a transmitter's power usage. The reason for this is because there is a tradeoff between the useful power necessary for data transmission and the heat generated by the power amplifier. When the transmission power is reduced, the dissipation power (heat energy) usually increases.
Bus Frequency and RAM Timing
When the CPU subsystem communicates with the other subsystems via the internal high-speed buses, it consumes power. The precise amount is determined by the communication's frequency and bandwidth. These two parameters can be optimized based on the sort of contact, however bus protocol timings are normally tailored for certain bus frequencies. Furthermore, to maintain optimal performance, bus controller drivers must be notified when bus frequencies change.
Active Memory
Electrical cells are arranged in rows and columns in the active memory, with each row containing a single memory bank. To save data, the batteries must be recharged on a regular basis. The refresh rate, often known as the refresh interval, is the number of rows that must be refreshed. A short refresh interval refers to the amount of time that must pass before a refresh operation is performed. A higher refresh interval, on the other hand, corresponds to a higher clock frequency that must elapse before a refresh operation can be performed. Consider the following two common values: 2K and 4K.
The smaller refresh interval refreshes more cells in a shorter period of time and completes the process faster, consuming more power than the 4K refresh rate. The 4K refresh rate refreshes fewer cells at a slower rate while using less energy.
One of the following power modes can be selected for a memory unit: Temperature-adjusted self-refresh, partial array self-refresh, or power down mode are all options. A memory unit's standard refresh rate can be modified based on its ambient temperature. As a result, temperature sensors are already built into some commercially available dynamic RAMs (DRAMs).
Apart from this, the self-refresh rate can be increased if the entire memory array is not needed to store data. The refresh operation can be restricted to the memory array portion where the data will be stored. This approach is known as the partial array self-refresh mode. If no actual data storage is required, the supply voltage of most or the entire on-board memory array can be switched off.
Power Subsystem
The power subsystem provides power to all of the other subsystems. A battery plus a DC–DC converter make up this device. In some cases, additional components, such as a voltage regulator, may be required. The DC–DC converter is responsible for providing the proper amount of supply power to each individual hardware component by converting the main DC supply voltage into a suitable level.
The transformation can be a step-down (buck), step-up (boost), or inversion (flyback) operation, depending on the needs of the respective subsystem. A transformation process, unfortunately, has its own power consumption and may be inefficient.
Q3) Describe Dynamic Power Management?
A3) Dynamic power management
Wireless sensor nodes can be created by taking into account the factors stated thus far during the design process. After the design time parameters have been set, a dynamic power management (DPM) approach tries to reduce the system's power usage by dynamically determining the most energy-efficient operating conditions.
This condition takes into account the application's requirements, the network's structure, and the task arrival rate of the various subsystems. While there are several methods to a DPM strategy, they may all be grouped into one of three categories:
1. Dynamic operation modes
2. Dynamic scaling
3. Energy harvesting
Dynamic Operation Modes
Depending on their current and predicted activity, the subsystems of a wireless sensor node can be designed to run in different power modes. A subcomponent can have n different power modes in general. A DPM strategy can define x n various power mode configurations,Pn, if there are x hardware components that can have n different power consumption levels.
Because of different restrictions and system stability preconditions, not all of these configurations are viable. As a result, the DPM strategy's goal is to find the best configuration for a wireless sensor node's activity.
However, there are two issues to consider while choosing a power setup.
Dynamic Scaling
The approach includes dynamic voltage scaling (DVS) and dynamic frequency scaling (DFS). These two approaches try to adapt the processor core's performance (as well as the memory unit and communication buses) while it is operating. In most circumstances, the tasks assigned to the processor core do not necessitate its maximum performance. Instead, some operations are done ahead of schedule, and the processor switches to a low-leakage idle mode for the remainder of the time.
Figure depicts a subsystem performing at its best. Despite the fact that the two jobs are completed ahead of schedule, the processor continues to operate at peak frequency and supply voltage, which is inefficient.

Fig 1: A processor subsystem operating at its peak performance
Task Scheduling
The DPM technique tries to estimate the amount of the biasing voltage (Vdd ) and the clock frequency of the processing subsystem autonomously in a dynamic voltage and frequency scaling. Several aspects influence the choice of voltage or frequency, including the application delay requirement and task arrival rate. These two factors should be modified in the ideal case so that a task is done "just in time." This prevents the processor from remaining idle and wasting power. However, because the workload of the CPU cannot be predicted in advance, the estimation is subject to inaccuracy, and idle cycles cannot be totally avoided.
Q4) Write about Conceptual Architecture?
A4) Conceptual Architecture
Three key challenges should be addressed in a conceptual design for supporting a DPM strategy in a wireless sensor node:
1. In attempting to optimize power consumption, how much is the extra workload that should be produced by the DPM itself?
2. Should the DPM be a centralized or a distributed strategy?
3. If it is a centralized approach, which of the subcomponents should be responsible for the task?
A typical DPM strategy monitors each subsystem's operations and makes recommendations about the best power configuration for reducing overall power usage. Nonetheless, this choice should be based on the application's requirements. Because this process consumes some energy, it can be justified if the amount of energy saved as a result is significant. Benchmarking is required for an accurate DPM method to estimate task arrival and processing rate.
Several factors influence whether a DPM strategy should be central or spread. One advantage of a centralized method is that obtaining a global view of a node's power usage and implementing an intelligible adaption strategy is easier.
A global plan, on the other hand, may impose a computational burden on the management subsystem. Individual subsystems are authorized to carry out local power management procedures in a distributed fashion, which scales effectively. In the event of a centralized approach, the primary question is which subsystem - the processor subsystem or the power subsystem – is in charge of the task.
The power subsystem, intuitively, should perform the management responsibility because it possesses complete information about the node's energy reserve and each subsystem's power budget. It does, however, require critical information from the processing subsystems, such as the task arrival rate and priority of specific tasks. The processor subsystem is typically at the center of most existing wireless sensor node topologies, and it is through it that all other subsystems connect with one another.
Architectural Overview
Though the goal of a DPM approach is to reduce a node's power consumption, it should not compromise the system's stability. In addition, the application's criteria for data quality and latency must be met. Fortunately, in the vast majority of real-world scenarios, a WSN is assigned to a specific duty. That task does not change, or simply changes slowly. As a result, the DPM designer has the architecture of the wireless sensor node, the application requirements, and the network topology at his or her disposal to build a viable strategy. Figure depicts the design environment.

Fig 2: Factors affecting a dynamic power management strategy
The hardware design of the system serves as the foundation for establishing numerous operating power modes and their transitions. The behavior of the power mode transition is described by rules defined by a local power management strategy in response to a change in the node's activity or a request from a global (network-wide) power management scheme or the application.
Figure depicts dynamic power management as a machine that changes states in response to various events - tasks are scheduled in a task queue, and the system's execution time and energy consumption are tracked.
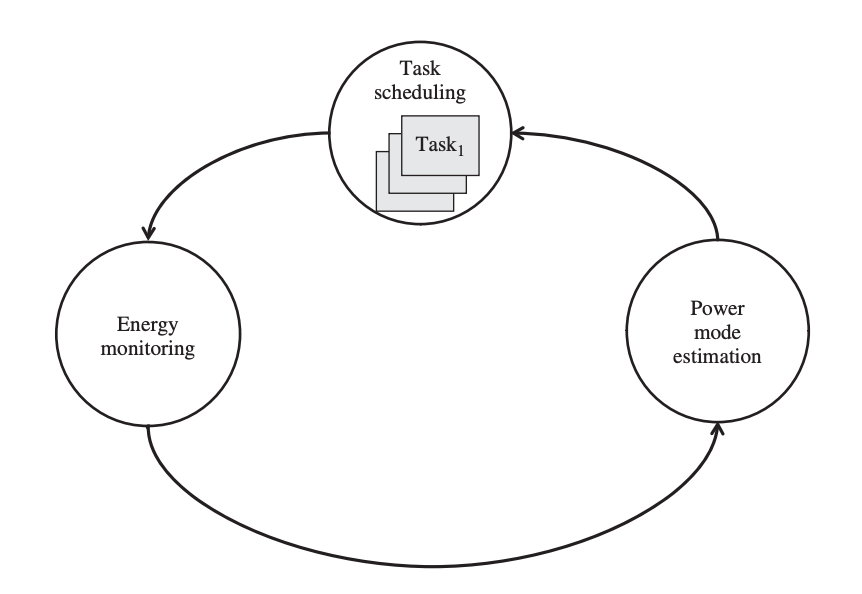
Fig 3: An abstract architecture for a dynamic power management strategy
A fresh power budget is estimated based on how quickly the activities are finished, and power modes are switched. In the event that the predicted power budget differs from the power mode that the system can support, the DPM strategy selects the higher degree of operational power mode.
Q5) Write short notes on time synchronization?
A5) Time Synchronization
Each node in a distributed system has its own clock and sense of time. However, to detect causal linkages between events in the physical environment, to allow the deletion of redundant sensor data, and to generally improve sensor network functioning, a consistent time scale among sensor nodes is necessary. The clock readings of distinct sensor nodes will differ because each node in a sensor network runs independently and relies on its own clock.
Aside from these random deviations (phase shifts), the gap between the clocks of different sensors will widen due to oscillator drift rates that vary. To ensure that sensing times can be compared in a meaningful way, time (or clock) synchronization is essential. While conventional network time synchronization solutions have garnered a lot of attention, wireless sensor time synchronization techniques are inappropriate due to the particular constraints that wireless sensing settings present.
Q6) What is Clocks and the Synchronization Problem?
A6) Clocks and the Synchronization Problem
All computing devices require computer clocks that are based on hardware oscillators. A conventional clock has a quartz-stabilized oscillator and a counter that decrements with each quartz crystal oscillation. The counter is reset to its original value when it hits 0 and an interrupt is generated.
Each interrupt (or clock tick) adds to a software clock (another counter) that may be read and utilized by applications with the right application programming interface (API). As a result, a sensor node's local time is provided by a software clock, where C(t) denotes the clock reading at some real-time t. The time resolution is the space between two software clock increments (ticks).
When two nodes' local timings are compared, the clock offset reveals the time difference. To alter the time of one or both of these clocks so that their readings match, synchronization is required. The clock rate is the pace at which a clock advances, while the clock skew is the difference between two clocks' frequencies. At all times, perfect clocks have a clock rate of dC/dt = 1, although numerous factors influence the actual clock rate, such as the environment's temperature and humidity, the supply voltage, and the quartz's age.
The drift rate, dC/dt 1, expresses the rate at which two clocks can drift apart as a result of this deviation. The maximum clock drift rate is given as, with common quartz-based clock values ranging from 1 ppm to 100 ppm (1 ppm = 10-6 ) This number is provided by the oscillator's manufacturer and ensures that the oscillator is in good working order.
1 − ρ ≤ dC/dt ≤ 1 + ρ
The clock reading is affected by the drift rate in relation to real time, resulting in either a perfect, fast, or sluggish clock. Even after clocks have been synced, this drift rate causes irregularities in sensor clock readings, necessitating the synchronization process to be repeated on a regular basis.
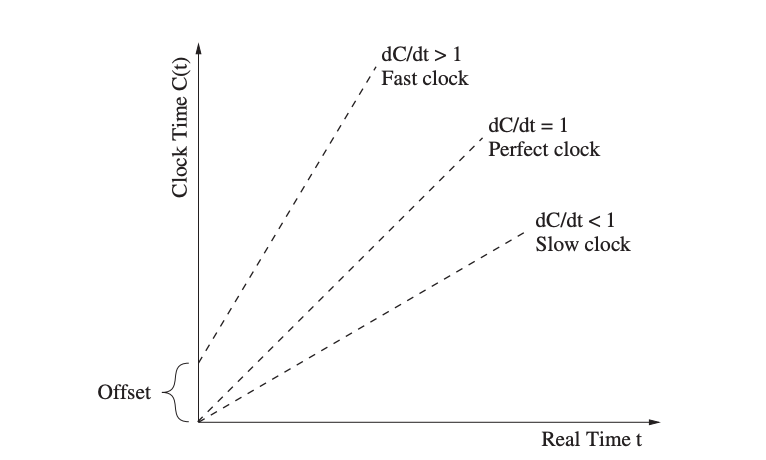
Fig 4: relationship between local time C(t) and real time t
Q7) Write about Time Synchronization in WSN?
A7) Time synchronization in WSN
Many applications and services in distributed systems, in general, require time synchronization. For both wired and wireless systems, numerous time synchronization protocols have been developed. For example, the Network Time Protocol (NTP) is a widely used, scalable, robust, and self-configurable synchronization technique. It has been shown to attain accuracy in the order of a few microseconds when used in conjunction with the Global Positioning System (GPS). However, because of the particular characteristics and limits of WSNs, techniques like NTP are ineffective.
Reasons for Time Synchronization
Sensors in a WSN track physical objects and report on activities and events to relevant parties. When a moving object (such as an automobile) passes by, proximity detecting sensors, such as magnetic, capacitive, or acoustic sensors, trigger an event. Multiple sensors in dense sensor networks will detect the same activity and cause such events.
As a result, it is critical that an observer can determine the correct logical order of events; for example, when the real times in Figure have the ordering t1 t2 t3, the sensor timestamps must reflect this order, i.e., the C1(t1)time difference between sensor time stamps should correspond to the real time difference, that is △ = C2(t2) − C1(t1) = t2 − t1.
This is a crucial prerequisite for data fusion in WSNs, which involves the aggregation of data from several sensors seeing the same or similar events. Additionally, data fusion aims to eliminate duplicate sensor data, reduce response times to crucial events, and reduce resource requirements (e.g., energy consumption)
In distributed systems in general, time synchronization is required for a range of applications and techniques, including communication protocols (e.g., at-most-once message delivery), security (e.g., to limit use of particular keys and to help to detect replayed messages in Kerberos-based authentication systems), data consistency (cache consistency and consistency of replicated data), and concurrency control (atomicity and mutual exclusion)
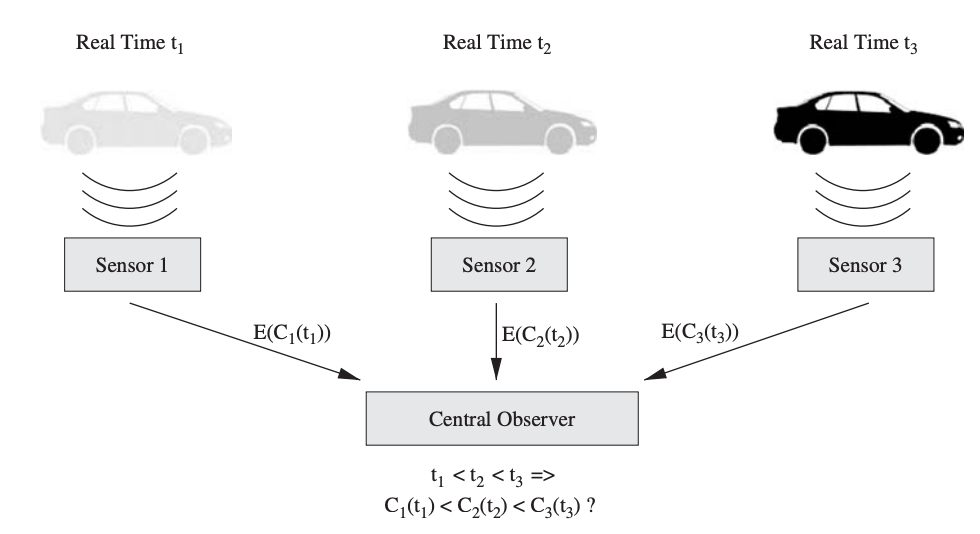
Fig 5: Detection of speed and direction of moving objects using multiple sensors
Q8) What are the Challenges for Time Synchronization?
A8) Challenges for Time Synchronization
Traditional time synchronization techniques were created for wired networks and do not take into account the issues that low-cost, low-power sensor nodes and the wireless media provide. Time synchronization in WSNs has issues similar to that in wired systems, such as clock glitches and changing clock drifts owing to temperature and humidity fluctuations.
Time synchronization algorithms for sensor networks, on the other hand, must take into account a number of additional obstacles and limits, some of which are addressed below)
● Environmental Effects
Temperature, pressure, and humidity variations can cause clocks to drift at different rates. While most connected computers are used in relatively stable surroundings (e.g., A/C-controlled cluster rooms or offices), wireless sensors are routinely used outdoors and in severe conditions where ambient property variations are prevalent.
● Energy Constraints
Finite power sources, such as disposable or rechargeable (e.g., via solar panels) batteries, are often used to power wireless sensor nodes. Battery replacement can dramatically increase the cost of a WSN, especially in large-scale networks and when nodes are located in difficult-to-service areas. To ensure long battery life, time synchronization techniques should not contribute significantly to the energy consumption of wireless nodes.
● Wireless Medium and Mobility
Because of variations in environmental variables caused by rain, fog, wind, and temperature, the wireless communication medium is known to be unpredictable and vulnerable to performance fluctuations. Wireless sensor nodes are subjected to network throughput restrictions, error rates, and wireless radio interference as a result of these variations. When wireless links are asymmetric, i.e., node A can receive node B's messages but node A's messages are too weak to be appropriately processed at node B, message exchanges between nodes might become even more troublesome.
● Additional Constraints
Aside from energy constraints, low-power and low-cost sensor nodes are frequently limited in terms of CPU speeds and memory, necessitating the use of lightweight time synchronization protocols. Because of the tiny size and low cost of sensor devices, substantial and expensive hardware is required to accomplish synchronization. As a result, time synchronization methods should be designed to work in resource-constrained contexts while adding little or no cost to a sensor device's overall cost.
Q9) What are the Basics of Time Synchronization?
A9) Time synchronization
Sensor node synchronization is usually based on some type of message exchange. Multiple devices can be synced simultaneously with a small amount of messages if the medium enables broadcast (as it does in wireless networks).
Synchronization Messages
The majority of extant time synchronization protocols are based on pairwise synchronization, in which two nodes use at least one synchronization message to synchronize their clocks. Repeat this process among several node pairs until every node in the network has been able to modify its clock, resulting in network-wide synchronization.
● One-Way Message Exchange
The most basic kind of pairwise synchronization happens when only one message is used to synchronize two nodes, i.e., one node transmits a time stamp to another node, as shown in Figure's left graph. At time t1, node I sends a synchronization message to node j, with t1 as a timestamp embedded in the message. Node j gets a timestamp t2 from its own local clock when it receives this message. The clock offset (between the clocks of nodes I and j) δ is indicated by the difference between the two timestamps. The difference between the two times is more precisely represented as:
(t2 − t1) = D + δ
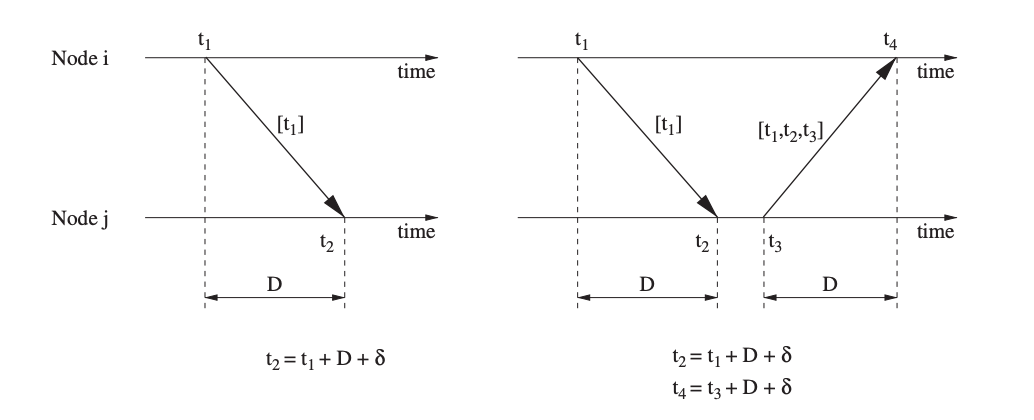
Fig 6: concept of pairwise synchronization
where D is the propagation time, which is unknown. Propagation times in the wireless medium are extremely brief (a few microseconds) and are frequently overlooked or thought to be constant.
● Two-Way Message Exchange
Using two synchronization messages, as illustrated in the right graph of Figure, is a somewhat more accurate approach. Node j responds by sending a message with time stamps t1, t2, and t3 at time t3. Both nodes are able to compute the clock offset after receiving this second message at time t4, assuming a fixed propagation delay. Node I on the other hand, can now determine the propagation delay and offset with more accuracy

This assumes that the propagation delay is the same in both directions and that the clock drift remains constant between observations (which is feasible because of the brief time span). While only node I has enough information to calculate the offset, node I can send node j the offset value in a third message.
● Receiver–Receiver Synchronization
Protocols that use the receiver–receiver synchronization concept, in which synchronization is based on the time at which the same message arrives at each receiver, adopt a different approach. This is in contrast to most synchronization techniques' more typical sender–receiver approach.
These receivers get the message at around the same time in broadcast situations, and then exchange their arrival times to compute an offset (i.e., the difference in reception times indicates the offset of their clocks). This method is illustrated in the diagram. Three messages are required to synchronize two receivers if there are two receivers.
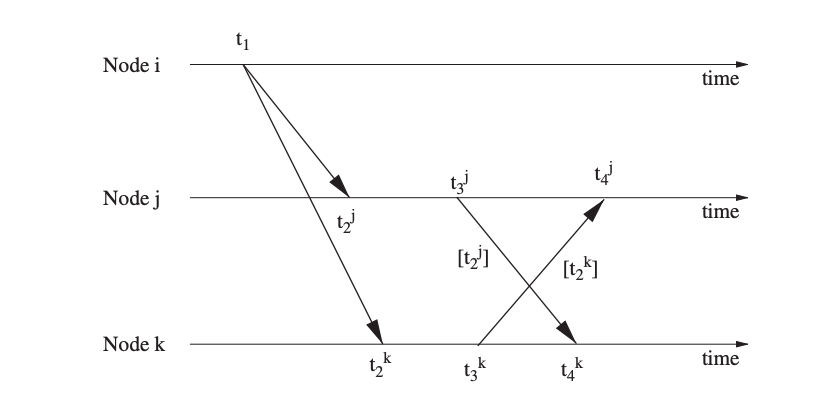
Fig 7: Receiver–receiver synchronization scheme
Nondeterminism of Communication Latency
The communication latency's nondeterminism contributes greatly to the precision that can be obtained. As indicated in Figure, the latency suffered by synchronization messages is the sum of multiple components.
● Send delay: This is the time it took the sender to generate and send the synchronization message to the network interface. This comprises delays induced by the network protocol stack, the network device driver, and operating system behavior (system call interface, context shifts).
● Access delay: This is the time it takes for the sender to access the physical channel, and it is mostly governed by the MAC protocol in use. Prior to allowing access, contention-based protocols like IEEE 802.11's CSMA/CA must wait for an empty channel. Collisions occur when numerous devices access the channel at the same time, causing additional delays (e.g., through the exponential backoff mechanism used in many MAC protocols).
● Propagation delay: Propagation delay is the time it takes for a message to travel from the transmitter to the receiver. Propagation delays are very tiny when nodes share the same physical medium, and they are frequently insignificant in critical path analysis.
● Receive delay: This is the time it takes for the receiver device to receive the message from the medium, process it, and tell the host that the message has arrived. Typically, hosts are notified by interrupts, which allow the local time (i.e., the message arrival time) to be read. As a result, the receive time is typically substantially shorter than the send time.
Q10) Describe Time Synchronization Protocols?
A10) Time synchronization Protocols
There have been numerous time synchronization protocols created for WSNs, the majority of which are based on some form of message exchange ideas. We've put up a list of some of the most common schemes and protocols.
Reference Broadcasts Using Global Sources of Time
The Global Positioning System (GPS) broadcasts time measured from a starting epoch of 0h 6 January 1980 UTC on a continuous basis. Unlike UTC, however, GPS is not affected by leap seconds and is hence an integer number of seconds ahead of UTC. Even low-cost GPS receivers can get GPS time with a 200-ns precision.
Time signals are also broadcast on terrestrial radio stations; for example, the National Institute of Standards and Technology broadcasts time based on atomic clocks on radio stations WWV/WWVH and WWVB. GPS, for example, is not widely available underwater, indoors, under dense foliage, during Mars exploration) and requires a high-power receiver, which may be prohibitive for small, low-cost sensor nodes.
Lightweight Tree-Based Synchronization
The Lightweight Tree-Based Synchronization (LTS) protocol's primary purpose is to deliver a set precision (rather than a maximum precision) with the least amount of overhead as possible. For both controlled and decentralized multi-hop synchronization, LTS can be utilized with a variety of algorithms.
Consider the message exchange for the synchronization of a pair of nodes to better grasp LTS's method. This technique is depicted graphically in Figure. To begin, node j sends a synchronization message to node k that is time stamped with the transmission time t1. Node k responds with a message with a time stamp t3 and the previously recorded times t1 and t2 when this message arrives at time t2. At time t4, node j receives this message.

Fig 8: Pairwise synchronization with LTS
Timing-sync Protocol for Sensor Networks
Another conventional sender–receiver synchronization solution that employs a tree to arrange a network is the Timing-sync Protocol for Sensor Networks (TPSN). The level discovery phase (performed during network deployment) and the synchronization phase are the two stages used by TPSN for synchronization.
● Level Discovery Phase
The purpose of this phase is to establish a hierarchical network topology in which each node is assigned a level, with level 0 being the root node (e.g., a GPS-equipped gateway to the outside world). This phase is started by the root node broadcasting a level discovery message that contains the level as well as the sender's unique identification.
This message is used by every immediate neighbor of the root node to identify its own level (level 1) and rebroadcasts the level discovery message with its own identity and level. This process is continued until every node in the network has figured out what level it belongs to. Once a node has established its level in the hierarchical structure, it simply discards multiple broadcasts from its neighbors. When MAC-layer collisions prevent a node from getting a level discovery message, or when a node enters a network that has already completed its level discovery phase, situations may arise where nodes do not have an assigned level.
● Synchronization Phase
TPSN uses pairwise synchronization along the edges of the hierarchical structure formed in the previous phase during the synchronization phase, which means that each I level node synchronizes its clock with nodes on level i – 1. The mechanism used by TPSN for pairwise synchronization is similar to that used by LTS. At time t1, node j sends out a synchronization pulse comprising the node's level and a time stamp. Node k receives this message at time t2, and node k answers with an acknowledgment at time t3 (with time stamps t1, t2, and node k's level). Finally, at time t4, node j receives this packet.

Flooding Time Synchronization Protocol
The Flooding Time Synchronization Protocol (FTSP) aims to provide network-wide synchronization with microsecond-level errors, scalability to hundreds of nodes, and robustness to changes in network topology, such as link and node failures. FTSP differs from other systems in that it employs a single broadcast to create synchronization points between the sender and receivers while removing the majority of synchronization fault sources.
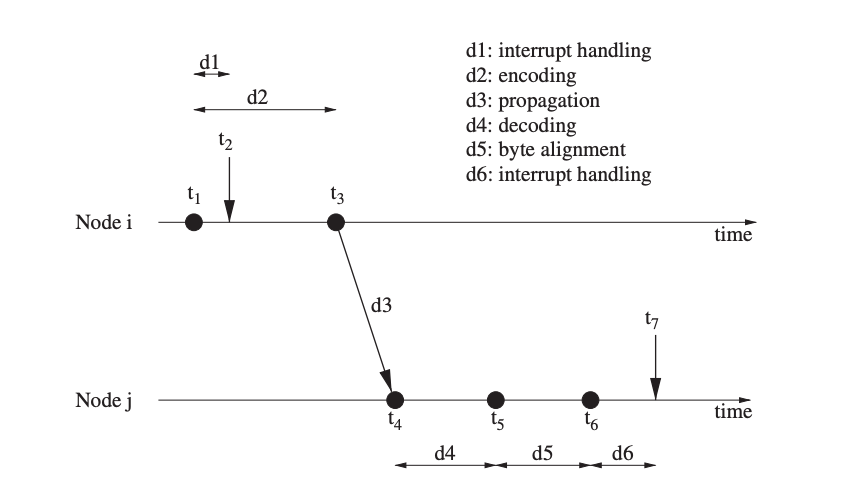
Fig 9: end to end delay of synchronization of message
FTSP does this by expanding on the delay analysis and decomposing the end-to-end delay into the components depicted in Figure. In this case, the sensor node's wireless radio sends an interrupt to the CPU at time t1 to indicate that it is ready to accept the next piece of the message to be delivered. At time t2, the CPU generates a time stamp after interrupt handling time d1.
Encoding time d2 is the time it takes the radio to encode and turn a chunk of a message into electromagnetic waves (between t1 and t3). The decoding time d4 is followed by the propagation delay (between t3 on node j's clock and t4 on node k's clock) (between t4 and t5). This is the amount of time it takes the radio to convert the message from electromagnetic waves to binary data.
Reference-Broadcast Synchronization
To synchronize a group of receivers, the Reference-Broadcast Synchronization (RBS) protocol uses broadcast messages between them. Broadcast messages will arrive at numerous receivers at roughly the same time through the wireless medium. The propagation delays and the time required by receivers to receive and process the incoming broadcast message will determine the variability in message delay.
The strength of RBS is that it eliminates the sender's nondeterministic synchronization faults. The nondeterministic delays experienced by these messages limit the granularity of time synchronization that may be achieved because all synchronization methods are predicated on some sort of message exchange
Time-Diffusion Synchronization Protocol
The Time-Diffusion Synchronization (TDP) protocol enables a sensor network to achieve an equilibrium time, in which nodes agree on a network-wide time and keep their clocks within a modest defined deviation from that time. The network's nodes use two sorts of elected roles to dynamically organise themselves into a tree-like configuration: master nodes and dispersed leader nodes.
TDP's Time Diffusion Procedure (TP) is in charge of diffusing timing information messages from master nodes to surrounding nodes, some of which become diffused leader nodes responsible for spreading the master nodes' signals farther. TDP has two stages of operation: active and passive. In the active phase, master nodes are elected every second (based on an Election/Reelection Procedure or ERP) to ensure that the workload in the network is balanced and the network can agree on an equilibrium time.
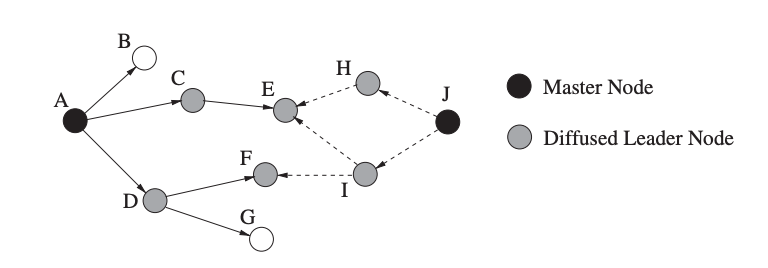
Fig 10: Concept of synchronization with TDP (with n = 2 for both masters)
Mini-Sync and Tiny-Sync
Mini-sync and Tiny-sync, two closely related protocols, enable pairwise synchronization with low bandwidth, storage, and processing requirements (that can be used as basic building blocks to synchronize an entire sensor network). In a sensor network, the relationship between the clocks of two nodes can be stated as:
C1(t) = a12C2(t) + b12
where a12 denotes relative drift and b12 denotes the relative offset between nodes 1 and 2. Nodes can utilize the two-way messaging technique to determine this relationship. Node 1 transmits a time-stamped probe message to node 2 at time t0, and node 2 immediately responds with a time-stamped reply message at time t1. The arrival time of the second message (t2) is recorded by Node 1 to create a 3-tuple of time stamps (t0, t1, t2), which is referred to as a data point. The following inequalities should hold since t0 occurred before t1 and t1 occurred before t2:
t0 < a12t1 + b12
t2 > a12t1 + b12
This operation is repeated several times, yielding a sequence of data points as well as additional limitations on the permissible values of a12 and b12 (thereby increasing the precision of the algorithms).
Q11) Write about localizations?
A11) Localization
Wireless sensor networks are frequently deployed ad hoc, which means that their position is unknown ahead of time. Sensor readings without knowledge of the location where they were collected are worthless in many applications, such as environmental monitoring.
Localization is required to provide a physical context to sensor results. Services like intrusion detection, inventory and supply chain management, and surveillance all require location information. Finally, sensor network services that rely on sensor position knowledge, such as geographic routing and coverage area management, require localization.
A sensor node's location might be described as a global or relative metric. The GPS (longitudes and latitudes) and Universal Transverse Mercator (UTM) coordinate systems, for example, employ a global metric to place nodes within a generic global reference frame (zones and latitude bands).
Range measurements, or estimates of distances between many sensor nodes, are used in a vast number of localization techniques (including many anchor-based procedures).
Q12) What is Ranging Techniques?
A12) Ranging Technique
The estimation of the physical distance between two sensor nodes is the cornerstone of many localization algorithms. Measurements of specific features of the signals exchanged between the sensors, such as signal propagation times, signal intensities, or angle of arrival, are used to make estimates.
Time of Arrival
The time of arrival (ToA) method (also known as the time of flight method) works on the premise that the distance between a signal's sender and receiver can be calculated using the measured signal propagation time and known signal velocity. Sound waves, for example, travel about 343 m/s in 20°C, which means that a sound signal travels a distance of 10 m in around 30 ms.
A radio transmission, on the other hand, travels at the speed of light (about 300 km/s), requiring just around 30 nanoseconds to travel 10 meters. As a result, radio-based distance measurements necessitate high-resolution clocks, increasing the cost and complexity of a sensor network. The one-way time of arrival method estimates the one-way propagation time, or the difference between the transmitting and signal arrival times (figure (a)), and necessitates extremely precise synchronization of the sender and receiver clocks.
As a result, the two-way time of arrival method (Figure (b)), which measures the round-trip time of a signal at the sender device, is favored. In summary, the distance between two nodes I and j can be calculated as follows for one-way measurements:
distij = (t2 − t1) × v
where t1 and t2 denote the signal's transmitting and receiving timings (measured at the sender and receiver, respectively), and v denotes the signal's velocity. The distance is estimated in the same way for the two-way approach:

The answer signal's sending and receiving times are t3 and t4, respectively. The receiver node calculates its location in one-way localization, whereas the sender node determines the receiver's location in two-way localization.

Fig 11: Comparison of different ranging schemes (one-way ToA, two-way ToA, and TDoA)
Time Difference of Arrival
The time difference of arrival (TDoA) method employs two signals traveling at different speeds in the figure. Similar to the ToA technique, the receiver can then determine its location. The initial signal may, for example, be a radio signal (sent at t1 and received at t2), followed by an acoustic signal (either immediately or after a defined time interval twait = t3 t1) As a result, the receiver can calculate the distance as follows:
dist = (v1 − v2) × (t4 − t2 − twait)
TDoA-based methods do not require the sender and receiver clocks to be synchronized and can provide extremely accurate readings. The TDoA solution has the drawback of requiring additional gear, such as a microphone and speaker in the case above.
Another form of this method employs many receivers with known locations to estimate the sender's location using TDoA measurements of a single signal. The signal to receiver I propagation delay di is determined by the distance between sender and receiver i.

Fig 12: ToA, and TDoA with different velocity
Angle of Arrival
Another method for determining localization is to employ an array of antennas or microphones to detect the direction of signal transmission. The angle of arrival (AoA) is the angle formed by the propagation direction and some orientation reference direction. For acoustic measurements, for example, a single signal is received by numerous spatially dispersed microphones, and the changes in arrival time, amplitude, or phase are used to estimate the arrival angle, which can then be used to infer the position of a node.
Received Signal Strength
The received signal strength (RSS) technique is based on the idea that a signal decays with distance traveled. A received signal strength indicator (RSSI) is a common feature in wireless devices that may be used to measure the loudness of an incoming radio signal.
Many wireless network card drivers can export RSSI values, however the significance of these values varies by vendor, and there is no set relationship between RSSI values and signal power levels. RSSI values typically vary from 0 to RSSI Max, with the most frequent RSSI Max values being 100, 128, and 256. The RSS decreases with the cube of the distance from the sender in open space. The Friis transmission equation, in further detail, expresses the ratio of received power Pr to transmission power Pt as:

where Gt is the transmitting antenna's antenna gain and Gr is the receiving antenna's antenna gain. In practice, attenuation is affected by multipath propagation effects, reflections, noise, and other factors; thus, a more realistic model replaces R2 in Equation with Rn, where n is usually between 3 and 5.
Q13) Define Range-Based Localization?
A13) Range based localization
Triangulation
Triangulation is a method of estimating sensor locations based on the geometric features of triangles. Triangulation is based on the collection of angle (or bearing) data. To establish the location of a sensor node in two-dimensional space, a minimum of two bearing lines (and the locations of the anchor nodes or the distance between them) are required.
The notion of triangulation is demonstrated using three anchor nodes with known locations (xi, yi) and measured angles I (expressed relative to a fixed baseline in the coordinate system). The existence of noise in the measurements may prevent more than two bearings from meeting in a single spot if more than two are measured. To achieve a single location, statistical algorithms or fixing procedures have been devised.
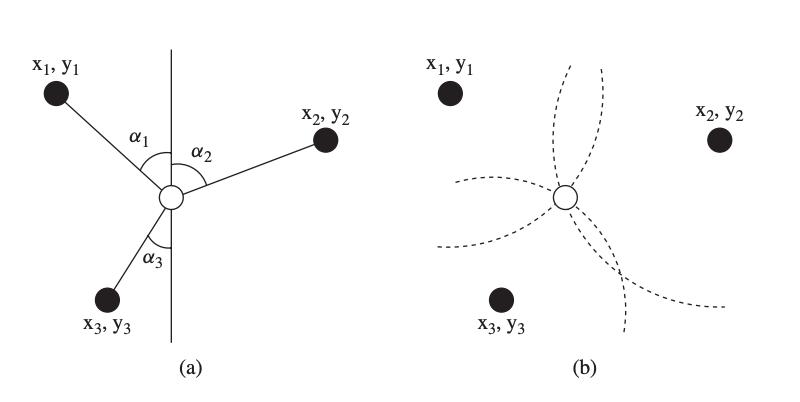
Fig 13: Triangulation (a)
Trilateration
The method of estimating a node's position based on measured distances between itself and a number of anchor points with known positions is known as trilateration. The sensor must be positioned anywhere within the circumference of a circle centered at the anchor's position with a radius equal to the sensor–anchor distance, given the location of an anchor and the sensor's distance to the anchor (e.g., calculated by RSS data). To get a unique position in two-dimensional space, distance measurements from at least three noncollinear anchors are necessary (i.e., the intersection of three circles).
An example of the two-dimensional scenario is shown in Figure (b). Distance measurements to at least four noncoplanar anchors are necessary in three dimensions.
Assume that the distances between an unknown sensor position x = (x, y) and these anchor nodes are known (ri, I = 1...n) and that the locations of n anchor nodes are supplied as xi = (xi, yi) I = 1...n). This data is used to create a matrix that depicts the relationships between anchor/sensor positions and distances:
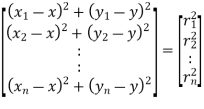
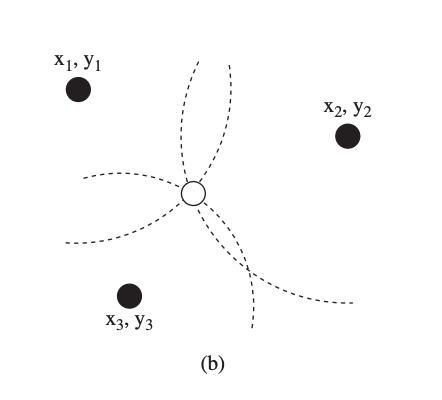
Fig 14: trilateration (b)
Iterative and Collaborative Multilateration
While the lateration technique requires the presence of at least three anchor nodes to locate a fourth unknown node, it can be expanded to detect the locations of nodes that do not have three anchor nodes nearby. When a node uses the beacon messages from the anchor nodes to determine its position, it becomes an anchor and sends beacon messages with its estimated position to other nearby nodes. This repeated multilateration procedure continues until all nodes in a network are located.
The gray node estimates its location with the help of the three black anchor nodes in the first iteration, and the white nodes estimate their respective locations with the help of two original anchor nodes and the gray node in the second iteration. The disadvantage of iterative multilateration is that with each iteration, the localization error increases.
Figure (b) illustrates a simple example with six nodes: four anchor nodes Ai (black) and two unknown nodes Si (white). Collaborative multilateration aims to create a graph of participating nodes, which are anchors or have at least three participating neighbors.

Fig 15: (a) Iterative multilateration and (b) collaborative multilateration
GPS-Based Localization
The most well-known location-sensing system is the Global Positioning System (GPS), which provides an excellent lateration framework for establishing geographic positions. The only fully working global navigation satellite system (GNSS), GPS (formerly known as NAVSTAR – Navigation Satellite Timing and Ranging), consists of at least 24 satellites orbiting the planet at altitudes of around 11,000 miles.
It began as a pilot program in 1973 and was completed in 1995. Meanwhile, GPS has become a widely used tool for civilian navigation, surveying, monitoring and surveillance, and scientific purposes. There are two degrees of service provided by GPS)
The GPS satellites are evenly dispersed throughout six orbits (four satellites per orbit) and circle the earth twice a day at a speed of about 7000 miles per hour. Because of the number of satellites and their spatial distribution, at least eight may be seen at the same time from practically anywhere on the earth. Each satellite transmits coded radio waves (known as pseudo random code) that contain information about the satellite's identity, location, status (i.e., whether it is functioning properly), and the date and time a signal was delivered.
Q14) Explain Range-Free Localization?
A14) Range free localization
The range-based localization algorithms (RSS, ToA, TDoA, and AoA) are based on distance estimations using ranging techniques and hence belong to the class of range-based localization algorithms. Range-free approaches, on the other hand, estimate node positions based on connectivity information rather than distance or angle measurements. Range-free localization techniques do not require any additional hardware and are thus a more cost-effective option than range-based methods.
Ad Hoc Positioning System (APS)
APS is a distributed connectivity-based localization algorithm that predicts node locations with the help of at least three anchor nodes, with the number of anchors being increased to reduce localization errors. The notion of distance vector (DV) exchange, in which nodes in a network periodically exchange their routing tables with their one-hop neighbors, is used by each anchor node to propagate its location to all other nodes in the network.
Each node in the most basic APS scheme, known as DV-hop, keeps a table Xi, Yi, hi, where Xi, Yi is the location of node I and hi is the hop distance between this node and node i. When an anchor gets distances from other anchors, it calculates an average hop size (called the correction factor), which is then spread throughout the network. Anchor i's correction factor ci is calculated as follows:

for all landmarks j (i = j). Given the locations of the anchors and the correction factor, a node is then able to perform trilateration to estimate its own location.
Approximate Point in Triangulation
The Approximate Point in Triangulation (APIT) method is a range-free localization methodology that uses an area-based approach. APIT, like APS, relies on the presence of many anchor nodes that are aware of their own location (e.g., via GPS).
A triangle zone is formed by any three anchors, and a node's existence inside or outside one allows it to reduce down its probable positions. The Point In Triangulation (PIT) test, which allows a node to establish the set of triangles within which it lies, is a critical step in APIT localization.
A node M examines all possible triangles created by a set of anchors after receiving location messages from them. If there is a vector in which a point adjacent to M is either further or closer to all points A, B, and C at the same time, the node is outside the triangle ABC formed by anchors A, B, and C.
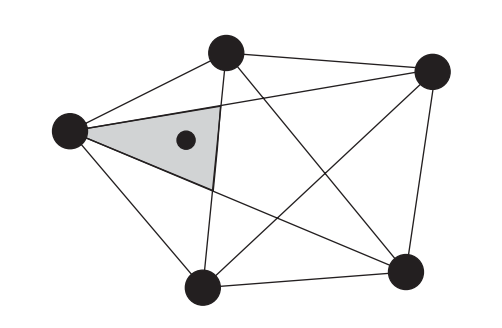
Fig 16: Location estimation based on the intersection of anchor triangles
Localization Based on Multidimensional Scaling
Multidimensional scaling (MDS) is a set of data analysis tools that displays the structure of distance-like data as a geometrical picture. It has its roots in psychometrics and psychophysics. MDS can be employed in centralized localization systems, in which a powerful central device (e.g., a base station) collects network information, calculates node locations, and propagates that information back into the network. The network is represented as an undirected graph with n nodes (m < n of which are anchors with known positions) and edges that denote connectedness.
The purpose of MDS is to maintain the distance information so that the network may be reconstructed in multidimensional space given the distances between all pairs of nodes. The original network structure will be arbitrarily rotated and flipped as a result of MDS.
While MDS comes in numerous forms, the most basic (known as classical MDS) provides a closed form solution that allows for quick implementation. Assume the following matrix of squared distances between nodes:
D2 = c1’ + 1c’ − 2SS’
where 1 is an n × 1 vector of ones, S is the similarity matrix for n points, where each row represents the coordinates of point i along m coordinates, SS’ is called the scalar product matrix, and c is a vector consisting of the diagonal elements of the scalar product matrix.
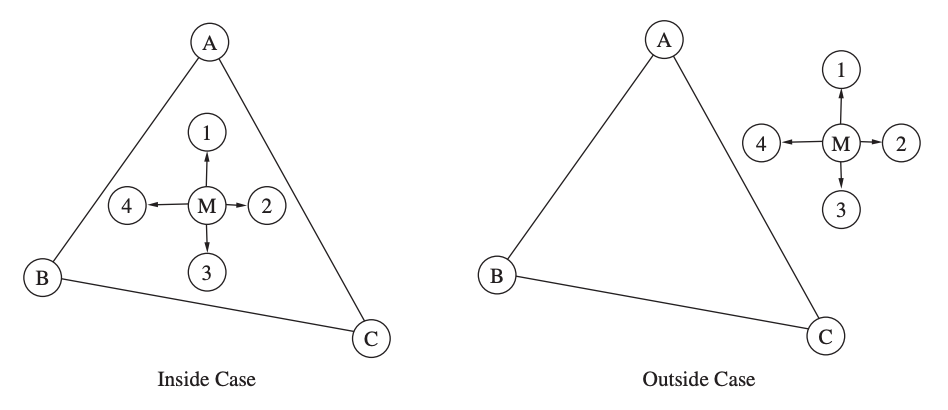
Fig 17: Examples of APIT test scenarios
Q15) Explain Event-Driven Localization?
A15) Event - Driven localization
The Lighthouse Approach
A third type of localization technique is one that is based on events that can be used to compute distances, angles, and locations. Arrival of radio waves, laser beams, or audio signals at a sensor node are examples of such events. Sensor nodes in the lighthouse location system may determine their location with high accuracy without the usage of any extra infrastructure components other than a base station with a light emitter. The concept is illustrated using an idealistic light source with the condition that the output light beam is parallel, i.e. the width b remains constant.
The light source rotates, and when a parallel beam passes by a sensor, the sensor will perceive a flash of light for a set amount of time. This concept's main notion is that tbeam fluctuates depending on the distance between the sensor and the light source (since the beam is parallel). The sensor's distance from the light source, d, can be represented as

where α expresses the angle under which the sensor sees the beam of light as follows:

The time it takes the light source to complete a full rotation is denoted by tturn. While b is known and constant, a sensor can calculate tbeam = t2 t1 and tturn = t3 t1, where t1 is the first time the sensor sees the light, t2 is when the sensor no longer sees the light, and t3 is when the sensor sees the light for the second time.
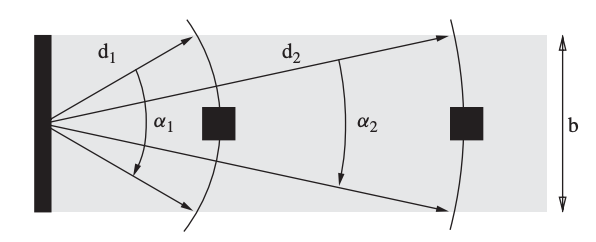
Fig 18: The lighthouse localization approach (top view)
Multi-Sequence Positioning
The Multi-Sequence Positioning (MSP) method extracts relative location information from a number of basic one-dimensional sensor node orderings. Figure displays a tiny sensor network with five unknown nodes and two anchor nodes, for example. At different locations, event generators generate events one at a time (e.g., ultrasound propagations or laser scans with diverse angles).
Depending on their distance from the event generators, the nodes in the sensor field observe these events at different times. Based on the sequential detection of the event, we may build a node sequence, that is, a node ordering (containing both the sensor and the anchor nodes) for each event.
Then, using a multi sequence processing approach, the probable locations for each node are narrowed down to a limited area, and the actual positions are estimated using a distribution-based estimating method.
The MSP algorithm's core principle is to divide a sensor network into small pieces by processing node sequences. A straight-line scan from top to bottom, for example, yields the node sequence 2, B, 1, 3, A, 4, 5 in Figure. The fundamental MSP algorithm scans an area from two separate directions with two straight lines, each scan being treated as an event. A left-to-right scan yields the node sequence 1, A, 2, 3, 5, B, 4 in Figure.
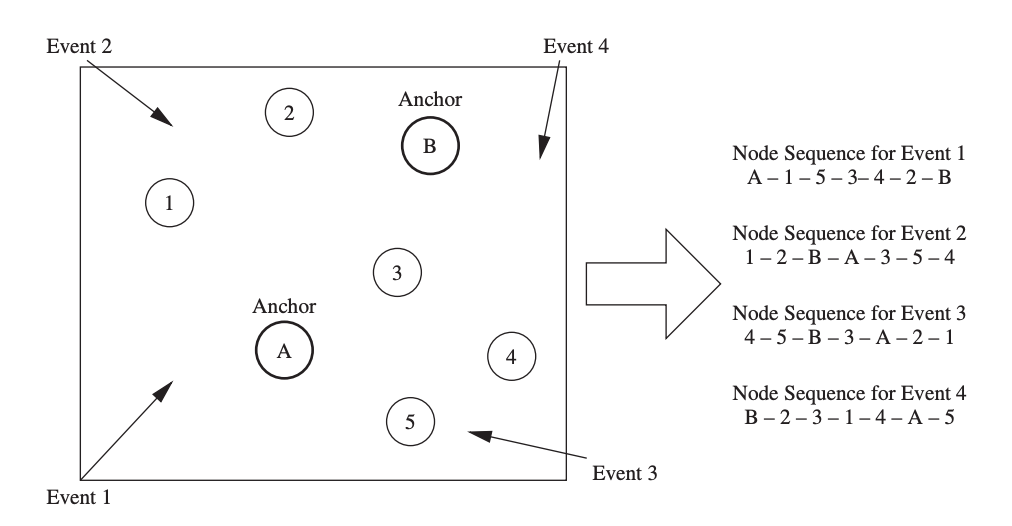
Fig 19: Basic concept of MSP