Unit - 4
Time Value of Money
Q1) What is interest rate?
A1) Interest rate is the percentage of principal that the lender charges for the use of the money. The principal is the loan amount.
Interest rate is the amount charged by the lender for the use of the asset, expressed as a percentage of the principal. Interest rates are listed on an annual basis, commonly known as the Annual Percentage Rate (APR). Borrowed assets can include cash, consumer goods, or large assets such as vehicles and buildings. Understand interest rates
Interest is essentially a rental or lease fee to the borrower to use the asset. For large assets such as vehicles and buildings, the lease rate can act as an interest rate. If the borrower is considered low risk by the lender, the borrower is usually charged a lower interest rate. If the borrowers are considered high risk, the interest rates they will be charged will be high. Risk is usually assessed when a lender sees a potential borrower's credit score, which is excellent if you want to qualify for the best loan
For loans, the interest rate applies to the principal, which is the amount of the loan. Interest rates are the rate of debt costs for borrowers and returns for credits.
When will interest rates apply?
Interest rates apply to most loan or borrowing transactions. The college tuition fees for the home where you purchased your personal debt, the start or fund business of a fund business, or the payment of your personal debt are as follows: Companies fund capital projects and obtain loans to expand their business by purchasing fixed and long-term assets such as land, buildings and machinery. Borrowed money will be repaid in one lump sum on a pre-determined date or in regular instalments.
The money repaid is usually more than the amount borrowed, as the lender needs compensation for the loss of money use during the loan period. The lender may be investing money during that period rather than offering a loan that would be generating income from the asset. The difference between the total repayment total and the original loan is of interest to be fulfilled. The interest charged will be applied to the principal amount.
Q2) Explain Simple interest with example.
A2) Interest is a fee which is paid for having the use of money. We pay interest on mortgages for having the use of the bank's money. We use the bank's money to pay a contractor or person from whom we are purchasing a home. Similarly, the bank pays us interest on money invested in savings accounts or certificates of deposit because it has temporary access to our money. The amount of money that is lent or invested is called the principle. Interest is usually paid in proportion to the principle and the period of time over which the money is used. The interest rate specifies the rate at which interest accumulates. The interest rate is typically stated as a percentage of the principle per period of time, for example, 18 percent per year or 1.5 percent per month.
Interest that is paid solely on the amount of the principle is called simple interest. Simple interest is usually associated with loans or investments which are short-term in nature.
Formula of Simple Interest:
The calculation of simple interest is based on the following formula:
Simple interest = Principle × Interest rate per time period × Number of time periods
Or
I = Pin
Where;
- I = Simple interest, dollars
- P = Principle, dollars
- i = Interest rate per time period
- n = Number of time periods of loan
In the above formula, it is essential that the time periods for i and n be consistent with each other. That is, if i is expressed as a percentage per year, n should be expressed in number of years. Similarly, if i is expressed as a percentage per month, n must be stated in number of months.
Example
A credit union has issued a 3-year loan of $5,000. Simple interest is charged at a rate of 10 percent per year. The principle plus interest is to be repaid at the end of the third year. Compute the interest for three-year period. What amount will be repaid at the end of the third year?
Solution:
I = Pin
I = ($5,000) (0.10) (3)
= $1,500
The amount to be repaid is the principle plus the accumulated interest, that is:
$5,000 + $1,500
$6,500
Q3) Explain Compound interest with example.
A3) Here's an explanation that should make everything crystal clear:
When you take out a loan, interest is calculated for the first period (be it a month or a year). This interest is then added to the original total. Following on from that, the interest for the next period is calculated but is based on the gross figure from the first period. From there, well, you get the idea.
It does sound complicated. So, as it's often said a picture paints a thousand words, here's an illustration:
Compound interest example 1
Let's say you borrow $2,000 over a 3-year period, pay 10% annual interest on your debt and are not making regular repayments. In this case, the amount you will have to repay will look like this:
Year 1: $2,000 x 10% = $200.
Year 2: $2,200 x 10% = $220.
Year 3: $2,420 x 10% = $242.
The total repayment figure after 3 years is $2,662 (the $662 interest is the sum of each year's interest).
It should be noted that if you make regular repayments on your loan, the total compound interest will be lower because the remaining principal on the loan will be decreasing at each compound interval. We have a loan calculator and a loan payoff calculator if you want to try out some figures.
The formula used to calculate standard compound interest (including the principal) is as follows:
M = P (1 + i )n
M is the final amount you repay at the end of the loan.
P is the principal amount you borrow.
i is the annual rate of interest.
n is the number of years you borrow/invest over.
If we use the example of our $2,000 borrowed at 10% over 3 years (without repayments) we get the following calculation:
M=2000(1+0.1)3 = $2,662
Q4) Write the relationship between Simple interest and Compound interest.
A4) Difference between Simple Interest and Compound Interest
When a person borrows money from the money lender or any bank/financial institution, some extra amount is charged by the lending entity for the use of money, called as interest. The interest rate is mutually decided by both the parties. Interest can be charged in two ways, i.e., simple interest and compound interest. The former is the type of interest where the interest is charged only on loaned amount but in the case of the latter interest is calculated on the amount lent plus accumulated interest.
So, simple interest is the sum paid for using the borrowed money, for a fixed period. On the other hand, whenever the interest becomes due for payment, it is added to the principal, on whom interest for the succeeding period is reckoned, this is known as compound interest.
The following are the major differences between simple interest and compound interest:
- The interest charged on the principal for the entire loan term is known as Simple Interest. The interest computed on both principal and the previously earned interest is known as Compound Interest.
- Compound Interest gives a high return as compared to Simple Interest.
- In Simple Interest, the principal remains constant while in the case of Compound Interest the Principal changes due to the effect of compounding.
- The growth rate of Simple Interest is lower than the Compound Interest.
- Calculation of simple interest is easy while the calculation of compound interest is complex.
Example:
Suppose Alex deposited Rs. 1000 to a bank at 5% interest (simple and compound) p.a. For 3 years. Find out the total interest that he will get at the end of the third year?
Solution: Here P = 1000, r = 5% and t = 3 years
Simple interest 
Compound interest = 
Interest is the fee for using someone else’s money. There are many reasons for paying interest like time value of money, inflation, opportunity cost, and risk factor. Simple Interest is quick to calculate, but Compound Interest is practically difficult. If you compute, both simple interest and compound interest for a given Principal, Rate, and Time, you will always find that compound interest is always higher than the simple interest due to the compounding effect on it.
Q5) What is cash flow diagram?
A5) In this comparison method, the cash flow of each option is reduced to zero time by assuming the interest rate i. The best alternative is then selected by comparing the present value of the alternatives, depending on the type of decision.
The sign of different amounts at different points in the cash flow diagram is determined based on the type of decision problem.
In a cost-dominant cash flow diagram, costs (outflows) are assigned with a positive sign, and profits, revenues, salvage values (all inflows), etc. are assigned with a negative sign.
In revenue / profit-dominated cash flow diagrams, profit, revenue, and salvage value (all inflows into the organization) are assigned a positive sign. Costs (outflows) are assigned with a negative sign.
If it is decided to choose the alternative at the lowest cost, the alternative with the lowest present value will be chosen. On the other hand, if you choose the alternative with the highest profit, the alternative with the highest present value is selected.
Cash flow charts provide a visual representation of your income and expenses over a period of time. This figure consists of horizontal lines with markers at a series of time intervals. Costs and costs are displayed at the right time.
Please note that it is customary to obtain cash flow during the year-end year or at the end of the year (EOY). There are certain cash flows that are not appropriate and need to be handled differently. The most common is rent, which is usually obtained at the beginning of the cash period. There are other prepaid flows that are processed in the same way.
For example, consider a truck that will be purchased for $ 55,000. It costs $ 9,500 each year to operate, including fuel and maintenance. The engine will need to be rebuilt for $ 22,000 within 6 years and will sell for $ 6,000 in the 9th year. The cash flow diagram is as follows.
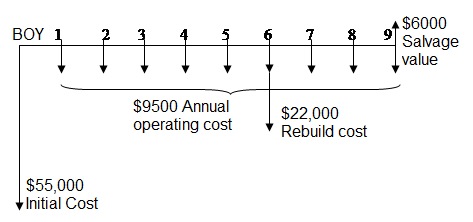
Note that the initial cost, the purchase price, is recorded at the beginning of Year 1, sometimes referred to as end-of-year 0, or EOY 0. Also, operating and maintenance costs actually will occur during a year, but they are recorded at EOY, and so forth.
Q6) What is economic equivalence?
A6) Economic equivalence is a basic concept that underlies the calculations of the engineering economy. Before delving into the economics, think about the many types of equivalence we may use every day by moving from one scale to another. The following is an example of transfer between scales.
Length
12 inches=1 foot 3 feet = 1 yard 39.370 inches=1 meter
100 centimeters = 1meter 1000 meters =1 kilometer 1 kilometer=0.621 mile
Pressure:
1 atmosphere=1 newton/mete pascal=1 kilopascal
Equivalence often involves more than one scale. Consider speed equivalence from 110 kilometres per hour (kph) to miles / minute using conversions between distance and time scales with three-digit accuracy.
Speed:
1 mile =1.609 kilometers 1 hour=60 minutes
110 kph=68.365 miles per hour (mph) 68.365 mph=1.139 per minute
Combine the four scales (hours in minutes, hours in hours, lengths in miles, and lengths in kilometres) to make these equivalent statements about velocity. Note that throughout these statements, the basic relationship of 1 mile = 1.609 kilometers and 1 hour = 60 minutes applies. If the basic relationship changes, the overall equivalence will fail.
Now consider economic equivalence.
Economic equivalence is the combination of interest rates and the time value of money to determine different amounts at different times when the economic values are equal.
As an example, if the interest rate is 6% per year, today's (current) $ 100 is equivalent to $ 106 a year from today.
Incurred amount = 100 + 100 (0.06) = 100 (1 + 0.06) = $ 106
If someone offers you a gift of $ 100 today or $ 106 a year from today, there is no difference in the proposal you have accepted from an economic point of view. In both cases, it will be $ 106 a year from today. However, the two amounts are equal only if the annual interest rate is 6%. At higher or lower interest rates, $ 100 today is not equivalent to $ 106 a year from today.
In addition to future equivalence, the same logic can be applied to determine previous year's equivalence. The current total of $ 100 is equivalent to $ 100 1.06 = $ 94.34 a year ago, with an annual interest rate of 6%. From these figures, we can say: Last year it was $ 94.34, now it is $ 100, and a year later it is $ 106, which is equivalent at an annual interest rate of 6%. The fact that these sums are equal can be verified by calculating two interest rates for a one-year interest period.
 and
and 
Q7) Explain Present Worth method.
A7) Present Worth Method
- In this comparison method, the cash flow of each option is reduced to zero time by assuming the interest rate i
- Then, depending on the type of decision, the best alternative is selected by comparing the present value of the alternatives.
- In a cost-dominant cash flow diagram, costs (outflows) are assigned with a positive sign, and profits, revenues, salvage values (all inflows), etc. are assigned with a negative sign.
- In revenue / profit-dominated cash flow charts, profit, revenue, and salvage value (all inflows into the organization) are assigned a positive sign. Costs (outflows) are assigned with a negative sign.
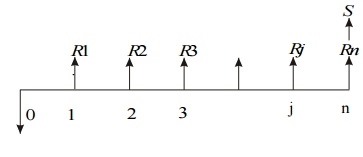
- Revenue-Dominated Cash Flow Diagram
A generalized revenue-dominated cash flow diagram to demonstrate the present worth method of comparison is presented in Fig.
b. Cost-Dominated Cash Flow Diagram
A generalized cost-dominated cash flow diagram to demonstrate the present worth method of comparison is presented in Fig.
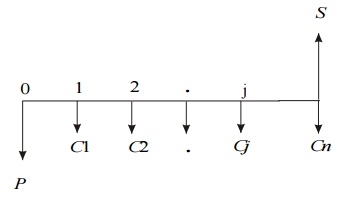
To compute the present worth amount of the above cash flow diagram for a given interest rate i, we have the formula
PW(i) = P + C1[1/(1 + i)1] + C2[1/(1 + i)2] + ... + Cj[1/(1 + i) j]
+ Cn[1/(1 + i)n] – S[1/(1 + i)n]
Example:
Alpha Industry is planning to expand its production operation. It has identified three different technologies for meeting the goal. The initial outlay and annual revenues with respect to each of the technologies are summarized in Table. Suggest the best technology which is to be implemented based on the present worth method of comparison assuming 20% interest rate, compounded annually.
Table:
| Initial outlay (Rs.) | Annual revenue (Rs.) | Life(years) |
Technology 1 | 12,00,000 | 4,00,000 | 10 |
Technology 2 | 20,00,000 | 6,00,000 | 10 |
Technology 3 | 18,00,000 | 5,00,000 | 10 |
Solution
In all the technologies, the initial outlay is assigned a negative sign and the annual revenues are assigned a positive sign.
TECHNOLOGY 1
Initial outlay, P = Rs. 12,00,000
Annual revenue, A = Rs. 4,00,000
Interest rate, i = 20%, compounded annually
Life of this technology, n = 10 years
The cash flow diagram of this technology is as shown in Fig.
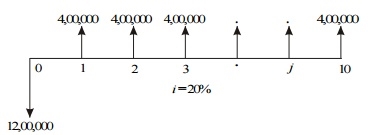
Cash flow diagram for technology 1.
The present worth expression for this technology is
PW (20%)1 = –12,00,000 + 4,00,000 (P/A, 20%, 10)
= –12,00,000 + 4,00,000 (4.1925)
= –12,00,000 + 16,77,000
= Rs. 4,77,000
TECHNOLOGY 2
Initial outlay, P = Rs. 20,00,000
Annual revenue, A = Rs. 6,00,000
Interest rate, i = 20%, compounded annually
Life of this technology, n = 10 years
The cash flow diagram of this technology is shown in Fig.
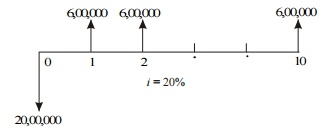
Cash flow diagram for technology 2.
The present worth expression for this technology is
PW (20%)2 = – 20,00,000 + 6,00,000 (P/A, 20%, 10)
= – 20,00,000 + 6,00,000 (4.1925)
= – 20,00,000 + 25,15,500
= Rs. 5,15,500
TECHNOLOGY 3
Initial outlay, P = Rs. 18,00,000
Annual revenue, A = Rs. 5,00,000
Interest rate, i = 20%, compounded annually
Life of this technology, n = 10 years
The cash flow diagram of this technology is shown in Fig.
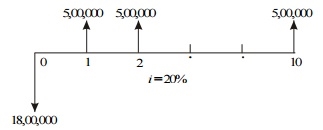
Cash flow diagram for technology 3.
The present worth expression for this technology is
PW (20%)3 = –18,00,000 + 5,00,000 (P/A, 20%, 10)
= –18,00,000 + 5,00,000 (4.1925)
= –18,00,000 + 20,96,250
= Rs. 2,96,250
From the above calculations, it is clear that the present worth of technology 2 is the highest among all the technologies. Therefore, technology 2 is suggested for implementation to expand the production.
Q8) Explain Future Worth method.
A8) Future Worth Method
- The alternative future value comparison method calculates the future value of various alternatives.
- Next, the net revenue with the highest future value or the net cost alternative with the lowest future value is selected as the best alternative for implementation.
- Revenue-focused cash flow chart
The figure shows a generalized revenue-focused cash flow diagram to show how to compare future values.
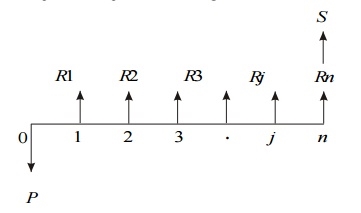
In Fig. P represents an initial investment, Rj the net-revenue at the end of the jth year, and S the salvage value at the end of the nth year.
The formula for the future worth of the above cash flow diagram for a given interest rate, i is
FW(i) = –P (1 + i) n + R1(1 + i) n–1 + R2(1 + i) n–2 + ...
+ R j (1 + i) n–j + ... + Rn + S
In the above formula, the expenditure is assigned with negative sign and the revenues are assigned with positive sign.
Ii. Cost-Dominated Cash Flow Diagram
A generalized cost – dominated cash flow diagram to demonstrate the future worth method of comparison is given in fig
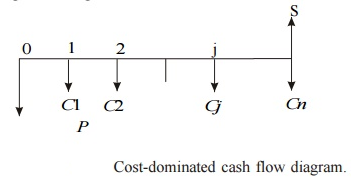
In Fig, P represents an initial investment, Cj the net cost of operation and maintenance at the end of the jth year, and S the salvage value at the end of the nth year.
The formula for the future worth of the above cash flow diagram for a given interest rate, i is
FW(i) = P (1 + i) n + C1(1 + i) n–1 + C2(1 + i) n–2 + ... + Cj (1 + i) n–j + ... + Cn – S
EXAMPLE
Consider the following two mutually exclusive alternatives:
Alternative |
0 | End of the year | |||
1 | 2 | 3 | 4 | ||
A(Rs.) | -50,00,000 | 20,00,000 | 20,00,000 | 20,00,000 | 20,00,000 |
B(Rs.) | -45,00,00 | 18,00,000 | 18,00,000 | 18,00,000 | 18,00,000 |
At i = 18%, select the best alternative based on future worth method of comparison.
Solution Alternative A
Initial investment, P = Rs. 50,00,000
Annual equivalent revenue, A = Rs. 20,00,000
Interest rate, i = 18%, compounded annually
Life of alternative A = 4 years
The cash flow diagram of alternative A is shown in Fig.
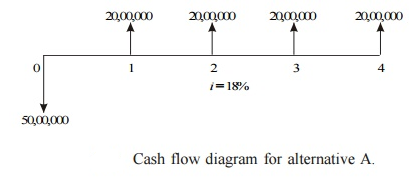
The future worth amount of alternative B is computed as
FWA (18%) = –50,00,000(F/P, 18%, 4) + 20,00,000(F/A, 18%, 4)
= –50,00,000(1.939) + 20,00,000(5.215)
= Rs. 7,35,000
Alternative B
Initial investment, P = Rs. 45,00,000
Annual equivalent revenue, A = Rs. 18,00,000
Interest rate, i = 18%, compounded annually
Life of alternative B = 4 years
The cash flow diagram of alternative B is illustrated in Fig.
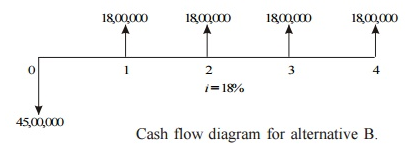
The future worth amount of alternative B is computed as
FWB (18%) = – 45,00,000(F/P, 18%, 4) + 18,00,000 (F/A, 18%, 4)
= – 45,00,000(1.939) + 18,00,000(5.215)
= Rs. 6,61,500
Q9) Explain Internal Rate of return method.
A9) The rate of return of a cash flow pattern is the interest rate at which the present value of that cash flow pattern decreases to zero.
This comparison method calculates the rate of return for each option. The most profitable alternative is then selected as the best alternative.
Figure 1 shows a generalized cash flow diagram showing how to compare rates of return.
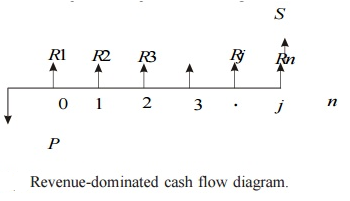
In the above cash flow diagram, P represents an initial investment, Rj the net revenue at the end of the jth year, and S the salvage value at the end of the nth year.
The first step is to find the net present worth of the cash flow diagram using the following expression at a given interest rate, i.
PW(i) = – P + R1/ (1 + i)1 + R2/ (1 + i)2 + ...
+ Rj/ (1 + i) j + ... + Rn/ (1 + i) n + S/ (1 + i) n
EXAMPLE
A person is planning a new business. The initial outlay and cash flow pattern for the new business are as listed below. The expected life of the business is five years. Find the rate of return for the new business.
Period | 0 | 1 | 2 | 3 | 4 | 5 |
Cash flow (Rs.) | -1,00,000 | 30,000 | 30,000 | 30,000 | 30,000 | 30,000 |
Solution
Initial investment = Rs. 1,00,000 Annual equal revenue = Rs. 30,000 Life = 5 years
The cash flow diagram for this situation is illustrated in Fig.
The present worth function for the business is
PW(i) = –1,00,000 + 30,000(P/A, i, 5)
When i = 10%,
PW (10%) = –1,00,000 + 30,000(P/A, 10%, 5)
= –1,00,000 + 30,000(3.7908)
= Rs. 13,724.
When i = 15%,
PW (15%) = –1,00,000 + 30,000(P/A, 15%, 5)
= –1,00,000 + 30,000(3.3522)
= Rs. 566.
When i = 18%,
PW (18%) = –1,00,000 + 30,000(P/A, 18%, 5)
= –1,00,000 + 30,000(3.1272)
= Rs. – 6,184

Therefore, the rate of return for the new business is 15.252%.
Q10) Throw some light on cost benefit analysis.
A10) Sector companies, primarily driven by profit motives, only have an internal direct impact (i.e., the cash flow they incur and the costs they have to bear) when making business decisions. Consider and do not take a longer and broader view of their activities from a social point of view. However, public enterprises and non-profits must take on the broader social impact of their resource allocation and investment decisions. That is, it takes into account both internal (direct) and external (indirect) impacts of business decisions.
An analytical model called cost-benefit analysis is used to analyze the broader impact of resource allocation and investment decisions. The correct understanding is the social cost-benefit analysis of investment projects, but the word "social" is often omitted. Therefore, the social cost-benefit analysis estimates both the direct and indirect costs of a project to society and the direct and indirect benefits of a project. These indirect costs and benefits are often referred to as externalities. Therefore, in addition to direct costs and benefits, the analysis of social costs and benefits takes into account the externalities of the investment project.
Therefore, the cost-benefit analysis is the counterpart of the capital budgeting method used to evaluate the desirability of investment projects and programs in the public sector and to evaluate investment projects by private companies. Pioneers of cost-benefit analysis technology, Perst and Survey, explain the essence of cost-benefit analysis and write: And a broader perspective (in the sense of allowing side effects of many types and many people, industries, regions, etc.), that is, of all the costs and benefits associated with it (in the sense of seeing the effects of the distant and near future). Means enumeration and evaluation. "
When estimating the social cost of a project, it is important to note that the market price of the resource is not used, as it is generally distorted. They are distorted due to government tax impositions, or market flaws or the monopoly of resource owners. Instead, social cost-benefit analysis uses shadow prices that reflect the value of opportunity cost or the true rarity of the resource.
It is worth noting that public sector companies and non-profits face the same resource allocation and investment issues as the private sector. However, when companies in the public sector have a broader perspective and make decisions about them, taking into account both internal and external influences (i.e., externalities) of the decision, the private sector leads only to the consideration of profits. He adopts a narrow view and considers only the internals, ignoring external effects that may be harmful or beneficial, the effects of business decisions. Therefore, cost-benefit analysis is not just about the internal benefits and costs of the investment projects you carry out.
Instead, the cost-benefit analysis enumerates and evaluates all social benefits and all social costs of a project or spending program. This is an investment project that considers only private costs and interests, as opposed to the capital budgeting method used by private companies. Therefore, citing Todalo and Smith, "the usual criteria for commercial profitability that guide private investors' investment decisions may not be a good guide to public investment decisions, so a social cost-benefit analysis is needed. Since private companies are interested in maximizing private profits, they usually only consider variables that affect the balance of net profits. Both receipts and profits are inputs and outputs. It is evaluated at the prevailing market price of the investment. "
According to the social cost-benefit analysis, the actual income or income from the project is truly both the social benefit from the project and the expenditure incurred on the market-priced input used as the true social cost. Not reflected. In addition, in the calculation of social costs and benefits, governments or planners take into account the external effects of public investment projects (both external and uneconomical), while private companies ignore them in project valuation.
From the above, the difference between private costs and benefits of social costs and benefits, and investment decisions based on private costs and benefits will lead to inappropriate decisions and therefore will not maximize social welfare. Become. In addition, we believe that the social cost-benefit analysis approach can reach social cost-benefit by adjusting market prices appropriately.
What's more, the profits from investment projects will come primarily in future years, and the costs will come in the long term in the future, so it is the discounted social benefits that are compared to determine the desirability of the project. And discounted social costs. However, in order to discount the social costs and benefits of investment projects, it is the social discount rate that is used to obtain the net present value rather than the market interest rate.
Q11) Write the uses of cost benefit analysis.
A11) Cost-benefit analysis techniques are especially used when a long and broad view of the effectiveness of a particular project or spending program is required. Cost-benefit analysis is commonly used when the economic impact of a project or investment spending program or policy change occurs in the future, as is the case with private sector capital budgets. However, unlike private sector capital budgets, cost-benefit analysis seeks to estimate all direct and indirect spill over effects.
Cost-benefit analysis is used to assess whether to accept or reject a particular project or a particular public spending program. To do so, both direct and indirect benefits of the project or a particular public spending program, as well as the costs incurred by the project over the years, are estimated. Then use the appropriate discount rate from a social perspective to estimate the present value of both future benefits and costs.
From the above, cost-benefit analysis is a way to evaluate public projects and investment programs to make decisions about the desirability of the projects being implemented. Therefore, it is used to evaluate large public investment schemes such as dam and airport construction, disease management (such as malaria control programs), defense and safety planning, health, education and research spending.
Q12) Explain the process of social cost benefit.
A12) The entire process of calculating social profitability or social costs and benefits can be divided into five steps:
1. Designation of social objective function:
The first step in performing a cost-benefit analysis is to specify the social objective function that needs to be maximized. In this objective function, weights are assigned to different profits (for example, increased per capita consumption, increased employment, desirable income distribution). These weights reflect the importance given to the various benefits of the project.
2. Identify different benefits and costs:
The second step in cost-benefit analysis is to identify and list all direct and indirect benefits and costs of an investment project. The direct benefit of a project can be measured by the additional quantity of goods and services produced when the project is implemented, compared to when the project is not implemented.
Therefore, the direct advantage of irrigation projects is the amount of additional crops produced, minus additional costs, in the form of more labor, seeds and equipment used compared to unirrigated land. Is. Direct costs, on the other hand, include capital equipment, installed machinery, capital costs for land acquired to carry out and implement the project, and operational and maintenance costs incurred over the life of the project.
In addition to the direct impact of an investment project, there is always an indirect or external impact. These indirect or external beneficial effects fall into two types: (1) actual or technical effects and (2) monetary effects. Actual external benefits may include cost savings incurred by other government programs.
For example, the construction of irrigation dams can lead to reduced floods and soil erosion, reducing government spending on flood control and soil erosion prevention programs. Such actual indirect benefits are counted in cost-benefit studies.
Indirect (external) monetary benefits, on the other hand, are generally not included in the cost-benefit study benefits and cost listings. These external financial benefits come in the form of increased business volumes or increased land prices as a result of project implementation.
Therefore, the areas of Delhi near the metro railroad routes have caused land prices to rise in these areas. In addition, the transaction volume of shops and restaurants around the metro is increasing. These indirect or external monetary benefits are distributive and are not included in the Metro Railroad Cost-Benefit Study.
Similarly, indirect multiplier effects and induced investment effects resulting from government investment projects are generally not counted as they occur regardless of whether the investment is from the public or private sector (). Except for some special circumstances).
For example, if the purpose of a government investment program is regional development, implementing a regional investment project can trigger regional investment. Create a multiplier effect on income and job creation and reduce unemployment in the region. Since regional development forms part of the maximized social objective function, some include them in the cost-benefit study of regional investment programs.
3. Evaluation of social benefits and costs:
The third step in the social cost-benefit analysis is to measure the social value of profits, that is, the social cost of the output (both goods and services) produced by the project and the inputs used in the project.
Shadow prices (also known as accounting prices) are used instead of market prices to evaluate the output of goods and services. Since the market price is different from the true social value, the shadow price is used to measure the social value of the output. In fact, the greater the difference between shadow and market prices, the greater the need for social cost-benefit analysis to determine public investment.
Similarly, cost-benefit analysis measures costs using the shadow price of the input or factor used in the project. It is worth noting that the shadow price of an input or factor is a value overlooked by those opportunity costs, or the factors and resources used for initial capital investment and production during the life of the project. This is because resources need to be drawn from other activities in order to carry out the proposed project. For example, when implementing an irrigation project, 50% of the required workforce will be withdrawn from the unemployed class.
The social opportunity cost of such labor is zero and the employed workers are paid market wages, which should be calculated in the cost-benefit analysis. The same is true for idle land used for projects. Opportunity cost of idle land is zero because there is no alternative use. This is true despite the fact that the government actually has to pay compensation to the landowners to acquire this idle land. This compensation only affects the distribution of profits from the project to land use, not the social cost of the project.
All profits and costs (both internal and external) for the life of the project must be discounted to obtain the present value. In this regard, we must also make difficult decisions about appropriate social discount rates that discount future benefits and costs in order to find present value.
Another important issue in calculating social benefits and costs is measuring a common unit of social benefits and costs (also known as numeraire), especially if the country has a trade relationship with another country in the world. And to express. You need to buy and sell overseas. This common unit is needed to be able to compare domestic and foreign products. There are two main approaches to finding a common account unit. The first approach is the UNIDO approach and the second approach is the Little-Mirrlees approach.
In UNIDO's approach, profits and costs are measured at domestic market prices using consumption as a numeraire. In addition, this approach uses product shadow prices and factors to adjust for differences between market prices and social value. In addition, shadow exchange rates are used to allow comparison of domestic and international resources.
In the Little-Mirrlees approach, project profits and costs are measured at global prices, so they need to represent opportunity costs for outputs and inputs. Using world prices to measure profits and costs helps avoid the use of shadow exchange rates. In addition, the Little-Mirrlees approach uses forex public savings as the numéraire instead of consumption.
In short, the benefits and costs of this approach are valued in foreign exchange terms. However, this does not mean that the project account is held in foreign currency, only that the value in the project valuation report is recorded in the forex equivalent to estimate the amount of forex earned by the project. Means.
It should be noted that both the UNIDO and Mirrlees approaches face some measurement problems.
4. Find social discount rates:
In cost-benefit analysis, the next step is to choose the right social discount rate. Since the benefits of investment projects are mainly in the future and the costs will be incurred for a long time in the future, it is discounted social benefits and discounts that are compared to determine the social desirability of the project. It is a social cost.
For this, we need a social discount rate. Private sectors are used to discount future profits and costs when calculating market interest rates for commercial profitability. However, when it comes to the social profitability of public sector investments, market interest rates are not appropriate for discounting future social benefits and costs.
So why is the social discount rate different from the market interest rate? Individuals want to live for a certain number of years, so they are discounting the future at higher interest rates that are reflected in market interest rates. Meanwhile, planners and governments in developing countries want to look longer and more important to the consumption and welfare of future generations, so lower discounts are needed to discount the flow of future social benefits. Use rate. And cost. Both are evaluated using shadow prices. Therefore, Todaro and Smith write: The higher the future benefits and costs are valued in the government's planning scheme, the lower the social discount rate, for example, if the government also represents future fatal citizens. "
5. Criteria for selecting a project:
Finally, the government must decide whether to accept or reject the investment project. To do this, we need criteria. The most commonly used standard is the net present value (NPV) standard. To use this criterion, you need to find the net present value of the proposed project using the following formula:

Where Vt is the flow of social benefits measured using the shadow price of the goods produced, Ct is the social cost of the input measured by the shadow price (i.e., opportunity cost), and rt is the social discount rate., Ko is a social cost. Of investment in the project.
Currently, investment projects are economically profitable from a social point of view if the net present value (NPV) of the project using the social discount rate is positive (that is, above zero). In other words, the proposed investment project must be accepted for investment if the present value (PV) of the project exceeds the current social cost of initial capital investment (K0).
Q13) What is depreciation and what are its features?
A13) In accounting terms, depreciation is defined as a systematic way to reduce the recorded cost of a fixed asset until the value of the asset becomes zero or negligible.
Examples of fixed assets include buildings, furniture, office equipment and machinery. Land is the only exception that cannot be depreciated, as the value of land increases over time.
Depreciation reflects part of the cost of a fixed asset in the revenue generated by the fixed asset. This is mandatory under the matching principle, as revenue is recorded with the associated costs during the accounting period in which the asset is used. This will help you get a complete picture of your revenue-generating transactions.
Depreciation example – When a delivery truck buys a company at the cost of Rs. At 100,000, if the expected truck usage is 5 years, the company may depreciate the asset as Rs as depreciation expense. 20,000 people every year for 5 years.
Depreciation can be defined as a measure of the depletion of an asset's lifetime due to any cause during a particular time period. -Spicer and Pegler.
“Depreciation is a measure of the consumption, consumption, or other loss of value of a depreciable asset resulting from use, time wasted, or obsolescence due to changes in technology or market. During that time, you will be assigned to charge a significant portion of the depreciation amount for each accounting period. Depreciation expense includes the depreciation of assets with a predetermined useful life. "
-Accounting Standard-6 (revised), issued by ICAI.
Depreciation features:
(i) Depreciation is a decline in the value of fixed assets (excluding land). The decline in the value of an asset is inherently permanent. Once shrunk, it cannot be restored to its original value.
(ii) Depreciation is a gradual and continuous process because the value of an asset decreases due to the use of the asset or the expiration of time.
(iii) It is not an asset valuation process. This is the process of allocating the cost of an asset to its lifetime.
(iv) Depreciation reduces the book value, not the market value of an asset.
(v) Depreciation is only used for property, plant and equipment. It is not wont to waste intangible assets like amortization of goodwill and depletion of natural resources.
Q14) State the causes of depreciation.
A14) Top 7 Causes of Depreciation
- Due to wear during use of assets
This is one of the main reasons for asset depreciation. Continued use of assets causes most assets to wear or deteriorate. Plants and machines used in the production of goods, buildings, vehicles, etc. As with the machines used in production, the continuous use and operation of the machine reduces the work or capacity of the machine over time. The value of the machine also diminishes in the market. Therefore, in order to show the financial position of a company fairly, it is necessary to reduce the proportional value of the machines listed in the books.
2. Compliance with accounting standards applicable to the entity
In accordance with the applicability of accounting standards to companies, companies must comply with the provisions contained in the standards. This is done according to the concept of matching that must be followed in the accounting of an entity. According to the concept of matching, depreciation is charged for each, as income through assets is also in the period listed in the books above.
3. Technological advances in supplementary assets in the market
Value of fixed assets
When new upgraded versions of assets with better technological sophistication are available on the market, the assets used by the enterprise will gradually decrease, providing more benefits to customers compared to older discontinued versions of assets. To do. In such cases, the requirements for old assets will gradually diminish and the recoverable amount in the market will also diminish. Therefore, the value of an asset must be presented financially in a fair or reasonable amount.
4. Use of the provided life of the asset
For fixed assets, the useful life of the asset is provided in units of consumption so that the asset "X" runs for 10,000 hours. Therefore, the cost of an asset is allocated according to consumption or hourly usage.
5. Amortization of assets by license or usage period
Some assets, such as licenses, patents, copyrights, and leasehold rights, can only be used for a specified period of time. Over that time, the asset was unavailable. Therefore, that cost must be allocated or amortized according to the age of the asset. At the end of the validity period, the asset must be amortized from the books.
6. Depreciation must be done to waste assets according to resource extraction
When wasting assets
Like coal mines, oil wells, etc. are amortized and used according to the extraction of natural resources made from them during the period. For such types of wasted assets, the resources that an entity can extract from such assets for use by the organization are limited. During each period, the depreciation of the asset during that period is considered according to the estimated total amount extracted from the wasted assets and the amount already extracted.
7. The absolute need to maintain fixed assets for proper asset productivity
The plants and machines used by manufacturing companies to manufacture products require regular maintenance over a period of time to gain full-time productivity from the use of such machines. Even after a period of time, some important parts of the machine need to be replaced with new parts. Therefore, you must charge depreciation so that future replacement parts are properly accounted for and amortized over their useful lives.
Q15) Explain Straight line method of depreciation?
A15) The straight-line method is the default method used to evenly recognize the carrying amount of fixed assets over their useful lives. This is used when there is no particular pattern in how an asset is used over time. The straight-line method is the easiest depreciation method to calculate and is highly recommended for use as it causes few calculation errors. The procedure for flat-rate calculation is as follows.
- Determines the initial cost of an asset recognized as a fixed asset.
- Subtract the estimated residual value of the asset from the amount recorded in the books.
- Determines the estimated useful life of an asset. It is easiest to use the standard useful life for each class of asset.
- Divide the estimated useful life (yearly) by 1 to calculate the depreciation rate using the straight-line method.
- Multiply the depreciation rate by the cost of assets (minus salvage value).
- Once calculated, depreciation expense is recorded in accounting records as a depreciation expense account and a credit to the accumulated depreciation account. Accumulated depreciation is against assets. That is, it is paired with the fixed asset account and the depreciation is reduced.
Formula:
Depreciation = (Asset Cost – Net Residual Value) / Service Life
Depreciation rate = (annual depreciation cost x 100) / cost of capital
Straight-line Journal Entries:
1. Purchase of Assets A / c Dr. Xx
To cash / bank / creditor A / cxx
(Purchasing assets)
2. Depreciation of assets A / c Dr. Xx
To asset A /cxx
(Assets are subject to depreciation)
3. Transfer depreciation gains / losses A / c Dr. Xx
To depreciation of asset A / cxx
(Asset depreciation is transferred to the profit and loss account)
Example 1
Pensive Corporation will purchase a Procrastinator Deluxe machine for $ 60,000. It has an estimated salvage value of $ 10,000 and a useful life of 5 years. Pensive calculates the machine's annual flat-rate depreciation as follows:
Solution
$ 60,000 Purchase Cost – $ 10,000 Estimated Residual Value = $ 50,000 Depreciable Asset Cost
1/5-year useful life = 20% annual depreciation rate
20% depreciation rate x $ 50,000 depreciation asset cost = $ 10,000 annual depreciation
Q16) What is declining balance method of depreciation?
A16) The various depreciation methods are based on mathematical formulas. This formula is derived from a study of asset behaviour over a period of time. One such depreciation method is the depreciation method. Learn more about this method.
According to the depreciation method, depreciation is charged at a fixed percentage of the book value of the asset. It is also known as depreciation or depreciation because its book value decreases each year.
Since the book value decreases every year, the depreciation amount also decreases every year. This way, the value of the asset never goes to zero.
If you plot the depreciation amount billed this way and the corresponding period on the graph, the line will move down.
This method was previously based on the assumption that the cost of repairing an asset is low and therefore more depreciation costs must be charged. In addition, depreciation costs will decrease as repair costs increase in later years. Therefore, this method puts an equal burden on profits each year for the life of the asset.
However, this method may not provide full depreciation at the end of the asset's useful life if the applicable depreciation rate is not appropriate.
In addition, when applying this method, it is necessary to consider the period of use of the asset. If the asset is used for only two months in a year, depreciation will only be charged for two months.
However, if the asset is used for more than 180 days for income tax purposes, you will be charged full-year depreciation. Income tax rules also allow you to depreciate using the depreciation method.
The formula is:

Where n=number of years
S=Salvage value
C=Cost of asset
Amount of depreciation=Book Value x Rate of Depreciation
100