Unit - 1
High Frequency Transmission lines and Wave guides
Q1) Explain the R, L and G parameter for transmission line?
A1) 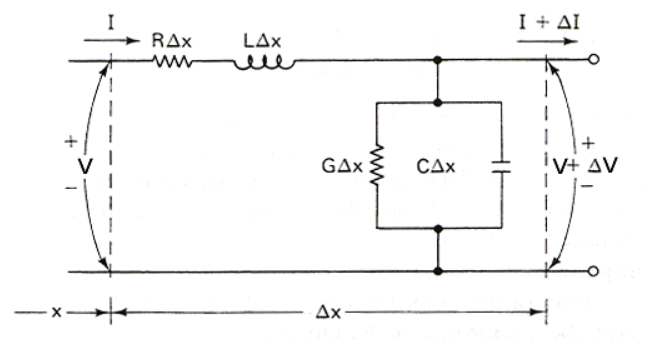
Fig 1 Transmission Line
A transmission line can be represented as an infinite series of cascaded identical two port networks each representing an infinitely small section of the transmission line. The small networks represent:
the distributed resistance of the conductors is represented by a series resistance per unit length R;
the distributed inductance is represented by a series inductance per unit length L;
the capacitance between the conductors is represented by a shunt capacitance per unit length C; and
the conductance of the dielectric material separating the two conductors is represented by a conductance per unit length G.
Solution of the model gives two key equations that describe transmission line behaviour.


where γ is the complex propagation coefficient, and Z0 is the complex characteristic impedance.
R, L, G, and C may be frequency dependent. In practical transmission lines at HF and above the following assumptions are often appropriately used:
inductance per unit length as constant (due partially to skin effect and a fully effective outer conductor)); capacitance per unit length as constant; resistance per unit length is subject to skin effect and is proportional to the square root of frequency; and conductance per unit length is due to dielectric loss and is proportional to frequency.
The reversal of electric field in a lossy dielectric expends a certain amount of energy, and when excited by an alternating voltage, the dielectric loss is usually proportional to the number of times that the field reverses in a given time period. Dielectric Loss in that case is proportional to frequency.
Skin Effect is well developed where the conductor radius more than about three skin depths.
Q2) Explain the concept about smith chart?
A2) The Smith Chart is a tool for visualizing the impedance of a transmission line and antenna system as a function of frequency. Smith Charts can be used to increase understanding of transmission lines and how they behave from an impedance viewpoint.
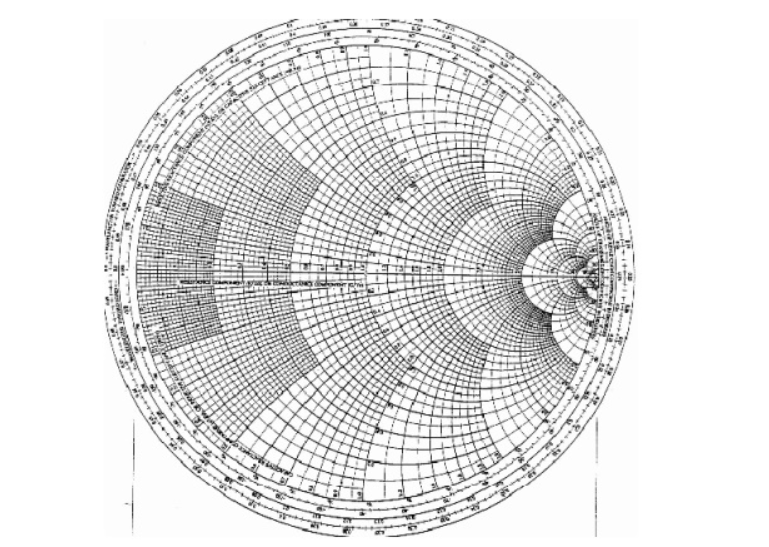
Figure 2. Basic smith chart
The Smith Chart displays the complex reflection coefficient, in polar form, for an arbitrary impedance
The complex reflection coefficient () for an impedance ZL attached to a transmission line with characteristic impedance Z0 is given by
 = ZL – Zo/ ZL +Zo -------------------------------------(1)
Let us assume Z0 is 50 Ohms, which is often. The complex reflection coefficient, or, must have a magnitude between 0 and 1.
As such, the set of all possible values for must lie within the unit circle:
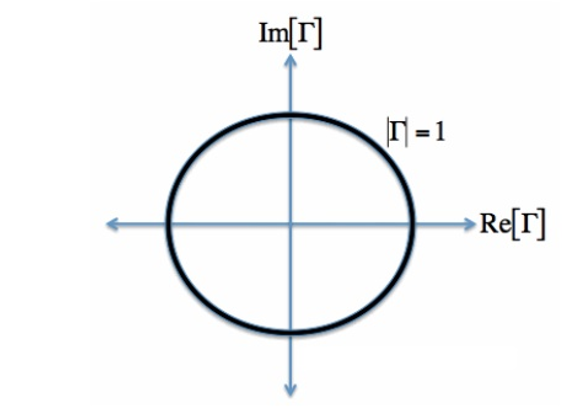
Figure 3. Complex reflection co-efficient
In Figure, plotting the set of all values for the complex reflection coefficient, along the real and imaginary axis. The center of the Smith Chart is the point where the reflection coefficient is zero. That is, this is the only point on the smith chart where no power is reflected by the load impedance.
The outer ring of the Smith Chart is where the magnitude of is equal to 1. This is the black circle in Figure. Along this curve, all the power is reflected by the load impedance.
Normalized Load Impedance
To make the Smith Chart more general and independent of the characteristic impedance Z0 of the transmission line, we will normalize the load impedance ZL by Z0 for all future plots:
zL = ZL/Zo =
Equation [1] does not affect the reflection coefficient tow.
Constant Resistance Circles
For a given normalized load impedance zL, we can determine and plot it on the Smith Chart. Now, suppose we have the normalized load impedance given by:
z1 = 1 + iY ----------------------------------------------------(2)
In equation [2], Y is any real number.

Figure 4. Constant Resistance circle
In Figure, the outer blue ring represents the boundary of the smith chart. The black curve is a constant resistance circle: this is where all values of z1 = 1 + i*Y will lie on.
Q3) How can we show a transmission line as a circuit element?
A3) If we consider only what appears at the input terminals, a short-circuited quarter-wavelength line and a parallel-resonant circuit, of coil and capacitor, have these characteristics in common; both present extremely high impedance at one particular frequency; with both, the impedance at resonance is resistive and the impedance drops rapidly if the frequency varies slightly from resonance. Both will carry direct current freely while effectively blocking the frequency to which they are resonant.
An inherent difference is that the transmission line displays similar resonance at all odd multiples of its lowest resonant frequency; and has the inverse resonance characteristics of a shorted half-wavelength line at the even multiples.
An open-circuited quarter-wavelength line is similar to a series-resonant circuit of coil and capacitor. It has extremely low impedance at the resonant frequency, is resistive at resonance while being inductive above and capacitive below this frequency. It blocks direct current while freely passing the resonant-frequency r.f. energy. Like a short-circuited line (but unlike a circuit of lumped constants), its characteristics tend to repeat at odd multiples of the lowest resonant frequency, whereas at even multiples the inverse characteristics appear.
An open-circuited half-wavelength line is similar to a short-circuited quarter-wavelength line in that both have the same Q and are thus equally selective in a resonant circuit. However, at radio frequencies other than the desired resonant frequency (such as half and double the fundamental resonant frequency), the open and short-circuited lines have quite different characteristics. This may be important in connection with harmonics.
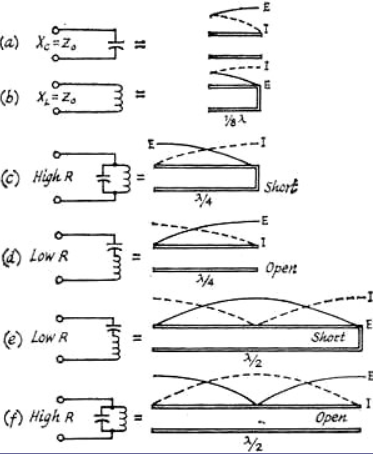
Fig 5 OC and SC Impedance
'With a quarter-wave line, the closest resonant frequencies to the fundamental occur at odd multiples such as 3, 5 and 7 times the fundamental frequency. With a half-wave line, they occur at multiples of 2, 3 and 4 times the fundamental. A quarter-wave resonant line, therefore, gives greater separation of the higher-resonant frequencies from the fundamental.
Parallel Lines
Parallel lines are most often used with push-pull circuits, in either quarter-wave or half-wave configuration. With half-wavelength lines, the B plus is connected at the electrical center of the lines, and often a coil, resonant at a lower frequency, is placed here to give multiband operation.
Parallel lines are relatively easy to construct. Their electrical length may be readily changed with short-circuiting bars, and when they are used with appropriate types of tubes, the connections between lines and tube terminals can be short and direct. Furthermore, these connections and the portions of the tube leads inside the envelope become parts of the resonant-line system. For very high frequencies, the tube leads may constitute the principal part of this system but are largely inaccessible for purposes of power-output coupling. In some cases, the portion of the circuit from which power is to be coupled may be operated at a multiple length of the shortest possible line; e.g., three-quarter rather than one-quarter wavelength.
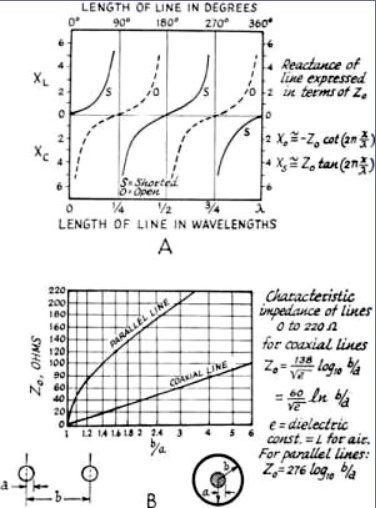
Fig 6 Relationship of spacing of conductor and radius of conductor
Since open parallel lines radiate electromagnetic energy when excited, it is necessary to shield these lines for optimum performance. The parts, such as sides and covers, of the metal boxes used as the shield should be well bonded together, either with screws or by contact fingers. This is because electromagnetic shielding depends on the flow of induced currents in the metal of the shield. For the same reason, the shield should be constructed from material of high conductivity. For ultra-high frequencies, silver plating is desirable.
Several methods of tuning are available. An adjustable short-circuiting strap can be used, which must make good electrical contact. If the line is also short-circuited at the end by a large disk of copper or other good conducting material, it will be more effective. A butterfly capacitor, or a parallel-plate capacitor, may be placed anywhere along the line the tuning effect becoming less pronounced as the capacitor is located nearer the shorted end of the line.
The characteristic impedance of parallel conductors may be calculated as follows:

where b is the center-to-center spacing of the conductor and a is the radius of the conductors. This relationship is shown in Figure.
Q4) Explain stub matching?
A4) A stub is a short-circuited section of a transmission line connected in parallel to the main transmission line. A stub of appropriate length is placed at some distance from the load such that the impedance seen beyond the stub is equal to the characteristic impedance. Suppose we have a load impedance connected to a transmission line with characteristic impedance. The objective here is that no reflection should be seen by the generator. In other words, even if there are standing waves in the vicinity of the load, the standing waves must vanish beyond certain distance from the load. Conceptually this can be achieved by adding a stub to the main line such that the reflected wave from the short-circuit end of the stub and the reflected wave from the load on the main line completely cancel each other at point B to give no net reflected wave beyond point B towards the generator. We make use of Smith chart for this purpose

Fig 7 Single Stub Matching Technique
Since we have a parallel connection of transmission lines, it is more convenient to solve the problem using admittances rather than impedances. To convert the impedance into admittance also we make use of the Smith chart and avoid any analytical calculation. Now onwards treat the Smith chart as the admittance chart
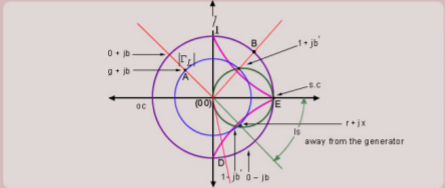
Matching Procedure
First mark the load admittance on the admittance smith chart (A). Plot the constant  circle on the smith chart. Move on the constant
  circle till you intersect the constant g=1 circle this point of intersection corresponds to point 1+jb’ (B). The distance traversed on the constant circle is l1. This is the location of placing the stub on the transmission line from the load end. Find constant suseptance jb’ circle. Find mirror image of the circle to get -jb’ circle. Mark 0-jb’ on the outer most circle (D). From (D) move circular clockwise up to s.c point (E) to get the stub length ls.’
Double Stub Matching
The main drawback of single stub matching network is it requires a variable length transmission line between stub and input port or between stub and load impedance. It may create difficulties for variable tuners. To overcome this, we use double stub. The general topology of such a network that matches an arbitrary load impedance to an input impedance Zin = Zo.
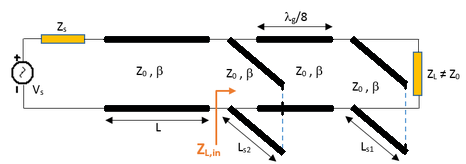
Fig 8 Double Stub Matching
In double stub matching network 2 short or open circuit stub are connected in parallel with a fixed length transmission line in between. The length l2 this line selected to be on eighth, five r=eighth or three eighth of wavelength. The three eighth and five eighth wavelength spacings are typically employed in high frequency applications to simplify the tuner construction. The length of line segment between the two stubs is
l2 = (3/8)
Q5) Explain TE waveguide for rectangular waveguide?
A5) TEmn modes in rectangular cavity are characterized by Ez = 0 which means z component of magnetic field Hz must be existing in order to have energy transmission in guide. TEmn field equation in rectangular wave guide are


Propagation Constant:
The propagation of the wave in the guide is assumed in positive z- direction. Propagation constant  in waveguide differs from intrinsic propagation constant of dielectric.

 is cut-off wave number
For lossless dielectric 

Cut-off Wave Number
The Cut-off Wave Number h is defined by

for  mode
mode
There are three cases for the propagation constant  in waveguide.
Case 1:
If  , then
  Hence there will be no wave propagation (evanescence) in the guide.
Thus at a given operating frequency f, only those mode having f>fc will propagate, and
Modes with  will lead to imaginary β (or real ).
Such modes are called evanescent modes. The cut-off frequency is 
Case 2:
If 

Case 3:
If 

So, wave cannot propagate through waveguide as  is a real quantity

For free space/loss less dielectric 

The phase velocity in the positive z-direction for the 

 is the phase velocity in vacuum.
The characteristic wave impedance of  mode in the guide
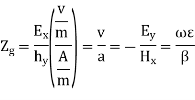


Q6) Explain TM waveguide for rectangular waveguide?
A6) Rectangular waveguide is situated in the rectangular coordinate system with its breadth along x-direction, width along y-direction and z-indicates direction of propagation. Vector Helmholtz equation is

For TE wave (


 Propagation constant
 Phase constant
= attenuation constant

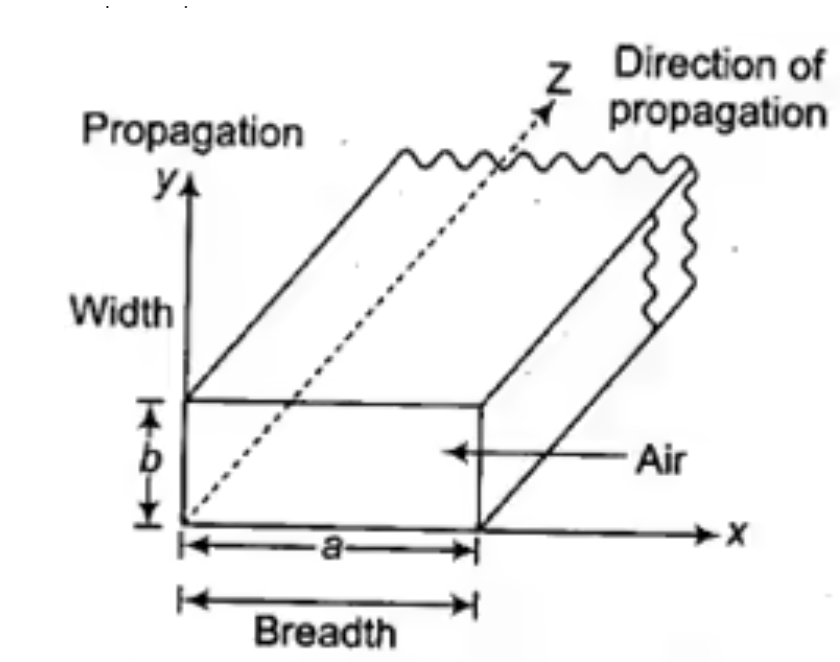
Fig 13 Rectangular Waveguide


Solving above equations we find  and
and 
Also applying Maxwell equations, we can find 


For TM mode  the z component of electric field E must exist in order to have energy transmission in the guide.
The  mode field equations are


Some of the TM mode characteristic equations are same as that of TE mode but some are different and they are given as


Q7) How there is attenuation due to conductor and dielectric losses in waveguide?
A7) For most practical waveguides and transmission lines the loss associated with dielectric loss and conductor loss is relatively small. To account for these losses, we will make this approximation:
α=αc αd
αc =Attenuation constant due to conductor loss (ignore dielectric loss)
αd = Attenuation constant due to dielectric loss (ignore conductor loss)

K=K’-jK’’
K’ =Re{K}
εrc’ is denoted as εr
Dielectric Attenuation for TEM Mode
For this mode kz=k
Where


Dielectric Attenuation for Waveguide Mode
An exact general expression for the dielectric attenuation:
 =
=

The value kc is always real, regardless of whether the waveguide filling material is lossy or not.
Approximation for the wavenumber of a waveguide mode:


Assume a small dielectric loss:

Then use:

We assume here that we are above cut-off. Hence, we have:

This gives us:


Attenuation due to Conductor Loss
We can assume that the fields of the lossy guide are approximately the same as those for lossless guide, except with a small amount of attenuation. We can use a “perturbation” method to determine αc
Dielectric loss does not change the shape of the fields at all in a waveguide or transmission line, since the boundary conditions remain the same (PEC). Conductor loss does disturb the fields slightly.
Q8) Explain design of rectangular waveguide to support dominant TE10 mode?
A8) The section of rectangular guide shown in Figure is excited somewhere to the right of y = 0 and shorted by a conducting plate in the plane y = 0. We presume that the frequency is above the cut-off frequency for the TE10 mode and that a > w as shown. The frequency of excitation is chosen to be below the cut-off frequency for all higher order modes and the source is far away from y = 0 (i.e., at y  a). The field in the guide is then that of the TE10 mode. Thus, Hy is given with m = 1 and n = 0.
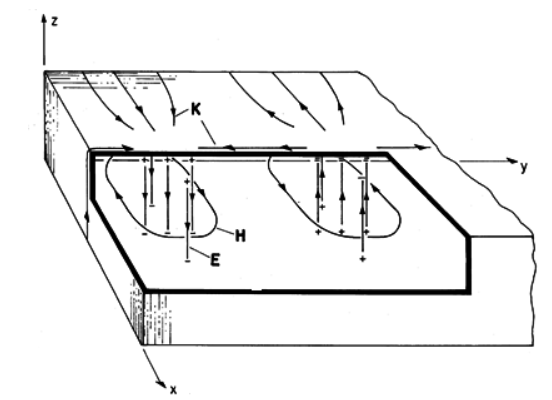
Fig 8 Fields and surface sources for TE10 mode
Because of the short, Ez (x, y = 0, z) = 0. In order to relate the
coefficients C+10 and C-10, we must determine  z from
  y as given by


To sketch these fields in the neighbourhood of the short and deduce the associated surface charge and current densities, consider C+10 to be real. The j in above equations shows that Hx and Hy are 90 degrees out of phase with the electric field. Thus, in the field sketches of Figure above, E and H are shown at different instants of time, say E when  t =
t =  and H when
  t =
t =  /2. The surface charge density is where Ez terminates and originates on the upper and lower walls. The surface current density can be inferred from Ampère's continuity condition. The temporal oscillations of these fields should be pictured with H equal to zero when E peaks, and with E equal to zero when H peaks. At planes spaced by multiples of a half-wavelength along the y axis, E is always zero.
Q9) What are low loss line?
A9) For practical transmission line the loss is small and approximation can be made to simplify the expression for 
Propagation constant  can be corelate as


For low loss case assume  and
and  at the operating frequency
 can be neglected.
Using Taylor’s series


And 
The attenuation constant

 varies linearly with
The characteristic impedance ( )
)


Q10) Explain about the field pattern flow through waveguide?
A10) Because of the power orthogonality of the distinct modes in a waveguide with perfectly impenetrable walls (perfect electric conductors or perfect magnetic conductors), we can study the power flow due to each mode and the total power flow is the sum of the power flow from each mode
Power Flow and Group Velocity
The time average power flow in a waveguide is given by
Pf = 
For a TE mode with eikzz dependence
Es = 
Hs = 
Pf = 


Pf = 


The first integral vanishes by virtue of the boundary condition. While using ∇2 sH∗ z = −k 2 sH∗ z, we have
Pf =  |
| |}
|}
For a TM mode, we can similarly show that
Pf =  |
| |}
|}
When the mode is cut-off, i.e., when k2 < k2s, so that kz = √k2 − k2s is pure imaginary, and the waveguide is lossless, there is no time average power flow down the waveguide. In such a case, the mode is evanescent. The time average energy stored per unit length in the electric field for the TE mode is given by

We =  |
| |
|
WT= We +Wm =  |
| |
|
For a lossless waveguide with a propagating mode, kz is pure real and for the TE mode becomes
Pf =  |
| |}
|}
Pf =  WT
WT
Kz2 = ω2 - ks2
- ks2
The group velocity in a waveguide is derived to be
vg = 
Pf = vg WT
In other words, in a lossless waveguide, the time average energy stored per unit length, moving at the group velocity vg contributes to the power flow. The group velocity in a waveguide is the velocity of energy propagation, and it is also the signal velocity. The phase velocity of a wave in a waveguide is defined to be
vph = 
It is the velocity of the phase of the wave. Since a signal does not travel at the phase velocity, it could be larger than the speed of light. This happens near cut-off when k2 → k2s for a mode. Group velocity or signal velocity cannot be larger than the speed of light, a limit dictated by Einstein’s theory of special relativity. Note that vphvg = c2 where c is the velocity of light in the medium.
Q11) Explain terminated lossless transmission line?
A11) Consider Figure which shows a lossless transmission line being driven from the left and which is terminated by an impedance ZL on the right. If ZL is equal to the characteristic impedance Z0 of the transmission line, then the input impedance Zin will be equal to ZL. Otherwise, Zin depends on both ZL and the characteristics of the transmission line. In this section, we determine a general expression for Zin in terms of ZL, Z0, the phase propagation constant β, and the length l of the line.

Fig 9 A transmission line driven by a source on the left and terminated by an impedance ZL at z=0 on the right
the interface between source and transmission line is located at z=−l. Impedance is defined at the ratio of potential to current, so:


But we know that

Q12) What are lossless transmission lines explain?
A12) Lossless line(R=0=G):
The transmission line is said to be lossless if the conductors of the line are perfect c and the dielectric separating between them is lossless (c 0). For such a line R=0=G. This is the necessary condition for a line to be lossless. Hence for this line the attenuation constant α=0. But the propagation constant
γ=
But we also know that γ=α+jβ. so on solving we get:
j
Z0 =√L/C
and the phase velocity vp=⍵/β=1/√(LC)=f λ
Q13) Explain the propagation of wave in TL?
A13) Thus voltage and current on the transmission line can be expressed in phasor form as:


Thus, the voltage and current on the transmission line can be expressed us phasor form as

The decoupled wave equation for both
V(Z) and I(Z) can be obtained as:


When 
Is the complex propagation constant and a function of frequency.
The wave equation for V(Z) and I(z) can be written as


Where 
The solution to these wave equations is of the form:


When  and
and  represent wave propagation in +z direction
Alternative expression for I(z)


On comparing with

The characteristic impedance of a transmission line is given by

And 
In time domain the voltage waveform can be expressed as


Where  is the phase angle of complex voltage
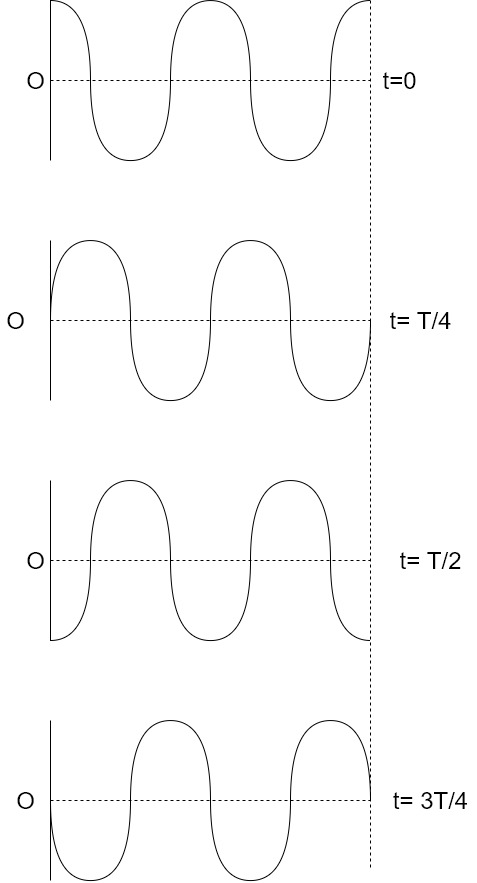
Fig 10 Voltage waveform of forward wave along +z direction
Voltage waveform of forward wave along +z direction on transmission line for 

The phase velocity is given by

The wavelength on the line is given by

Q14) Derive the field equation of rectangular hollow waveguide?
A14) Field expressions can be obtained from the solutions of Maxwell’s equations and wave equations.
Assumptions:
Space inside the waveguide is free space or air. The walls of the waveguides are perfectly conducting. The direction of propagation of power is z. The dimension of the narrow wall is b metres. The dimension of the broad wall is a metres. The fields in z-direction vary as
As the medium inside the waveguide is air, the first and second Maxwell’s equations are given by
∇ × H = jω∈ E
∇ × E = jωμ H
Expanding these equations, we get,


= +
+
=
Equating the respective components, we get


 and
and


 (29)
(29)
As the fields are assumed to be varying in the form of , combining time variation, we get,


Similarly,


and,

Substituting Equation (30) in Equations (28) and (29), we get,
 =
= =
=
 -
- =
=
 (31)
(31)


The wave equations are:
∇2E = −ω2μ ∈ E
∇2H = −ω2μ ∈ H
These can be written as,
 +
+ +
+ =
=
 +
+ +
+ =
=
The wave equations for Ez and Hz are given by,

 (32)
(32)
Equation (31) can be mathematically manipulated to get the following. Consider,
 = -
= - (33)
(33)
and,
 (34)
(34)
Equation (33) becomes,
 -
- (35)
(35)
But Ey from Equation (34) is,
 (36)
(36)
From Equations (35) and (36), we get,


or,
 =
=
or,


where,

Similarly,


 (37)
(37)
In the above equations, if Ez= 0 and Hz= 0, all the field components vanish. Hence, the wave cannot satisfy TEM wave characteristics. They are transverse magnetic (TM) and transverse electric (TE) waves
Q15) Derive expression for field analysis of Co-ax TL?
A15) TEM wave is a wave for which there are no components of E and H in the direction of propagation.
TEM wave is a TMm wave for m = 0, or, TEM = TEM0. TEM wave is called principal wave.
The field components of TEM wave are obtained from m = 0. They are:


The propagation parameters for TEM wave are


TEM wave between parallel plates are given below,
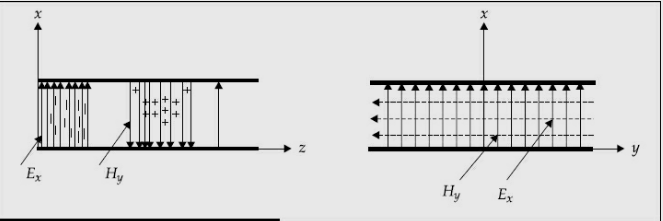
Fig 11 TEM wave field between parallel plates
Rectangular Waveguide:
A rectangular waveguide is a hollow metallic device with four sides closed and two sides open. It can be used as
a radiator
a high pass filter
a transmission line
a feed element to antennas
A hollow rectangular waveguide supports only TE and TM waves/modes and it does not support TEM mode.
Q16) What are rectangular waveguide explain with field equations?
A16) Rectangular waveguide is situated in the rectangular coordinate system with its breadth along x-direction, width along y-direction and z-indicates direction of propagation. Vector Helmholtz equation is

For TE wave (


 Propagation constant
 Phase constant
= attenuation constant


Fig 12 Rectangular Waveguide


Solving above equations we find  and
and 
Also applying Maxwell equations, we can find 


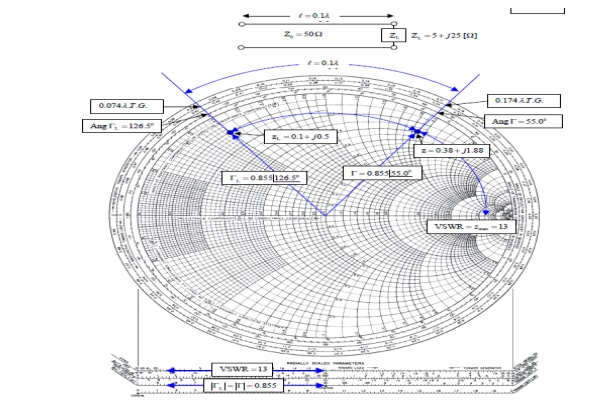
Q17) The 0.1λ length line shown has a characteristic impedance of 50 and is terminated with a load impedance of ZL = 5+j25.?
(a) Locate zL = ZL/Z0 = 0.1 + j0.5 on the Smith chart.
(b)What is the impedance at l = 0:1λ?
(c) What is the VSWR on the line?
(d) What is ΓL?
(e) What is Γ at l = 0.1λ from the load?
A17) What is the impedance at l = 0:1λ?
Since we want to move away from the load i.e., toward the generator, read 0.074 λ on the wavelengths toward generator scale and add l = 0.1 λ to obtain 0.174 λ on the wavelengths toward generator scale.
A radial line from the center of the chart intersects the constant reflection Co-efficient magnitude circle at z = 0.38 + j1.88. Hence Z = zZ0 = 50(0.38 + j1.88) = 19 + 94Ω.
What is the VSWR on the line?
Find VSWR = Zmax = 13 on the horizontal line to the right of the chart's center. Or use the SWR scale on the chart.
What is ΓL?
From the reflection coefficient scale below the chart,
Find |ΓL| = 0.855. From the angle of reflection coefficient scale on the perimeter of the chart, Find the angle of ΓL=126.5₀. Hence ΓL=0.855e j126.5₀.
(e) What is Γ at l = 0.1λ from the load?
Note that |Γ| =|ΓL|=0.855. Read, the angle of the reflection coefficient from the angle of reflection coefficient scale as 55.0₀. Hence ΓL=0.855e j126.5₀.
