Unit - 2
Propagation Models for Wireless Networks
Q1) Explain the two-ray ground reflection model?
A1) This model includes not just one path, but also another path that reflects off of the ground, as shown in Figure below (in Rappaport). The model isn’t hard to develop, and provides an important theoretical underpinning to the multiple breakpoint model. Remember, powers of multipath DON’T add together. Only voltages or field strength of multipath actually add together. The voltage on the antenna is proportional to the electric field at the antenna position. So, let’s talk about adding electric fields.
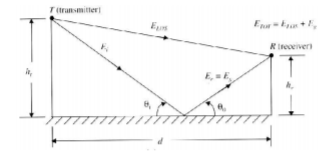
Fig 1 TX and RX are separated on the ground by d, but are at heights ht and hr respectively
Direct Path
Recall that the electric field magnitude decays as 1/d in free space. So, similar to how we wrote the received power with a reference distance d0, we write the E-field strength as the E-field strength at a reference distance, multiplied by d0/d′, for a path (distance of travel for waves) length d ′. Also, assume the signal is a simple sinusoid at the carrier frequency, fc. So,
E (d, t) = E0  ))
))
For the LOS path, given a distance along the ground of d, antenna heights ht and hr at the TX and RX, respectively, the
d ′ = 
ELOS = E0 ))
))
Reflected Path
Two things change for the reflected path compared to the LOS path:

Eg = ΓE0  ))
))
Let’s assume that d is very long compared to the antenna heights. So, the angle of incidence is approximately 0. In this case the reflection coefficient (assume perpendicular polarization) is -1. Then,
Eg = - E0  ))
))
Total Two-Ray E-Field
We are interested in the magnitude of the total E-field, ETOT = ELOS + Eg, that is, the quantity that multiplies the cos(2πfct) term. Using trig identities, and this approximation
∆ =  ≈
≈ 
|ETOT | ≈ 2E0  sin (
sin ( )
)
This means that the power decays as 1/d4! See Figure
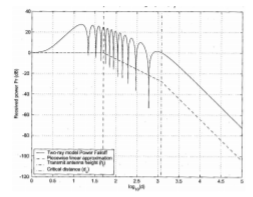
Fig 2 Received power as a function of log distance in two-ray model
Q2) What are micro-cell propagation model
A2) It is well known that obstacles directly affect propagation of wireless signals. We might tend to think that power received by a mobile receptor comes from waves crossing through obstacles along a propagation path but reality is all power comes from reflected waves which is commonly called multipath reflection phenomenon. Despite the fact of multipath reflection phenomenon, there is a relation between received power and the number of obstacles in the propagation path. When the number of obstacles between a transmitter and a receiver increases, signal power perceived by a receptor decreases as a result. Certainly, obstacles play a big role in signal propagation modeling and it is necessary to include them as part of the analysis.
Lee's microcell propagation model is a power prediction technique that includes the effect of obstacles on propagation analysis. It is widely applied to mobile cellular systems with cell coverage radius less than 1 Km. Lee's methodology is very easy to implement and provides faster and more accurate results in terms of signal power prediction when compared to other generic propagation models. In fact, it was recommended by the International Telecommunications Union (ITU) and the European Conference of Postal and Telecommunications Administrations (CEPT) to obtain the local mean values of the received signal along a route. It was developed for a Rayleigh distribution in the ultra-high frequency (UHF) band. We think it can be used in complex scenarios and moreover it is the model the Telecommunications operators prefer to use in practice.
We did some measurements in the same scenario in response to an official request of Ecuadorian Telecommunication operators. For these reasons we evaluated the empirical measurements for validating the Lee’s model. The original Lee microcell model considered terrain and buildings as obstacles located at urban and semi urban environments. The model presented a power prediction equation and a methodology for detailed analysis of building obstruction using the help of empiric characteristics curves based upon field measurements. It also addressed some interesting and useful concepts such as block building density, obstruction distance and equivalent obstruction distance.
Lee's microcell model is presented in the following equation.
Pr(A) = Pt – Llos (dA, h1) – Lb(B)
Where Pr(A) is received power at a random A point within the coverage area, Pt is the Effective Radiated Power (ERP), Llos(dA) is line of sight loss at dA distance from the source. The last parameter is Lb that represents any loss mainly associated to buildings obstruction along the propagation path and it normally depends on the building obstruction distance denoted as B. This model was enhanced in order to be applied to other kind of obstacles. Lee considered different databases for characterizing streets in urban zones and the extension of the basic model for macrocells.
Many have extended this model to consider complex scenarios. In the generalization of Lee’s model to any propagation channel and frequency band was presented. It also described the methodology to obtain the parameters involved in the model. The Lee’s model or extensions of this model have been also applied to several scenarios recently. A good point of start to understand Lee's model and an example of application is shown. The authors explain the model and apply it to a non-homogeneous environment considering the environment divided in different variable density buildings (dense urban, urban, suburban...).
They apply the model after deriving from field strength measurements the 1-mile intercept and the path loss slope parameters for each type of environment. The authors consider that building a database with pairs of known intercept and slope parameters let apply the Lee's model to different environments to perform propagation predictions. The work is also a case study in the city of Amman. With experimentation we tried to verify if Lee's model will behave well at the 1800 MHz band at our complex scenario.
Practical experimentation is not made as we propose in our contribution. In the application of Lee’s model at Nigeria is compared with others models for Code Division Multiple Access (CDMA) system operating in 800MHz UHF. As the conclusion of this comparison, the authors chose Hata’s model for their target environment.
Q3) Explain LEE macro-cell propagation model
A3)
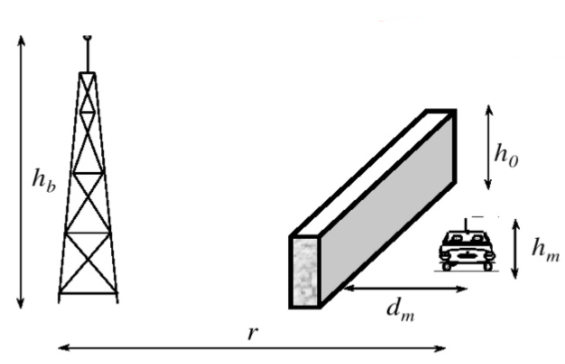
Fig 3 Macro-cell Geometry
A microcell model is used by system designers to place the base station. They are simple, dependent on distance from base station only and are based on measurements which empirical model.
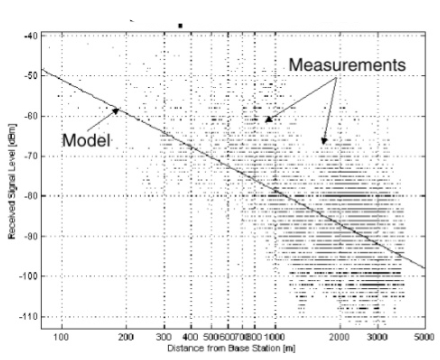
Fig 4 Empirical Model
Simplest form of an empirical path loss model

L(db) = 10nlogr + K
K = 10logk
PR and PT are the effective isotropic transmitted and predicted isotropic received power, K and n are constants of the model. Measurements taken in urban and suburban area usually find a path loss exponent close to 4, but with losses higher than predicted.
L(dB) = 10nlogr+K
L(dB) = 10nlog(r/rref) + Lref
Represented by clutter factor
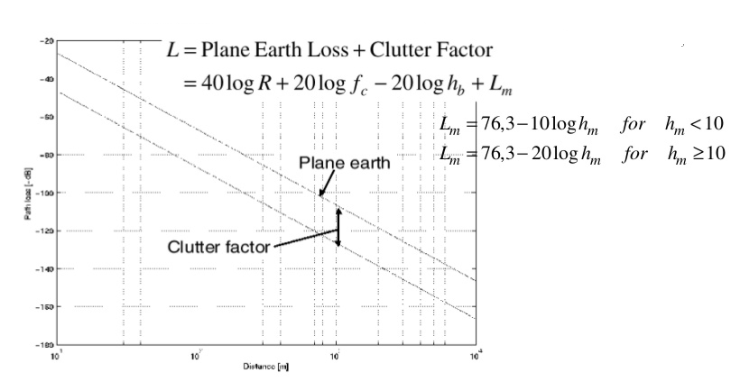
Fig 5 Clutter Factor Model
Fully empirical model, based on an extensive series of measurements made around Tokyo city between 200MHz and 2GHz. Predictions are based on a series of graphs; the most important ones have been approximated in a set of formulae by Hata discussed in above section.
Lee model is a power law model with parameters taken from measurements in a number of locations.
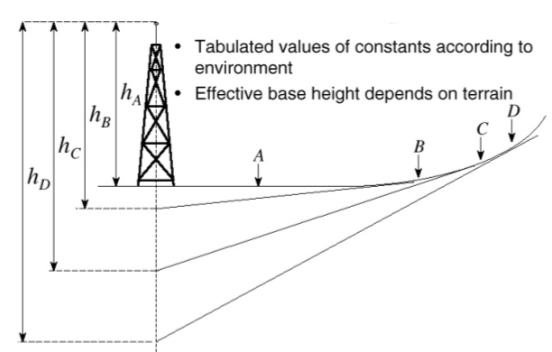
Fig 6 Lee model
The model equations are described as


Limitations of the empirical model are
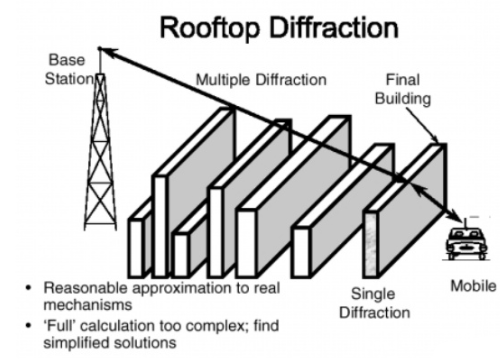
Fig 7 Roof top diffraction
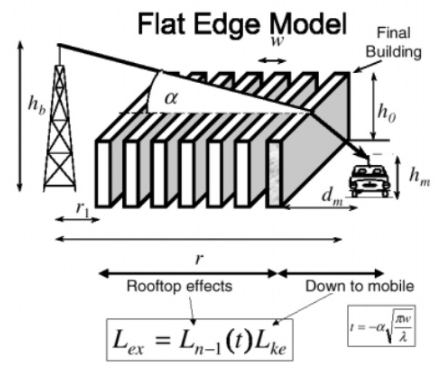
Fig 8 Flat edge model
Key takeaway
Limitations of the empirical model are
Q4) What is Shadowing model
A4) Log-normal Shadowing
• Statistical model for variations in the received signal amplitude due to blockage.
• The received signal power with the combined effect of path loss (power falloff model) and shadowing is, in dB, given by
Pr(dB) = Pt(dB) + 10 log10 K − 10γ log10(d/dr) − ψ(dB)
Empirical measurements support the log-normal distribution for ψ:

where ξ = 10/ ln 10, µψdB is the mean of ψdB = 10 log10 ψ in dB and σψdB is the standard deviation of ψdB, also in dB.
• With a change of variables, setting ψdB = 10 log10 ψ, we get

This empirical distribution can be justified by a CLT argument.
• The autocorrelation based on measurements follows an autoregressive model:

where Xc is the decorrelation distance, which depends on the environment
Combined Path Loss and Shadowing
• Linear Model:

• dB Model

• Average shadowing attenuation: when KdB = 10 log10 K captures average dB shadowing, µψdB = 0, otherwise µψdB > 0 since shadowing causes positive attenuation.
Outage Probability under Path Loss and Shadowing
• With path loss and shadowing, the received power at any given distance between transmitter and receiver is random.
• Leads to a non-circular coverage area around the transmitter, i.e., non-circular contours of constant power above which performance (e.g., in WiFi or cellular) is acceptable.
• Outage probability Pout (Pmin, d) is defined as the probability that the received power at a given distance d, Pr(d), is below a target Pmin: Pout (Pmin, d) = p(Pr(d) < Pmin). • For the simplified path loss model and log normal shadowing this becomes

Model Parameters from Empirical Data:
• Constant KdB typically obtained from measurement at distance d0.
• Power falloff exponent γ obtained by

where Mmeasured (di) is the ith path loss measurement at distance di and Mmodel(di) = KdB − 10γ log10(di). The minimizing γ is obtained by differentiating with respect to γ, setting this derivative to zero, and solving for γ.
• The resulting path loss model will include average attenuation, so µψdB = 0.
• Can also solve simultaneously for (KdB, γ) via least squares fit of both parameters to the data. Using the line equation for each data point yi that yi = mxi + KdB for m = −10γ and xi = log10(di), the error of the straight-line fit is

The shadowing variance σ 2 ψdB is obtained by determining the MSE of the data versus the empirical path loss model with the minimizing γ = γ0:

Q5) Explain Large scale path loss and shadowing
A5) Let’s transition to the real world, where we exist. There are other effects besides radiation, including attenuation (transmission), reflection, diffraction, scattering, etc. We will discuss each of these in upcoming lectures. For now, suffice it to say that many signals arrive at the receiver, but with less power than would be indicated by the Friis equation. The received power varies strongly (5-25 dB) even for small changes in antenna position, center frequency, and time.
But there is a large effect caused when the distance (a.k.a. path length) increases by orders of magnitude. This large effect we call large scale path loss. It is analogous to Lp, but doesn’t necessarily take the same form. We will re-write Lp as a function of distance in one of two ways:
Pr = Pt Gt Gr ( 10−αd/10
This works well in some conditions, for example, at 60 GHz, at which oxygen molecules absorb RF radiation, or due to rain at 30 GHz.
2. Power decay: Lp will be proportional to 1/dn, for some path loss exponent n. In free space, it was proportional to 1/d2, so this just lets n adjust to the particular environment. Typically, n ranges between 1.6 and 6, according to Rappaport. From my experience, I’ve seen n between 1.7 and 5.
Log Distance Path Loss
This is synonymous with what I call “power decay” above. Actually, it is the simplest of the models, and makes a big step towards better representation of actual large-scale path loss. In the log-distance path loss model, we can simply write the received power as a
Pr(dBm) = Π0(dBm) − 10n log10 ( )
)
where Π0(dBm) is still given by the Friis equation, but now the Lp(dB) term has changed to include a factor 10n instead of 20. Typically, d0 is taken to be on the edge of near-field and far-field, say 1 meter for indoor propagation, and 10-100m for outdoor propagation. We mentioned that we can find the parameter Π0(dBm) from measurements. We can also find the parameter n from measurements
Multiple Breakpoint Model
Empirically measurement studies have shown that the slope of the Lp vs. distance curve changes after a certain distance. You can see this effect as for, d > 20 meters; the path gains at d = 50 meters are all lower than the model, and one can see the slope changing to an n higher than 2.98. Regardless, we can model the path loss as experiencing more than one slope in different segments of the log d axis.

where Π0(dBm) is still the Friis received power at a distance d0, and Π1(dBm) is the received power (given by the first line of the equation) at distance d1, and d0 < d1. Typically, the slope of the path loss increases, i.e., n2 > n1.
Q6) Explain Multi path effects in mobile communication
A6)
Multipath causes three major things in wireless communication
Q7) What is Linear time variant channel model explain
A7) The input signal is given by

The received signal can be written as

where ai (f, t) and  I (f, t) are respectively the overall attenuation and propagation delay at time t from the transmitter to the receiver on path i. The overall attenuation is simply the product of the attenuation factors due to the antenna pattern of the transmitter and the receiver, the nature of the reflector, as well as a factor that is a function of the distance from the transmitting antenna to the reflector and from the reflector to the receive antenna. We have described the channel effect at a particular frequency f.
If we further assume that the ai (f, t) and the  I (f, t) do not depend on the frequency f, then we can use the principle of superposition to generalize the above input/output relation to an arbitrary input x(t) with non-zero bandwidth

In practice the attenuations and the propagation delays are usually slowly varying functions of frequency. These variations follow from the time-varying path lengths and also from frequency-dependent antenna gains. However, we are primarily interested in transmitting over bands that are narrow relative to the carrier frequency, and over such ranges we can omit this frequency dependence. It should however be noted that although the individual attenuations and delays are assumed to be independent of the frequency, the overall channel response can still vary with frequency due to the fact that different paths have different delays.
For the example of a perfectly reflecting wall


where the first expression is for the direct path and the second for the reflected path. The term here is to account for possible phase changes at the transmitter, reflector, and receiver. For the example here, there is a phase reversal at the reflector so we take
 1 =0 and
  2 =π.
2 =π.
Since the channel is linear, it can be described by the response h ( ,t) at time t to an impulse transmitted at time t-
 . In terms of h (
 ,t), the input/output relationship is given by

we see that the impulse response for the fading multipath channel is

This expression is really quite nice. It says that the effect of mobile users, arbitrarily moving reflectors and absorbers, and all of the complexities of solving Maxwell’s equations, finally reduce to an input/output relation between transmit and receive antennas which is simply represented as the impulse response of a linear time-varying channel filter.
The effect of the Doppler shift is not immediately evident in this representation.  i’(t) = vi/c where vi is the velocity with which the ith path length is increasing. Thus, the Doppler shift on the ith path is -f
 i’(t). In the special case when the transmitter, receiver and the environment are all stationary, the attenuations ai(t) and propagation delays
  i(t) do not depend on time t, and we have the usual linear time-invariant channel with an impulse response

For the time-varying impulse response h ( ,t), we can define a time-varying frequency response

Q8) Explain the concept of coherent bandwidth
A8) Another important general parameter of a wireless system is the multipath delay spread, Td, defined as the difference in propagation time between The Doppler spread can in principle be different for different taps.

This is defined as a function of t, but we regard it as an order of magnitude quantity, like the time coherence and Doppler spread. If a cell or LAN has a linear extent of a few kilometers or less, it is very unlikely to have path lengths that differ by more than 300 to 600 meters. This corresponds to path delays of one or two microseconds.
As cells become smaller due to increased cellular usage, Td also shrinks. As was already mentioned, typical wireless channels are under spread, which means that the delay spread Td is much smaller than the coherence time Tc. The bandwidths of cellular systems range between several hundred kilohertz and several megahertz, and thus, for the above multipath delay spread values, all the path delays lie within the peaks of two or three sinc functions; more often, they lie within a single peak. Adding a few extra taps to each channel filter because of the slow decay of the sinc function, we see that cellular channels can be represented with at most four or five channel filter taps.
On the other hand, there is a recent interest in ultra-wideband (UWB) communication, operating from 3.1 to 10.6 GHz. These channels can have up to a few hundred taps. When we study modulation and detection for cellular systems, we shall see that the receiver must estimate the values of these channel filter taps. The taps are estimated via transmitted and received waveforms, and thus the receiver makes no explicit use of (and usually does not have) any information about individual path delays and path strengths.
This is why we have not studied the details of propagation over multiple paths with complicated types of reflection mechanisms. All we really need is the aggregate values of gross physical mechanisms such as Doppler spread, coherence time, and multipath spread. The delay spread of the channel dictates its frequency coherence. Wireless channels change both in time and frequency. The time coherence shows us how quickly the channel changes in time, and similarly, the frequency coherence shows how quickly it changes in frequency.
We first understood about channels changing in time, and correspondingly about the duration of fades, by studying the simple example of a direct path and a single reflected path. That same example also showed us how channels change with frequency. We can see this in terms of the frequency response as well. Recall that the frequency response at time t is

The contribution due to a particular path has a phase linear in f. For multiple paths, there is a differential phase 2πf( i(t)-
i(t)- k(t)). This differential phase causes selective fading in frequency. This says that Er (f, t) changes 200MHz is frequency-selective, and the impulse response has many taps. (b) The spectral content of the same channel. (c) The same channel over 40MHz is flatter, and has for fewer taps. (d) The spectral contents of the same channel, limited to 40MHz bandwidth. At larger bandwidths, the same physical paths are resolved into a finer resolution. significantly, not only when t changes by 1/(4Ds), but also when f changes by 1/(2Td). This argument extends to an arbitrary number of paths, so the coherence bandwidth, Wc, is given by
Wc = 1/2Td
When the bandwidth of the input is considerably less than Wc, the channel is usually referred to as flat fading. In this case, the delay spread Td is much less than the symbol time 1/W, and a single channel filter tap is sufficient to represent the channel. When the bandwidth is much larger than Wc, the channel is said to be frequency-selective, and it has to be represented by multiple taps.
Q9) What is Coherent time in wireless networks
A9) An important channel parameter is the time-scale of the variation of the channel


Let us look at this expression term by term. The significant changes in ai occur over periods of seconds or more. Significant changes in the phase of the ith path occur at intervals of 1/(4Di) where Di = fc i’(t) is the Doppler shift for that path. When the different paths contributing to the lth tap have different Doppler shifts, the magnitude of hl[m] changes significantly. This is happening at the time-scale inversely proportional to the largest difference between the Doppler shifts, the Doppler spread Ds:

where the maximum is taken over all the paths that contribute significantly to a tap. Typical intervals for such changes are on the order of 10 ms. Finally, changes in the sinc term (of above equation) due to the time variation of each  i(t) are proportional to the bandwidth, whereas those in the phase are proportional to the carrier frequency, which is typically much larger. Essentially, it takes much longer for a path to move from one tap to the next than for its phase to change significantly. Thus, the fastest changes in the filter taps occur because of the phase changes, and these are significant over delay changes of 1/(4Ds).
The coherence time Tc of a wireless channel is defined (in an order of magnitude sense) as the interval over which hl[m] changes significantly as a function of m. What we have found, then, is the important relation

This is a somewhat imprecise relation, since the largest Doppler shifts may belong to paths that are too weak to make a difference. We could also view a phase change of π/4 to be significant, and thus replace the factor of 4 above by 8. Many people instead replace the factor of 4 by 1. The important thing is to recognize that the major effect in determining time coherence is the Doppler spread, and that the relationship is reciprocal; the larger the Doppler spread, the smaller the time coherence. In the wireless communication literature, channels are often categorized as fast fading and slow fading, but there is little consensus on what these terms mean.
Q10) Explain Doppler Shift in wireless communication
A10) So far, we’ve talked about fading without movement. A static link has a fading loss. If you change centre frequency on a static link, you see frequency-dependent fading. But for a link with a static centre frequency but with TX and/or RX in motion,
(1) the fading loss changes over time, and
(2) the frequency shift,
The complex baseband received voltage is given as
VTOT = 
VTOT = 
The second expression is rewritten with di = cτi, where di is the distance multipath component i travels. This showed us the frequency dependence of the fading channel gain, which is 20 log10 |VT OT |. Now, let’s talk about what happens when the receiver is moving. Motion causes the time delays to change, because the distance that the wave must travel is becoming either shorter or longer.
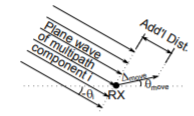
Fig 9: The plane wave of a multipath component arrives at the receiver (•).
Let the angle of arrival of component i be θi, like the one shown in Figure. (Actually, consider that multipath components will arrive with different θi.) Let’s assume I move ∆move meters in the direction θmove. We assume that these waves are effectively plane waves in the local (small) area near the antenna. Thus, the only thing that changes when I move the antenna to a new position is that the wave is lengthened (or shortened) by a factor of the distance I moved, multiplied by the cosine of the angle in between θi and my direction of motion θmove. After movement of ∆move meters in the direction θmove, VTOT becomes:
VTOT = 
One Component
First, keep things simple by considering only one arriving multipath.
VTOT = 
Let’s consider when the antenna is moving at a constant velocity v meters per second. Then, at time t, we have ∆move = vt. So,
VTOT = 
There’s a lot going on here, but we actually have not just a phase, but a complex sinusoid of
fd = - v  /
/
This is called the Doppler shift. When one sends a frequency fc, the received frequency of the signal has shifted up (or down, if fd is negative) by this factor.
Many Components
Now, each component contributes a complex sinusoid of frequency
fd = - v  /
/
The effect is frequency spreading. That is, for each frequency that is sent, many frequencies are received. In the frequency domain, the frequency content of the signal (say, S(ω)) is convolved with the Doppler spectrum VTOT (ω)). If there are diffuse multipath coming equally from all directions, then the power spectrum of VTOT can be determined to be:
S(f) = 
Key takeaway
fd = - v  /
/
This is called the Doppler shift
Q11) What are the maximum Doppler frequencies for a mobile in a vehicle on I-15, at 850 and 1950 MHz?
A11
Given 1 mile per hour = 0.447 meters per second, let’s say a maximum speed of 80 miles/hr, which gives v = 35.8 m/s. Then fm = 101 Hz, or 232 Hz, for 850 or 1950 MHz, respectively
Q12) Explain Rayleigh channel model
A12) The Rayleigh fading occurs due to multipath reception. When there are N number of scattered waves which are received at the mobile antenna than the power received by the moving antenna is a random variable. The phasor representation is shown below.
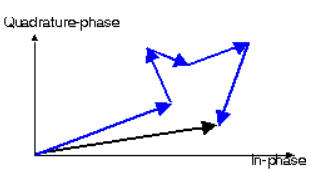
Fig 10 Phasor for Rayleigh Fading
Let Cn be the amplitude of nth reflected wave. Then the transmitted signal is
V(t) = cos(wct+ )
)
The signal received will be given as
r(t) = 
The quadrature phase component can be given as
Q(t) = 
Q13) Explain Rician fading?
A13) There is a dominant component present in this model. The component which is dominant can be a LoS (line of sight). The antenna also receives many reflected and scattered waves. The phasor sum of two or more dominant signals can also be LoS. The phasor for this is shown below.
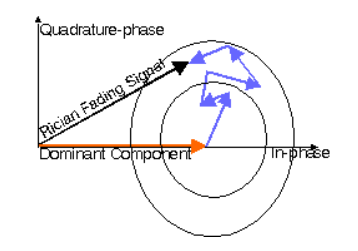
Fig 11 Phasor for Rician Fading Signal
A sinusoidal transmitted carrier is taken with narrowband propagation channel
S(t) = cos wct
The received signal from Rician path is given by
V(t) = C cos wct+
Where C= amplitude of LoS
 = amplitude of nth reflected wave
 = phase of nth reflected wave
The ratio of signal power in dominant component to the scattered power is called as Rician factor denoted by k.
Q14) Explain Nakagami fading channel?
A14) This model matches the empirical results for short wave ionospheric propagation. When Rayleigh fading signal combines with k branch maximum ratio combination the Nakagami fading is found. When there is large delay time spread for multipath scattering Nakagami fading occurs.
This fading occurs with cluster of reflected waves. The phase of individual reflected waves is different for one cluster. The envelop of each cluster is Rayleigh distributed. There can be interference when the bit time of signal is more than delay time.
The Nakagami model is equivalent to the Rician model. But it is not exactly same in all cases. This approximation holds good for the body of probability density
Q15) Explain ocumura and hata path loss model?
A15) This model has the information which is graphical based on the Okumara model. This model is used to predict the path loss in urban areas. This mode mainly has the waves which are reflected, diffracted and scattered from the obstacles. The parameters for this model are
For urban area the model is as below
LU = 69.55+26.16 logf – 13.28loghB- CH + (44.9-6.55loghB) logd
The area for which antenna height is >10m
CH = 0.8 + (1.1 logf – 0.7) hM – 1.56logf
For Large Cities
CH = 8.29(log(1.54hM))2 – 1.1 for 150MHz<f<200MHz
= 3.2(log(11.75hM))2 – 4.97 for 200MHz<f<1500MHz
LU= Path loss in Urban Areas
hB= Height of base station antenna in meters (m)
hM= Height of mobile station antenna in meters (m)
f= Frequency of Transmission in megahertz (MHz).
CH= Antenna height correction factor
The Hata model equation for suburban areas is given by
LSU = LU – 2(log )2 – 5.4
LSU = Path loss in suburban areas in decibels (dB)
LU = Average Path loss in urban areas in decibels (dB)
f = Frequency of Transmission in megahertz (MHz).
The Hata model for areas with less obstruction is
Lo = LU – 4.78(logf)2 + 18.33logf – 40.94
LO = Path loss in open area. Unit: (dB)
LU = Path loss in urban area. Unit: decibel (dB)
f = Frequency of transmission. Unit: (MHz)