Unit 4
Correlation
Question Bank
- Explain time series analysis
Definition
“ A time series is a set of observation taken at specified times, usually at equal intervals”
“A time series may be defined as a collection of reading belonging to different time periods of some economic or composite variables”..........by Ya Lun Chau
Time series establish relationship between cause and effects.
One variable is Time which is independent variable and the second data is the dependent variable.
Time series examples
- Stock price and Sensex
- Exchange rate, interest rate, inflation rate, national GDP
- Retail sales
- Electric power consumption
- Number of accident facilities
Components of time series
The change in time series is affected by economic, social, natural, industrial and political reasons. These reasons are called components of time series.
- Secular trend
- Seasonal variations
- Cyclical variation
- Irregular variation
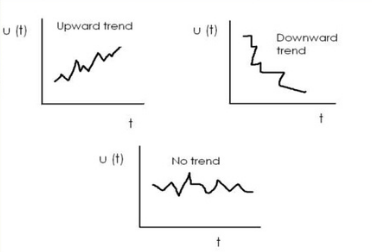
Secular trend – the increase or decrease in the movements of a time series is called secular trend. The time series may show upward trend or downward trend for a period of years.
Examples- increase in population over a period of time. Price increase over a period of time. Sale of commodity decrease over a period of time.
Seasonal variations – seasonal variations are short term fluctuations in a time series which occur periodically in a year. This continues to repeat year after year. The major factors are weather conditions and customs of people.
Examples – woollen clothes are sold more in winter than in summer season, price increases during festivals,
Cyclical variations – cyclical variations refers to recurrent upward or downward movement in a time series but the period of cycle is greater than a year. Also these variations are not regular as seasonal variations.
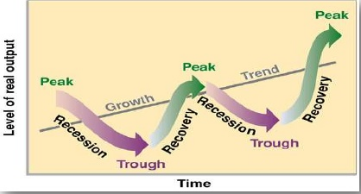
A business cycle has four phases which are prosperity, recession, depression and recovery. These four phases in a business are completed by passing one to another in this order.
Irregular variation – irregular variations are fluctuation in time series that are short in duration, erratic in nature, and follow no regularity in the occurrence pattern. This is also referring to as residual variations as it represents what is left out in time series after trend, cyclical and seasonal variations. Irregular fluctuations results due to the occurrence of unforeseen events like floods, earthquakes, famines, war.
Time series model
Additional model
Y = T+S+C+I, Where
Y = original data
T= trend value
S= seasonal fluctuations
C= cyclical fluctuations
Multiplication model
Y = T*S*C*I OR TCSI
2. Calculate linear regression analysis
Students | X | Y |
1 | 95 | 85 |
2 | 85 | 95 |
3 | 80 | 70 |
4 | 70 | 65 |
5 | 60 | 70 |
Solution
Students | X | Y | X2 | y2 | Xy |
1 | 95 | 85 | 9025 | 7225 | 8075 |
2 | 85 | 95 | 7225 | 9025 | 8075 |
3 | 80 | 70 | 6400 | 4900 | 5600 |
4 | 70 | 65 | 4900 | 4225 | 4550 |
5 | 60 | 70 | 3600 | 4900 | 4200 |
Total | 390 | 385 | 31150 | 30275 | 30500 |
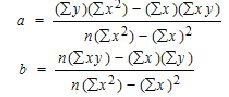
To find a and b, use the following equation

Find a:
((385 × 31150) – ((390 × 30500)) / 5 (31150) – 152100)
97750 / 3650
=26.78
Find b:
(5(30500) – (390 × 385)) / (5 (31150) – 152100)
2,350 / 3650
= .0.64
y’ = a + bx
y’ = 26.78 + .0.64x
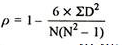
3. Find Spearman's rank correlation coefficient:
Commerce | 15 | 20 | 28 | 12 | 40 | 60 | 20 | 80 |
Science | 40 | 30 | 50 | 30 | 20 | 10 | 30 | 60 |
Solution
C | S | Rank C | Rank S | d | d2 |
15 | 40 | 2 | 6 | -4 | 16 |
20 | 30 | 3.5 | 4 | -0.5 | 0.25 |
28 | 50 | 5 | 7 | -2 | 4 |
12 | 30 | 1 | 4 | -3 | 9 |
40 | 20 | 6 | 2 | 4 | 16 |
60 | 10 | 7 | 1 | 6 | 36 |
20 | 30 | 3.5 | 4 | -0.5 | 0.25 |
80 | 60 | 8 | 8 | 0 | 0 |
|
|
|
|
| 81.5 |

R = 1 – (6*81.5)/8(82 – 1) = 0.02
4. Calculate Spearman rank-order correlation
English | 56 | 75 |
| 45 | 71 | 62 | 64 | 58 | 80 | 76 | 61 |
Maths | 66 | 70 |
| 40 | 60 | 65 | 56 | 59 | 77 | 67 | 63 |
Solution
Rank by taking the highest value or the lowest value as 1.
Here, highest value is taken as 1
English | Maths | Rank (English) | Rank (Math) | d | d2 |
56 | 66 | 9 | 4 | 5 | 25 |
75 | 70 | 3 | 2 | 1 | 1 |
45 | 40 | 10 | 10 | 0 | 0 |
71 | 60 | 4 | 7 | -3 | 9 |
62 | 65 | 6 | 5 | 1 | 1 |
64 | 56 | 5 | 9 | -4 | 16 |
58 | 59 | 8 | 8 | 0 | 0 |
80 | 77 | 1 | 1 | 0 | 0 |
76 | 67 | 2 | 3 | -1 | 1 |
61 | 63 | 7 | 6 | 1 | 1 |
|
|
|
|
| 54 |
 R = 1-(6*54)
10(102-1)
R = 0.67
Therefore this indicates a strong positive relationship between the rank’s individuals obtained in the math and English exam.
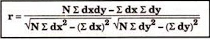
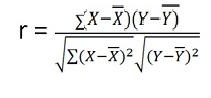
5. Calculate coefficient of correlation between X and Y series using Karl Pearson shortcut method
X | 1800 | 1900 | 2000 | 2100 | 2200 | 2300 | 2400 | 2500 | 2600 |
F | 5 | 5 | 6 | 9 | 7 | 8 | 6 | 8 | 9 |
Solution
Assumed mean of X and Y is 2200, 6
X | Y | Dx | Dx (i=100) | Dx2 | Dy | Dy2 | Dxdy |
1800 | 5 | -400 | -4 | 16 | -1.0 | 1.0 | 4.0 |
1900 | 5 | -300 | -3 | 9 | -1.0 | 1.0 | 3.0 |
2000 | 6 | -200 | -2 | 4 | 0.0 | 0.0 | 0.0 |
2100 | 9 | -100 | -1 | 1 | 3.0 | 9.0 | -3.0 |
2200 | 7 | 0 | 0 | 0 | 1.0 | 1.0 | 0.0 |
2300 | 8 | 100 | 1 | 1 | 2.0 | 4.0 | 2.0 |
2400 | 6 | 200 | 2 | 4 | 0 | 0 | 0.0 |
2500 | 8 | 300 | 3 | 9 | 2 | 4 | 6.0 |
2600 | 9 | 400 | 4 | 16 | 3 | 9 | 12.0 |
|
|
|
|
|
|
|
|
|
|
| 0 | 60 | 9 | 29 | 24 |
Note – we can also proceed dividing x/100
 r = (9)(24) – (0)(9)
√9*60-(0)2 √9*29– (9)2
r = 0.69
6. Calculate coefficient of correlation between X and Y series using Karl Pearson shortcut method
X | 14 | 12 | 14 | 16 | 16 | 17 | 16 | 15 |
Y | 13 | 11 | 10 | 15 | 15 | 9 | 14 | 17 |
Solution
Let assumed mean for X = 15, assumed mean for Y = 14
X | Y | Dx | Dx2 | Dy | Dy2 | Dxdy |
14 | 13 | -1.0 | 1.0 | -1.0 | 1.0 | 1.0 |
12 | 11 | -3.0 | 9.0 | -3.0 | 9.0 | 9.0 |
14 | 10 | -1.0 | 1.0 | -4.0 | 16.0 | 4.0 |
16 | 15 | 1.0 | 1.0 | 1.0 | 1.0 | 1.0 |
16 | 15 | 1.0 | 1.0 | 1.0 | 1.0 | 1.0 |
17 | 9 | 2.0 | 4.0 | -5.0 | 25.0 | -10.0 |
16 | 14 | 1 | 1 | 0 | 0 | 0 |
15 | 17 | 0 | 0 | 3 | 9 | 0 |
120 | 104 | 0 | 18 | -8 | 62 | 6 |
 r = 8 *6 – (0)*(-8)
√8*18-(0)2 √8*62 – (-8)2
r = 48/√144*√432 = 0.19
7. Compute correlation coefficient from the following data
Hours of sleep (X) | Test scores (Y) |
8 | 81 |
8 | 80 |
6 | 75 |
5 | 65 |
7 | 91 |
6 | 80 |
Solution-
X | Y |  |  |  |  |
 |
8 | 81 | 1.3 | 1.8 | 2.3 | 5.4 | 3.1 |
8 | 80 | 1.3 | 1.8 | 1.3 | 1.8 | 1.8 |
6 | 75 | -0.7 | 0.4 | -3.7 | 13.4 | 2.4 |
5 | 65 | -1.7 | 2.8 | -13.7 | 186.8 | 22.8 |
7 | 91 | 0.3 | 0.1 | 12.3 | 152.1 | 4.1 |
6 | 80 | -0.7 | 0.4 | 1.3 | 1.8 | -0.9 |
40 | 472 |
| 7 |
| 361 | 33 |

X = 40/6 =6.7

Y = 472/6 = 78.7
r = (33)/√7 √361 = (33)/(2.64*19) = 0.66
Thus Correlation coefficient is positively correlated
8. Compute Pearson’s coefficient of correlation between advertisement cost and sales as per the data given below:
Advertisement cost | 39 | 65 | 62 | 90 | 82 | 75 | 25 | 98 | 36 | 78 |
Sales | 47 | 53 | 58 | 86 | 62 | 68 | 60 | 91 | 51 | 84 |
Solution
X | Y |  |  |  |  |
 |
39 | 47 | -26 | 676 | -19 | 361 | 494 |
65 | 53 | 0 | 0 | -13 | 169 | 0 |
62 | 58 | -3 | 9 | -8 | 64 | 24 |
90 | 86 | 25 | 625 | 20 | 400 | 500 |
82 | 62 | 17 | 289 | -4 | 16 | -68 |
75 | 68 | 10 | 100 | 2 | 4 | 20 |
25 | 60 | -40 | 1600 | -6 | 36 | 240 |
98 | 91 | 33 | 1089 | 25 | 625 | 825 |
36 | 51 | -29 | 841 | -15 | 225 | 435 |
78 | 84 | 13 | 169 | 18 | 324 | 234 |
650 | 660 |
| 5398 |
| 2224 | 2704 |
|
|
|
|
|
|
|

r = (2704)/√5398 √2224 = (2704)/(73.2*47.15) = 0.78
Thus Correlation coefficient is positively correlated
9. How to find a linear regression equation
Subject | X | Y |
1 | 43 | 99 |
2 | 21 | 65 |
3 | 25 | 79 |
4 | 42 | 75 |
5 | 57 | 87 |
6 | 59 | 81 |
|
|
|
Solution
Subject | X | Y | Xy | X2 | Y2 |
1 | 43 | 99 | 4257 | 1849 | 9801 |
2 | 21 | 65 | 1365 | 441 | 4225 |
3 | 25 | 79 | 1975 | 625 | 6241 |
4 | 42 | 75 | 3150 | 1764 | 5625 |
5 | 57 | 87 | 4959 | 3249 | 7569 |
6 | 59 | 81 | 4779 | 3481 | 6521 |
Total | 247 | 486 | 20485 | 11409 | 40022 |
To find a and b, use the following equation

Find a:
((486 × 11,409) – ((247 × 20,485)) / 6 (11,409) – 247*247)
484979 / 7445
=65.14
Find b:
(6(20,485) – (247 × 486)) / (6 (11409) – 247*247)
(122,910 – 120,042) / 68,454 – 2472
2,868 / 7,445
= .385225
y’ = a + bx
y’ = 65.14 + .385225x
10. Given below are five observation collected in simple regression. Calculate the intercept, slope and write down the estimated regression equation
X | Y |
2 | 7 |
4 | 5 |
6 | 4 |
8 | 2 |
10 | 1 |
Solution
X | Y | X2 | y2 | Xy |
2 | 7 | 4 | 49 | 14 |
4 | 5 | 16 | 25 | 20 |
6 | 4 | 36 | 16 | 24 |
8 | 2 | 64 | 4 | 16 |
10 | 1 | 100 | 1 | 10 |
30 | 19 | 220 | 95 | 84 |
To find a and b, use the following equation
Find a:
((19 × 220) – ((30 × 84)) / 5 (220) – 900)
1660/ 200
=8.3
Find b:
(5(84) – (30 × 19)) / (5 (220) – 900)
-150 / 200
= -0.75
y’ = a + bx
y’ = 8.3 + (-0.75)x


