Unit 3
Virtual Instrumentation
Q1. What is virtual instrumentation?
Sol:
Virtual instrumentation combines mainstream commercial technologies. such as C, with flexible software and a wide variety of measurement and control hardware, so engineers and scientists can create user-defined systems that meet their exact application needs. With virtual instrumentation, engineers and scientists reduce development time, design higher quality products, and lower their design costs.
Q2. Explain the graphical programming techniques?
Sol:
LabVIEW is a graphical programming language that uses icons instead of lines of text to create applications. In contrast to text-based programming languages, where instructions determine program execution, LabVIEW uses dataflow programming, where the flow of data determines execution order.
LabVIEW programs are called virtual instruments (VIs). Controls are inputs and indicators are outputs.
Each VI contains three main parts:
•Front Panel – How the user interacts with the VI.
•Block Diagram – The code that controls the program.
•Icon/Connector – Means of connecting a VI to other VIs.
In LabVIEW, you build a user interface by using a set of tools and objects. The user interface is known as the front panel. You then add code using graphical representations of functions to control the front panel objects. The block diagram contains this code. In some ways, the block diagram resembles a flowchart
Users interact with the Front Panel when the program is running. Users can control the program, change inputs, and see data updated in real-time.
Controls are used for inputs such as adjusting a slide control to set an alarm value, turning a switch on or off, or to stop a program. Indicators are used as outputs. Thermometers, lights, and other indicators display output values from the program. These may include data, program states, and other information. Every front panel control or indicator has a corresponding terminal on the block diagram. When a VI is run, values from controls flow through the block diagram, where they are used in the functions on the diagram, and the results are passed into other functions or indicators through wires.
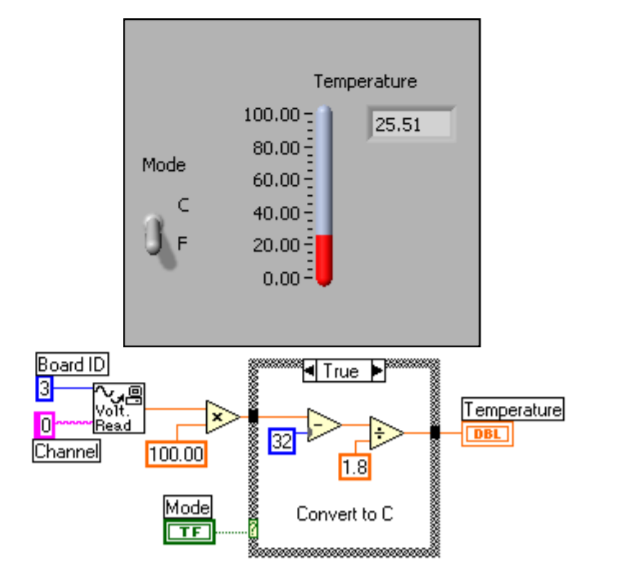
LABVIEW
If you see the diagram
Front Panel
Controls = Inputs
Indicators = Outputs
Block Diagram
Accompanying “program” for the front panel
Components “wired” together
Q3. Explain the different data types?
Sol:
Boolean:
Boolean data types consist of only two values i.e. true and false. It is a logical data type providing the output in the form of 0 or 1 specifying false and true respectively. The Boolean data type is indicated by green data wires. LabView stores the Boolean data as 8-bit values.
Numeric:
Numeric data types are represented as floating-point numbers, complex numbers, signed-unsigned integers, and fixed-point numbers. All the Integers either signed or Unsigned are indicated by blue data wires.
Strings:
Any sequence of displayable and non-displayable ASCII characters data is known as Strings data type.
Array:
Arrays can be distinguished as a group of specific data types. They are determined by thicker data wires. In an array, we can store numeric, string, double, or even Boolean data types.
Q4. Explain cluster?
Sol:
Clusters are the data type which consists of different type of data in a single unit that combines Boolean, numeric, and string in a single value. This data type is indicated by thicker brown color data wire.
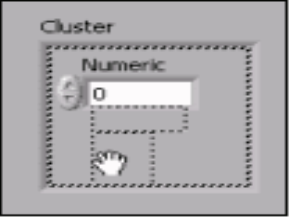
Creating a cluster is similar to creating an array. You can add the cluster shell on the front panel. Furthermore, you can add the data objects by simply dragging the elements which can be numeric, Boolean, or any other data types.
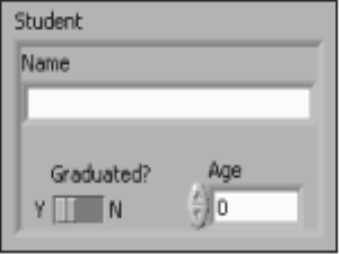
In the above figure, we can see the cluster containing three data types: a string, a Boolean switch, and a numeric.
Error cluster:
Error clusters are a special type of cluster, which is used to provide warnings and error messages. Error clusters are denoted by a dark yellow data wire pattern.
Error clusters are constructed from Boolean status, a string source, and a numeric error code.
The error cluster has two functions i.e. Error In the function which is used to detect the error in the function and Error out Function which is used to return the error information to the users and stop the execution of the program.
Q5. What are the advantages of virtual instrumentation?
Sol:
Advantages of virtual instrumentation
Q6. Explain the concept of while loop?
Sol:
While loop:
A while loop is a structure to execute a block of code repeatedly until a given condition is met. When the VI runs, the code inside the While Loop executes, and then the terminal condition is evaluated.
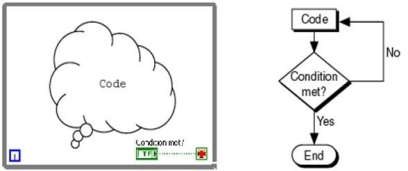
Unlike a For Loop, While Loop execution does not depend on iteration count; thus, a While Loop executes indefinitely if the condition never occurs.
Q7. Explain the concept of for loop?
Sol:
for loop is a structure you use to execute a block of code a set number of times. When the VI runs, the iteration count is evaluated, and then the code is executed.
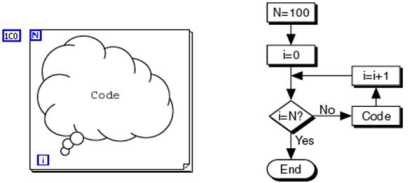
A For Loop can be configured to conditionally stop code execution in addition to its iteration-based exit. In these cases, the code will execute until the count terminal setting is reached or the condition is met.
Q8. What is a graph?
Sol:
Graphs display only the most recent array of values written to them and do not have a history of data. Graphs and charts differ in the way they display and update data. VIs with graphs usually collect the data in an array and then plot the data to the graph, which is like a spreadsheet that first stores the data then generates a plot of it. In contrast, a chart appends new data points to those already in the display. On a chart, the current reading or measurement in context with data previously acquired can be viewed.
Q9. Explain structure?
Sol:
Contains one or more subdiagrams, or cases, exactly one of which executes when the structure executes. The value wired to the case selector determines which case to execute.

Components of a Case Structure
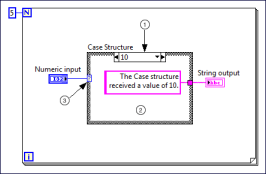
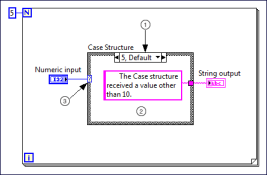
Selector label—Displays the value(s) for which the associated case executes. You can specify a single value or a range of values. The selector label to specify the default case.
Sub-diagram(case)—Contains the code that executes when the value wired to the case selector matches the value that appears in the selector label
Case selector—Selects which case to execute based on the value of the input data. The input data can be a Boolean, string, integer, enumerated type, or error cluster
Q10. What is Formula Nodes?
Sol:
It is a software that is convenient, the text-based node you can use to perform complicated mathematical operations on a block diagram using the C- syntax structure. It is most useful for equations that have many variables
The text-based code simplifies the block diagram and increases its readability.

Figure. Formula Nodes