Unit - 5
Pattern Recognition
Q1) What is an expert system shell?
A1) Expert systems which embody some non-algorithmic expertise for solving certain types of problems. Expert systems have a number of major system components and interface with individuals who interact with the system in various roles. These are illustrated below. Components
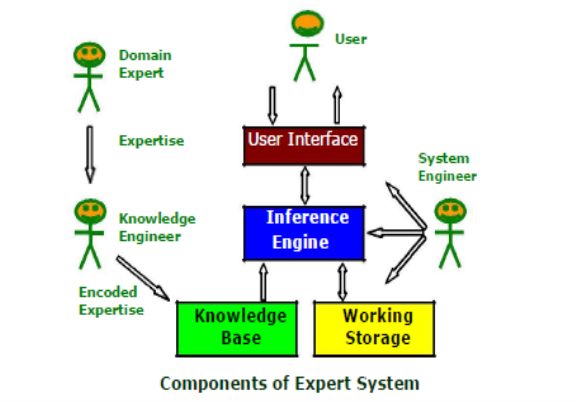
Components and Interfaces
‡ Knowledge base: A declarative representation of the expertise; often in IF THEN rules;
‡ Working storage: The data which is specific to a problem being solved;
‡ Inference engine: The code at the core of the system which derives recommendations from the knowledge base and problem-specific data in working storage;
‡ User interface: The code that controls the dialog between the user and the system.
Roles of Individuals who interact with the system
‡ Domain expert: The individuals who currently are experts in
Solving the problems; here the system is intended to solve;
‡ Knowledge engineer: The individual who encodes the expert's
Knowledge in a declarative form that can be used by the expert system;
‡ User: The individual who will be consulting with the system to get advice which would have been provided by the expert.
Q2) Explain in detail about Expert system shells?
A2) Expert System Shells Many expert systems are built with products called expert system shells. A shell is a piece of software which contains the user interface, a format for declarative knowledge in the knowledge base, and an inference engine. The knowledge and system engineers use these shells in making expert systems.
‡ Knowledge engineer: uses the shell to build a system for a particular problem domain.
‡ System engineer: builds the user interface, designs the declarative format of the knowledge base, and implements the inference engine.
Depending on the size of the system, the knowledge engineer and the system engineer might be the same person.
Q3) Explain in details about Expert System Features?
A3) The features which commonly exist in expert systems are:
■ Goal Driven Reasoning or Backward Chaining
An inference technique which uses IF-THEN rules to repetitively break a goal into smaller sub-goals which are easier to prove;
■ Coping with Uncertainty
The ability of the system to reason with rules and data which are not precisely known;
■ Data Driven Reasoning or Forward Chaining
An inference technique which uses IF-THEN rules to deduce a problem solution from initial data;
■Data Representation
The way in which the problem specific data in the system is stored and accessed;
■User Interface
That portion of the code which creates an easy-to-use system;
■Explanations
The ability of the system to explain the reasoning process that it used to reach a recommendation
Q4) Explain in details about Goal Driven Reasoning?
A4) Goal-driven reasoning, or backward chaining, is an efficient way to solve problems. The algorithm proceeds from the desired goal, adding new assertions found.

The knowledge is structured in rules which describe how each of the possibilities might be selected.
The rule breaks the problem into sub-problems.
Example:
KB contains Rule set:
Rule 1: If A and C Then F
Rule 2: If A and E Then G
Rule 3: If B Then E
Rule 4: If G Then D
Problem: Prove
If A and B true Then D is true.
Q5) Explain in details about Data Driven Reasoning?
A5) The data driven approach, or Forward chaining, uses rules similar to those used for backward chaining. However, the inference process is different. The system keeps track of the current state of problem solution and looks for rules which will move that state closer to a final solution. The algorithm proceeds from a given situation to a desired goal, adding new assertions found.

The knowledge is structured in rules which describe how each of the possibilities might be selected. The rule breaks the problem into sub-problems.
Example:
KB contains Rule set:
Rule 1: If A and C Then F
Rule 2: If A and E Then G
Rule 3: If B Then E
Rule 4: If G Then D
Problem: Prove
If A and B true Then D is true.
Q6) How to use the parameters for machine translation?
A6)
i. Segment into sentences
Ii. Estimate the French language model
Iii. Align sentences
Iv. Estimate the initial fertility model
v. Estimate the initial word choice model
Vi. Estimate the initial offset model
Vii. Improve all the estimates.
Q7) Give the classification of learning process?
A7)
The learning process can be classified as:
Process which is based on coupling new information to previously acquired knowledge
a. Learning by analyzing differences.
b. Learning by managing models.
c. Learning by correcting mistakes.
d. Learning by explaining experience.
Process which is based on digging useful regularity out of data, usually called as Data base mining:
a. Learning by recording cases.
b. Learning by building identification trees.
c. Learning by training neural networks.
Q8) Explain Pattern recognition?
A8) Pattern recognition is the process of recognizing patterns by using machine learning algorithm. Pattern recognition can be defined as the classification of data based on knowledge already gained or on statistical information extracted from patterns and/or their representation. One of the important aspects of the pattern recognition is its application potential.
Examples: Speech recognition, speaker identification, multimedia document recognition (MDR), automatic medical diagnosis.
In a typical pattern recognition application, the raw data is processed and converted into a form that is amenable for a machine to use.
Pattern recognition involves classification and cluster of patterns.
- In classification, an appropriate class label is assigned to a pattern based on an abstraction that is generated using a set of training patterns or domain knowledge. Classification is used in supervised learning.
- Clustering generated a partition of the data which helps decision making, the specific decision-making activity of interest to us. Clustering is used in an unsupervised learning.
Pattern recognition possesses the following features:
- Pattern recognition system should recognize familiar pattern quickly and accurate
- Recognize and classify unfamiliar objects
- Accurately recognize shapes and objects from different angles
- Identify patterns and objects even when partly hidden
Recognize patterns quickly with ease, and with automaticity.
Q9) What do you mean by Statistical Approach.?
A9)
Statistical methods are mathematical formulas, models, and techniques that are used in the statistical analysis of raw research data. The application of statistical methods extracts information from research data and provides different ways to assess the robustness of research outputs.
Two main statistical methods are as follows.
- Descriptive Statistics: It summarizes data from a sample using indexes such as the mean or standard deviation.
- Inferential Statistics: It draw conclusions from data that are subject to random variation.
Structural Approach
The Structural Approach is a technique wherein the learner masters the pattern of sentence. Structures are the different arrangements of words in one accepted style or the other.
Types of structures
- Sentence Patterns
- Phrase Patterns
- Formulas
- Idioms
Q10) Difference Between Statistical Approach and Structural Approach.?
A10)
Sr. No. Statistical Approach Structural Approach
1 Statistical decision theory. Human perception and cognition.
2 Quantitative features. Morphological primitives
3 Fixed number of features. Variable number of primitives.
4 Ignores feature relationships. Captures primitive’s relationships.
5 Semantics from feature position. Semantics from primitives encoding.
6 Statistical classifiers. Syntactic grammars.
Q11) What is Principle Component Analysis (PCA)?
A11) PCA is a technique in unsupervised machine learning that is used to minimize dimensionality. The key idea of the vital component analysis (PCA) is to minimize the dimensionality of a data set consisting of several variables, either firmly or lightly, associated with each other while preserving to the maximum degree the variance presents in the dataset.
This is achieved by translating the variables into a new collection of variables that are a mixture of our original dataset’s variables or attributes so that maximum variance is preserved. This attribute combination is known as Principal Components (PCs), and the Dominant Principal Component is called the component that has the most variance captured. The order of variance retention decreases as we step down in order, i.e., PC1 > PC2 > PC3 > … and so forth.
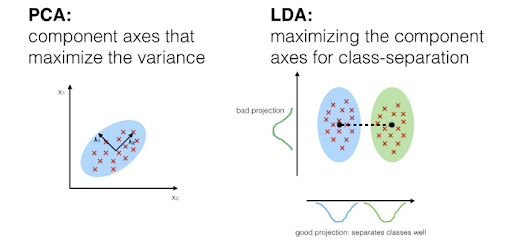
Practically PCA is used for two reasons.
- Dimensionality Reduction: Information spread over many columns is converted into main components (PCs) such that the first few PCs can clarify a substantial chunk of the total information (variance). In Machine Learning models, these PCs can be used as explanatory variables.
- Visualize classes: It is difficult for data with more than three dimensions (features) to visualize the separation of classes (or clusters). With the first two PCs alone, a simple distinction can generally be observed.
Q12) Explain Linear Discriminant Analysis (LDA)?
A12) LDA is a technique of supervised machine learning which is used by certified machine learning experts to distinguish two classes/groups. The critical principle of linear discriminant analysis (LDA) is to optimize the separability between the two classes to identify them in the best way we can determine. LDA is similar to PCA, which helps minimize dimensionality. Still, by constructing a new linear axis and projecting the data points on that axis, it optimizes the separability between established categories.
LDA does not function on finding the primary variable it merely looks at what kind of point/features/subspace to distinguish the data offers further discrimination.
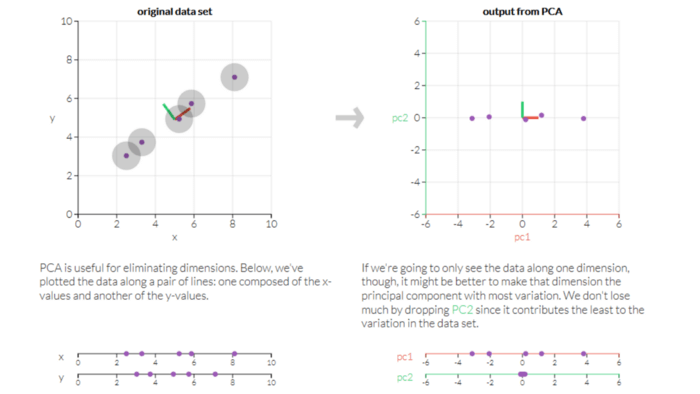
Some of the practical LDA applications are described below.
- Face Recognition-In face recognition, LDA is used to reduce the number of attributes until the actual classification to a more manageable number. A linear combination of pixels that forms a template is the dimensions that are created. Fisher’s faces are called these.
- Medical-LDA may be used to identify the illness of the patient as mild, moderate, or extreme. The classification is carried out on the patient’s different criteria and his medical trajectory.
- Customer Identification– By conducting a simple question and answering a survey, you can obtain customers’ characteristics. LDA helps to recognize and pick the assets of a group of consumers most likely to purchase a specific item in a shopping mall.
Q13) What are PCA and LDA Similarities?
A13)
- Both list the current axes in order of significance.
- PC1 (the first new axis generated by PCA) accounts for the most significant data variance, PC2 (the second new axis) does the second-best job, and so on.
- LD1 (the first new axis generated by LDA) accounts for the most significant data variance, LD2 (the second new axis) does the second-best job, and so on.
- The algorithms both tell us which attribute or function contributes more to the development of the new axes.
- LDA is like PCA, each attempting to decrease the measurements.
- For the most variation, PCA searches for attributes.
- LDA seeks to optimize the differentiation of groups that are identified.
Note- The main difference is that LDA takes into class labels into account, where PCA is unsupervised and does not.
Q14) Define K-Nearest Neighbour (KNN) Algorithm.?
A14)
K-Nearest Neighbor is one of the simplest Machine Learning algorithms based on Supervised Learning technique.
- K-NN algorithm assumes the similarity between the new case/data and available cases and put the new case into the category that is most similar to the available categories.
- K-NN algorithm stores all the available data and classifies a new data point based on the similarity. This means when new data appears then it can be easily classified into a well suite category by using K- NN algorithm.
- K-NN algorithm can be used for Regression as well as for Classification but mostly it is used for the Classification problems.
- K-NN is a non-parametric algorithm, which means it does not make any assumption on underlying data.
- It is also called a lazy learner algorithm because it does not learn from the training set immediately instead it stores the dataset and at the time of classification, it performs an action on the dataset.
- KNN algorithm at the training phase just stores the dataset and when it gets new data, then it classifies that data into a category that is much similar to the new data.
- Example: Suppose, we have an image of a creature that looks similar to cat and dog, but we want to know either it is a cat or dog. So, for this identification, we can use the KNN algorithm, as it works on a similarity measure. Our KNN model will find the similar features of the new data set to the cats and dog’s images and based on the most similar features it will put it in either cat or dog category.
Q15) Define Support Vector Machine (SVM)?
A15) Support Vector Machine or SVM is one of the most popular Supervised Learning algorithms, which is used for Classification as well as Regression problems. However, primarily, it is used for Classification problems in Machine Learning.
The goal of the SVM algorithm is to create the best line or decision boundary that can segregate n-dimensional space into classes so that we can easily put the new data point in the correct category in the future. This best decision boundary is called a hyperplane.
SVM chooses the extreme points/vectors that help in creating the hyperplane. These extreme cases are called as support vectors, and hence algorithm is termed as Support Vector Machine. Consider the below diagram in which there are two different categories that are classified using a decision boundary or hyperplane.
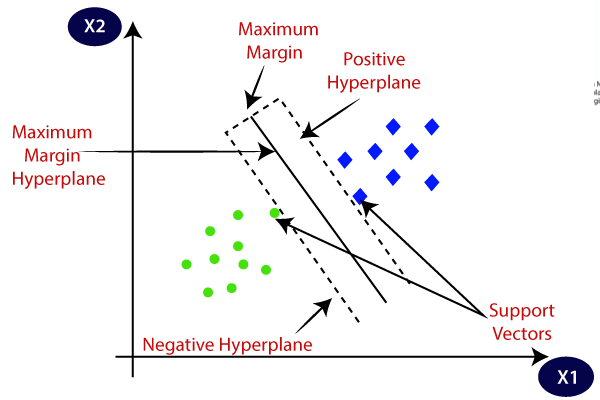
Note- SVM algorithm can be used for Face detection, image classification, text categorization, etc.
SVM can be of two types:
- Linear SVM: Linear SVM is used for linearly separable data, which means if a dataset can be classified into two classes by using a single straight line, then such data is termed as linearly separable data, and classifier is used called as Linear SVM classifier.
- Non-linear SVM: Non-Linear SVM is used for non-linearly separated data, which means if a dataset cannot be classified by using a straight line, then such data is termed as non-linear data and classifier used is called as Non-linear SVM classifier
Q16) Define K – means clustering?
A16)
K-Means Clustering is an unsupervised learning algorithm that is used to solve the clustering problems in machine learning or data science. In this topic, we will learn what is K-means clustering algorithm, how the algorithm works, along with the Python implementation of k-means clustering.
K-Means Algorithm
K-Means Clustering is an Unsupervised Learning algorithm, which groups the unlabeled dataset into different clusters. Here K defines the number of pre-defined clusters that need to be created in the process, as if K=2, there will be two clusters, and for K=3, there will be three clusters, and so on.
It allows us to cluster the data into different groups and a convenient way to discover the categories of groups in the unlabeled dataset on its own without the need for any training.
It is a centroid based algorithm, where each cluster is associated with a centroid. The main aim of this algorithm is to minimize the sum of distances between the data point and their corresponding clusters.
The algorithm takes the unlabeled dataset as input, divides the dataset into k-number of clusters, and repeats the process until it does not find the best clusters. The value of k should be predetermined in this algorithm
The k-means clustering algorithm mainly performs two tasks.
1. Determines the best value for K center points or centroids by an iterative process.
2. Assigns each data point to its closest k-center. Those data points which are near to the particular k-center, create a cluster.
Hence each cluster has data points with some commonalities, and it is away from other clusters.
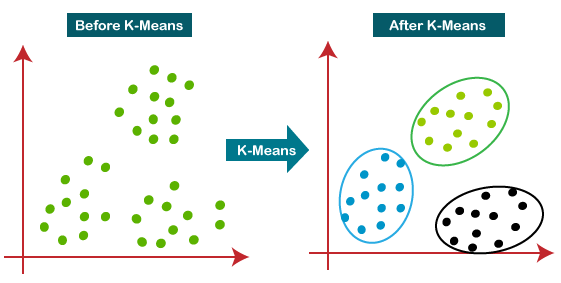
Fig- Working of the K-means Clustering Algorithm:
Q17) How does K-Means Algorithm Works?
A17)
Step-1: Select the number K to decide the number of clusters.
Step-2: Select random K points or centroids. (It can be other from the input dataset).
Step-3: Assign each data point to their closest centroid, which will form the predefined K clusters.
Step-4: Calculate the variance and place a new centroid of each cluster.
Step-5: Repeat the third steps, which means reassign each datapoint to the new closest centroid of each cluster.
Step-6: If any reassignment occurs, then go to step-4 else go to FINISH.
Step-7: The model is ready.
Q18) What is Neural Network?
A18) A neural network is an interconnected group of neurons.
- The prime examples are biological neural networks, especially the human brain.
- In modern usage the term most often refers to ANN (Artificial Neural Networks) or neural nets for short.
- An Artificial Neural Network is a mathematical or computational model for information processing based on a connections approach to computation.
- It involves a network of relatively simple processing elements, where the global behavior is determined by the connections between the processing elements and element parameters.
- In a neural network model, simple nodes (neurons or units) are connected together to form a network of nodes and hence the term “Neural Network”
The biological neuron Vs Artificial neuron: Biological Neuron:
The brain is a collection of about 10 million interconnected neurons shown in following figure
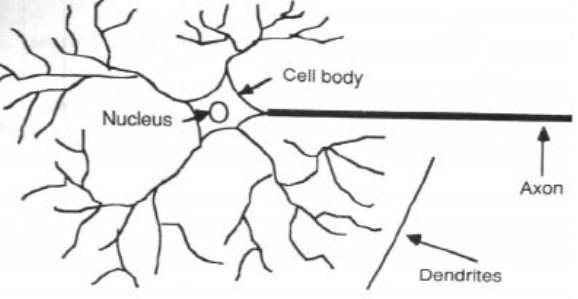
- Each neuron is a cell that uses biochemical reactions to receive, process and transmit information.
- A neurons dendrites tree is connected to a thousand neighboring neurons.
- When one of those neurons fire, a positive or negative charge is received by one of the dendrites.
- The strengths of all the received charges are added together through the processes of spatial and temporal summation.
- Spatial summation occurs when several weak signals are converted into a single large one, while temporal summation converts a rapid series of weak pulses from one source into one large signal.
- The aggregate input is then passed to the soma (cell body).
- The soma and the enclosed nucleus don’t play a significant role in the processing of incoming and outgoing data.
Q19) What is Feed-Forward network?
A19)
- A feed-forward network represents a function of its current input; thereby it has no internal state other than the weights themselves.
- Consider the following network, which has two hidden input units and an output unit.
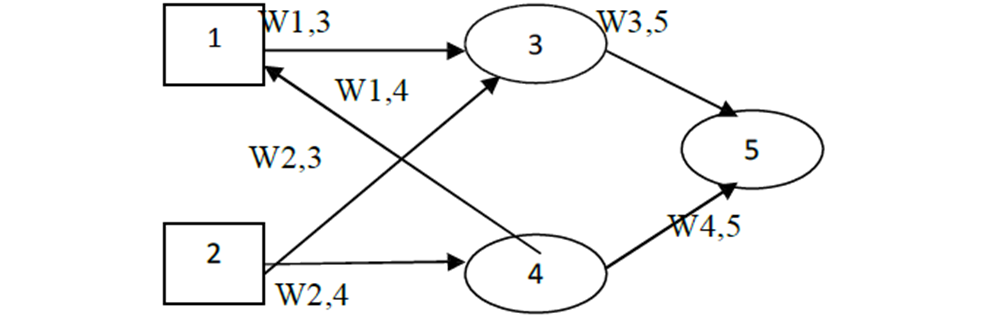
Given an input vector x = (x1, x2), the activations of the input units are set to (a1, a2) = (x1, x2) and the network computes
a5 g (W3, 5a3 W4, 5a4) g (W3, 5g (W1, 3a1 W2, 3a2) W4, 5g (W1, 4a1 W2, 4a2))
Single Layer feed-forward network:
- A single layer network has one layer of connection weights.
- The following figure shows the single layer feed forward network

- The units can be distinguished as input units, which receive signals from the outside world, and output units, from which the response of the network can be read.
- The input units are fully connected to output units but are not connected to other input units.
- They are generally used for pattern classification.
Multi-Layer feed-forward network:
- A multi-layer network with one or more layers of nodes called hidden nodes.
- Hidden nodes connected between the input units and the output units.
- The below figure shows the multilayer feed-forward network.
- Typically, there is a layer of weights between two adjacent levels of units.
- The network structure has 3 input layer, 4 hidden layer and 2 output layers.
- Multilayer network can solve more complicated problems than single layer networks.
- In this network training may be more difficult.