UNIT 2
IMAGE ENHANCEMENT
Q1) What is Image Enhancement?
A1)
The main objective of Image Enhancement is to process the given image into a more suitable form for a specific application. It makes an image more noticeable by enhancing the features such as edges, boundaries, or contrast. While enhancement, data does not increase, but the dynamic range is increased of the chosen features by which it can be detected easily.
In image enhancement, the difficulty arises to quantify the criterion for enhancement for which enhancement techniques are required to obtain satisfying results.
Q2) Name the categories of Image Enhancement and explain?
A2)
There are two types of Image enhancement methods:
- Spatial domain technique
- Frequency domain technique
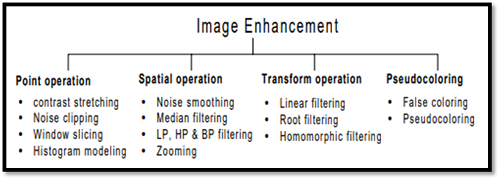
Fig – Image enhancement
Spatial domain enhancement methods
Spatial domain techniques are performed on the image plane, and they directly manipulate the pixel of the image.
Operations are formulated as:
g(x,y) = T[f(x, y)]
Where g is the output image, f is the input image, and T is an operation
Spatial domain techniques are further divided into 2 categories:
- Point operations (linear operation)
- Spatial operations (non-linear operation)
Frequency domain enhancement methods
Frequency domains enhance an image by following complex linear operators.
G(w1, w2) = F(w1, w2) H(w1, w2)
Image enhancement can also be done through Gray Level Transformation.
Q3) What is the concept of the mask and what are the types of filters?
A3)
The concept of a mask is also known as spatial filtering. Mask is a type of filter which operates directly on the image. The filter mask is also known as a convolution mask.
To apply a mask to an image, the filter mask is moved from point to point on the image. In the original image, at each point(X, Y), the filter is calculated by using a predefined relationship.
There are two types of filters:
- Linear filter
- Frequency domain filter
Linear filter
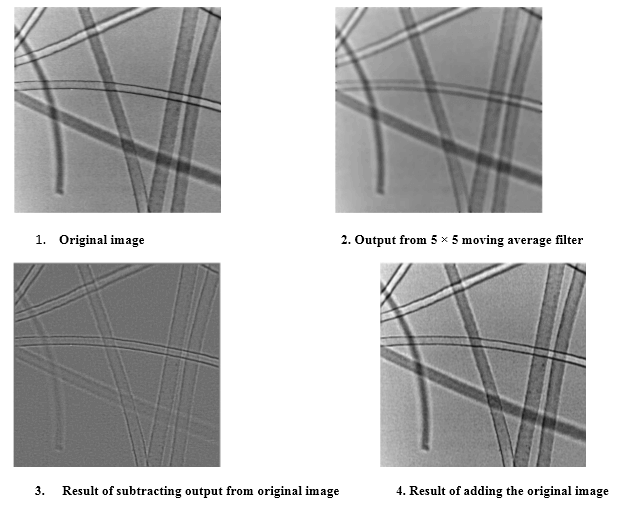
A linear filter is the simplest filter. In a linear filter, each pixel is replaced by the average of these pixel values. The entire linear filter works in the same way except when the weighted average is formed instead of a simple average.
The formula for a linear filter

Example:

Frequency Domain Filter
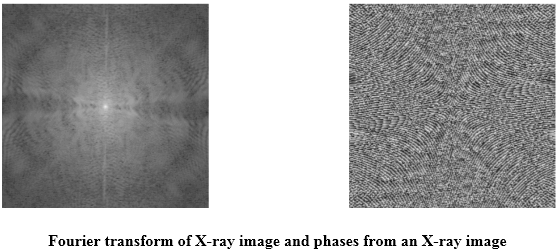
In frequency domain filter, an image is represented as the sum of many sine waves that have different frequencies, amplitudes, and directions. The parameter of sine waves is referred to as Fourier coefficients.
Reasons for using this approach:
- For getting extra insight.
- Linear filters can also in the frequency domain use Fast Fourier Transform (FFT)
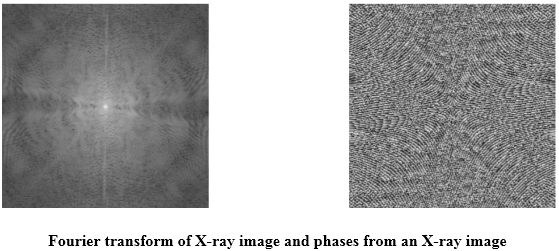
Filters are used for 2 purposes:
- Blurring and noise reduction.
- Edge detection and sharpness.
Blurring and noise reduction
Filters can be used for blurring as well as noise reduction from an image. Blurring is used to remove small details from an image. Noise reduction can also be done with the help of blurring.
Commonly used masks for blurring are:
- Box filter
- Weighted average filter
Edge Detection and sharpness
Filters can be used for edge detection and sharpness. To increase the sharpness of an image, edge detection is used.
Q4) Write an application of Histograms?
A4)
Applications of Histograms
- In digital image processing, histograms are used for simple calculations in software.
- It is used to analyze an image. Properties of an image can be predicted by the detailed study of the histogram.
- The brightness of the image can be adjusted by having the details of its histogram.
- The contrast of the image can be adjusted according to the need by having details of the x-axis of a histogram.
- It is used for image equalization. Gray level intensities are expanded along the x-axis to produce a high contrast image.
- Histograms are used in thresholding as it improves the appearance of the image.
- If we have an input and output histogram of an image, we can determine which type of transformation is applied in the algorithm.
Q5) Explain histogram processing techniques
A5)
Histogram Processing Techniques
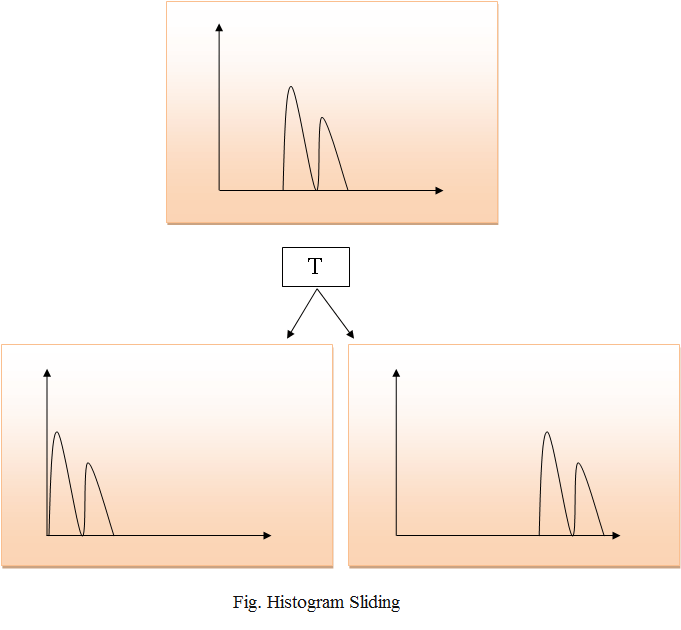
Histogram Sliding
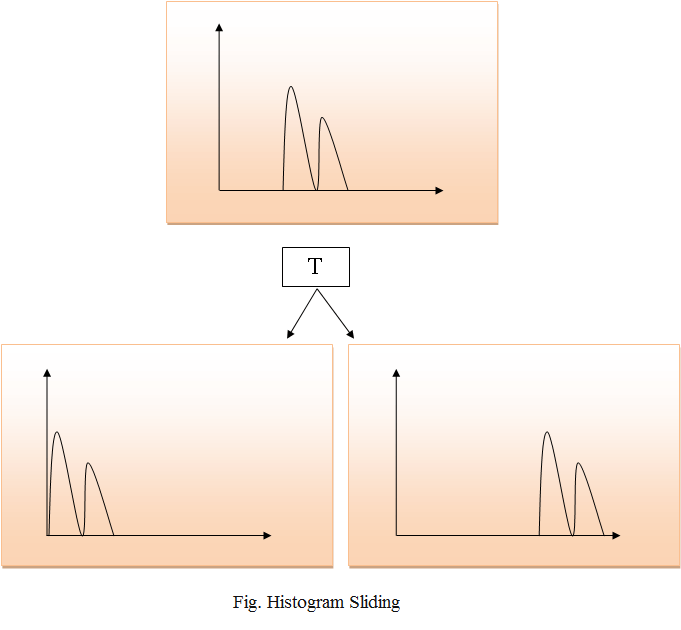
In Histogram sliding, the complete histogram is shifted towards rightwards or leftwards. When a histogram is shifted towards the right or left, clear changes are seen in the brightness of the image. The brightness of the image is defined by the intensity of light that is emitted by a particular light source.
Histogram Stretching
In histogram stretching, the contrast of an image is increased. The contrast of an image is defined between the maximum and minimum value of pixel intensity.
If we want to increase the contrast of an image, the histogram of that image will be fully stretched and covered the dynamic range of the histogram.
From the histogram of an image, we can check that the image has low or high contrast.

Histogram Equalization
Histogram equalization is used for equalizing all the pixel values of an image. Transformation is done in such a way that a uniformly flattened histogram is produced.
Histogram equalization increases the dynamic range of pixel values and makes an equal count of pixels at each level which produces a flat histogram with high contrast image.
While stretching histogram, the shape of the histogram remains the same whereas in Histogram equalization, the shape of histogram changes and it generates only one image.

Q6) What is the Relationship with the CCD array?
A6)
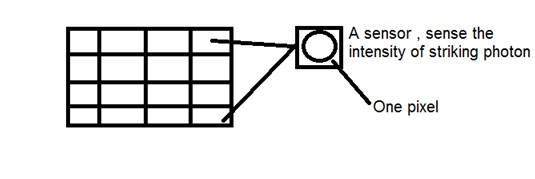
We have seen that how an image is formed in the CCD array. So a pixel can also be defined as
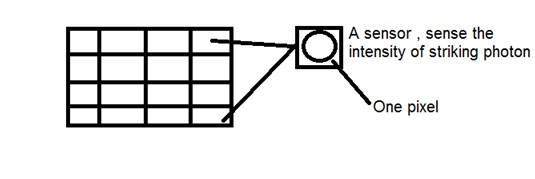
The smallest division the CCD array is also known as a pixel.
Each division of the CCD array contains the value against the intensity of the photon striking it. This value can also be called a pixel.
Calculation of total number of pixels
We have defined an image as a two-dimensional signal or matrix. Then in that case the number of PEL would be equal to the number of rows multiplied by some columns.
This can be mathematically represented as below:
Total number of pixels = number of rows ( X ) number of columns
Or we can say that the number of (x,y) coordinate pairs make up the total number of pixels.
We will look in more detail in the tutorial of image types, that how do we calculate the pixels in a color image.
Gray level
The value of the pixel at any point denotes the intensity of the image at that location, and that is also known as the gray level.
We will see in more detail the value of the pixels in the image storage and bits per pixel tutorial, but for now, we will just look at the concept of only one-pixel value.
Pixel value.(0)
As has already been define at the beginning of this tutorial, that each pixel can have only one value and each value denotes the intensity of light at that point of the image.
We will now look at a very unique value 0. The value 0 means the absence of light. It means that 0 denotes dark, and it further means that whenever a pixel has a value of 0, it means at that point, the black color would be formed.
Have a look at this image matrix
0 | 0 | 0 |
0 | 0 | 0 |
0 | 0 | 0 |
Now this image matrix has all filled up with 0. All the pixels have a value of 0. If we were to calculate the total number of pixels from this matrix, this is how we are going to do it.
Total no of pixels = total no. Of rows X total no. Of columns
= 3 X 3
= 9.
It means that an image would be formed with 9 pixels, and that image would have a dimension of 3 rows and 3 columns and most importantly that image would be black.
The resulting image that would be made would be something like this

Now, why is this image all black. Because all the pixels in the image had a value of 0.
Q7) Calculate the size of the image formed
A7)
Suppose an image has been taken of a person 5m tall and standing at a distance of 50m from the camera, and we have to tell that what is the size of the image of the person, with a camera of the focal length is 50mm.
Solution:
Since the focal length is in millimeters, so we have to convert everything into a millimeter to calculate it.
So,
Y = 5000 mm.
f = 50 mm.
Z = 50000 mm.
Putting the values in the formula, we get

= -5 mm.
Again, the minus sign indicates that the image is inverted.
Q8) Explain Image storage requirements
A8)
Image storage requirements
After the discussion of bits per pixel, now we have everything that we need to calculate the size of an image.
Image size
The size of an image depends upon three things.
- Number of rows
- Number of columns
- Number of bits per pixel
The formula for calculating the size is given below.
Size of an image = rows * cols * bpp
It means that if you have an image, let's say this one:
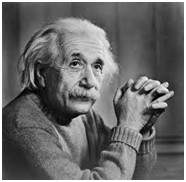
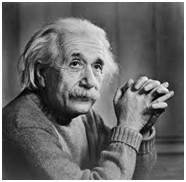
Assuming it has 1024 rows and it has 1024 columns. And since it is a grayscale image, it has 256 different shades of gray or it has bits per pixel. Then putting these values in the formula, we get
Size of an image = rows * cols * bpp
= 1024 * 1024 * 8
= 8388608 bits.
But since it's not a standard answer that we recognize, so will convert it into our format.
Converting it into bytes = 8388608 / 8 = 1048576 bytes.
Converting into kilo bytes = 1048576 / 1024 = 1024kb.
Converting into Mega bytes = 1024 / 1024 = 1 Mb.
That's how image size is calculated and it is stored. Now in the formula, if you are given the size of the image and the bits per pixel, you can also calculate the rows and columns of the image, provided the image is square(same rows and same column).
Q9) Explain Shades in detail
A9)
You can easily notice the pattern of exponential growth. The famous grayscale image is 8 bpp, which means it has 256 different colors in it or 256 shades.
Shades can be represented as:

Color images are usually of the 24 bpp format or 16 bpp.
We will see more about other color formats and image types in the tutorial of image types.
Color values:
We have previously seen in the tutorial of the concept of the pixel, that 0-pixel value denotes black color.
Black color:
Remember, the 0-pixel value always denotes black color. But there is no fixed value that denotes white color.
White color:
The value that denotes white color can be calculated as :

In the case of 1 bpp, 0 denotes black, and 1 denotes white.
In case 8 bpp, 0 denotes black, and 255 denotes white.
Gray color:
When you calculate the black and white color value, then you can calculate the pixel value of the gray color.
The gray color is the midpoint of black and white. That said,
In the case of 8bpp, the pixel value that denotes gray color is 127 or 128bpp (if you count from 1, not from 0).
Q10) What is the number of different colors?
A10)
Number of different colors:
Now as we said in the beginning, that the number of different colors depends on the number of bits per pixel.
The table for some of the bits and their color is given below.
Bits per pixel | Number of colors |
1 bpp | 2 colors |
2 bpp | 4 colors |
3 bpp | 8 colors |
4 bpp | 16 colors |
5 bpp | 32 colors |
6 bpp | 64 colors |
7 bpp | 128 colors |
8 bpp | 256 colors |
10 bpp | 1024 colors |
16 bpp | 65536 colors |
24 bpp | 16777216 colors (16.7 million colors) |
32 bpp | 4294967296 colors (4294 million colors) |
This table shows different bits per pixel and the amount of color they contain.
UNIT 2
IMAGE ENHANCEMENT
Q1) What is Image Enhancement?
A1)
The main objective of Image Enhancement is to process the given image into a more suitable form for a specific application. It makes an image more noticeable by enhancing the features such as edges, boundaries, or contrast. While enhancement, data does not increase, but the dynamic range is increased of the chosen features by which it can be detected easily.
In image enhancement, the difficulty arises to quantify the criterion for enhancement for which enhancement techniques are required to obtain satisfying results.
Q2) Name the categories of Image Enhancement and explain?
A2)
There are two types of Image enhancement methods:
- Spatial domain technique
- Frequency domain technique
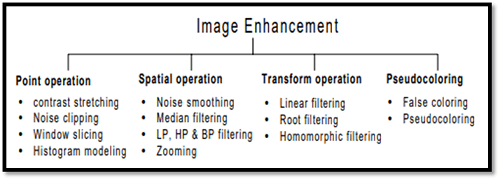
Fig – Image enhancement
Spatial domain enhancement methods
Spatial domain techniques are performed on the image plane, and they directly manipulate the pixel of the image.
Operations are formulated as:
g(x,y) = T[f(x, y)]
Where g is the output image, f is the input image, and T is an operation
Spatial domain techniques are further divided into 2 categories:
- Point operations (linear operation)
- Spatial operations (non-linear operation)
Frequency domain enhancement methods
Frequency domains enhance an image by following complex linear operators.
G(w1, w2) = F(w1, w2) H(w1, w2)
Image enhancement can also be done through Gray Level Transformation.
Q3) What is the concept of the mask and what are the types of filters?
A3)
The concept of a mask is also known as spatial filtering. Mask is a type of filter which operates directly on the image. The filter mask is also known as a convolution mask.
To apply a mask to an image, the filter mask is moved from point to point on the image. In the original image, at each point(X, Y), the filter is calculated by using a predefined relationship.
There are two types of filters:
- Linear filter
- Frequency domain filter
Linear filter
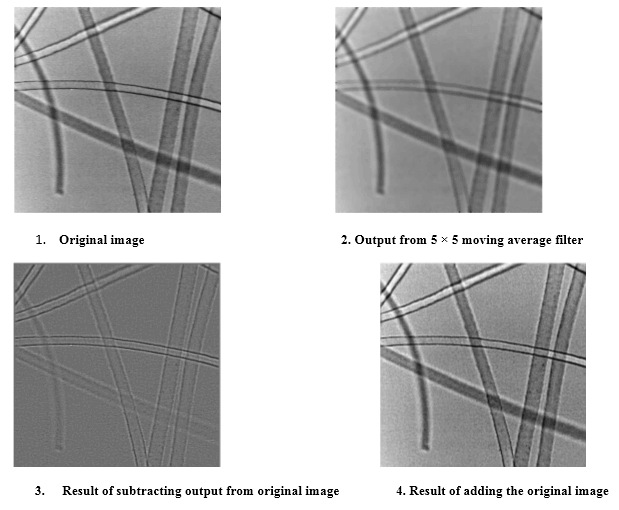
A linear filter is the simplest filter. In a linear filter, each pixel is replaced by the average of these pixel values. The entire linear filter works in the same way except when the weighted average is formed instead of a simple average.
The formula for a linear filter

Example:

Frequency Domain Filter
In frequency domain filter, an image is represented as the sum of many sine waves that have different frequencies, amplitudes, and directions. The parameter of sine waves is referred to as Fourier coefficients.
Reasons for using this approach:
- For getting extra insight.
- Linear filters can also in the frequency domain use Fast Fourier Transform (FFT)
Filters are used for 2 purposes:
- Blurring and noise reduction.
- Edge detection and sharpness.
Blurring and noise reduction
Filters can be used for blurring as well as noise reduction from an image. Blurring is used to remove small details from an image. Noise reduction can also be done with the help of blurring.
Commonly used masks for blurring are:
- Box filter
- Weighted average filter
Edge Detection and sharpness
Filters can be used for edge detection and sharpness. To increase the sharpness of an image, edge detection is used.
Q4) Write an application of Histograms?
A4)
Applications of Histograms
- In digital image processing, histograms are used for simple calculations in software.
- It is used to analyze an image. Properties of an image can be predicted by the detailed study of the histogram.
- The brightness of the image can be adjusted by having the details of its histogram.
- The contrast of the image can be adjusted according to the need by having details of the x-axis of a histogram.
- It is used for image equalization. Gray level intensities are expanded along the x-axis to produce a high contrast image.
- Histograms are used in thresholding as it improves the appearance of the image.
- If we have an input and output histogram of an image, we can determine which type of transformation is applied in the algorithm.
Q5) Explain histogram processing techniques
A5)
Histogram Processing Techniques
Histogram Sliding
In Histogram sliding, the complete histogram is shifted towards rightwards or leftwards. When a histogram is shifted towards the right or left, clear changes are seen in the brightness of the image. The brightness of the image is defined by the intensity of light that is emitted by a particular light source.
Histogram Stretching
In histogram stretching, the contrast of an image is increased. The contrast of an image is defined between the maximum and minimum value of pixel intensity.
If we want to increase the contrast of an image, the histogram of that image will be fully stretched and covered the dynamic range of the histogram.
From the histogram of an image, we can check that the image has low or high contrast.

Histogram Equalization
Histogram equalization is used for equalizing all the pixel values of an image. Transformation is done in such a way that a uniformly flattened histogram is produced.
Histogram equalization increases the dynamic range of pixel values and makes an equal count of pixels at each level which produces a flat histogram with high contrast image.
While stretching histogram, the shape of the histogram remains the same whereas in Histogram equalization, the shape of histogram changes and it generates only one image.

Q6) What is the Relationship with the CCD array?
A6)
We have seen that how an image is formed in the CCD array. So a pixel can also be defined as
The smallest division the CCD array is also known as a pixel.
Each division of the CCD array contains the value against the intensity of the photon striking it. This value can also be called a pixel.
Calculation of total number of pixels
We have defined an image as a two-dimensional signal or matrix. Then in that case the number of PEL would be equal to the number of rows multiplied by some columns.
This can be mathematically represented as below:
Total number of pixels = number of rows ( X ) number of columns
Or we can say that the number of (x,y) coordinate pairs make up the total number of pixels.
We will look in more detail in the tutorial of image types, that how do we calculate the pixels in a color image.
Gray level
The value of the pixel at any point denotes the intensity of the image at that location, and that is also known as the gray level.
We will see in more detail the value of the pixels in the image storage and bits per pixel tutorial, but for now, we will just look at the concept of only one-pixel value.
Pixel value.(0)
As has already been define at the beginning of this tutorial, that each pixel can have only one value and each value denotes the intensity of light at that point of the image.
We will now look at a very unique value 0. The value 0 means the absence of light. It means that 0 denotes dark, and it further means that whenever a pixel has a value of 0, it means at that point, the black color would be formed.
Have a look at this image matrix
0 | 0 | 0 |
0 | 0 | 0 |
0 | 0 | 0 |
Now this image matrix has all filled up with 0. All the pixels have a value of 0. If we were to calculate the total number of pixels from this matrix, this is how we are going to do it.
Total no of pixels = total no. Of rows X total no. Of columns
= 3 X 3
= 9.
It means that an image would be formed with 9 pixels, and that image would have a dimension of 3 rows and 3 columns and most importantly that image would be black.
The resulting image that would be made would be something like this

Now, why is this image all black. Because all the pixels in the image had a value of 0.
Q7) Calculate the size of the image formed
A7)
Suppose an image has been taken of a person 5m tall and standing at a distance of 50m from the camera, and we have to tell that what is the size of the image of the person, with a camera of the focal length is 50mm.
Solution:
Since the focal length is in millimeters, so we have to convert everything into a millimeter to calculate it.
So,
Y = 5000 mm.
f = 50 mm.
Z = 50000 mm.
Putting the values in the formula, we get

= -5 mm.
Again, the minus sign indicates that the image is inverted.
Q8) Explain Image storage requirements
A8)
Image storage requirements
After the discussion of bits per pixel, now we have everything that we need to calculate the size of an image.
Image size
The size of an image depends upon three things.
- Number of rows
- Number of columns
- Number of bits per pixel
The formula for calculating the size is given below.
Size of an image = rows * cols * bpp
It means that if you have an image, let's say this one:
Assuming it has 1024 rows and it has 1024 columns. And since it is a grayscale image, it has 256 different shades of gray or it has bits per pixel. Then putting these values in the formula, we get
Size of an image = rows * cols * bpp
= 1024 * 1024 * 8
= 8388608 bits.
But since it's not a standard answer that we recognize, so will convert it into our format.
Converting it into bytes = 8388608 / 8 = 1048576 bytes.
Converting into kilo bytes = 1048576 / 1024 = 1024kb.
Converting into Mega bytes = 1024 / 1024 = 1 Mb.
That's how image size is calculated and it is stored. Now in the formula, if you are given the size of the image and the bits per pixel, you can also calculate the rows and columns of the image, provided the image is square(same rows and same column).
Q9) Explain Shades in detail
A9)
You can easily notice the pattern of exponential growth. The famous grayscale image is 8 bpp, which means it has 256 different colors in it or 256 shades.
Shades can be represented as:

Color images are usually of the 24 bpp format or 16 bpp.
We will see more about other color formats and image types in the tutorial of image types.
Color values:
We have previously seen in the tutorial of the concept of the pixel, that 0-pixel value denotes black color.
Black color:
Remember, the 0-pixel value always denotes black color. But there is no fixed value that denotes white color.
White color:
The value that denotes white color can be calculated as :

In the case of 1 bpp, 0 denotes black, and 1 denotes white.
In case 8 bpp, 0 denotes black, and 255 denotes white.
Gray color:
When you calculate the black and white color value, then you can calculate the pixel value of the gray color.
The gray color is the midpoint of black and white. That said,
In the case of 8bpp, the pixel value that denotes gray color is 127 or 128bpp (if you count from 1, not from 0).
Q10) What is the number of different colors?
A10)
Number of different colors:
Now as we said in the beginning, that the number of different colors depends on the number of bits per pixel.
The table for some of the bits and their color is given below.
Bits per pixel | Number of colors |
1 bpp | 2 colors |
2 bpp | 4 colors |
3 bpp | 8 colors |
4 bpp | 16 colors |
5 bpp | 32 colors |
6 bpp | 64 colors |
7 bpp | 128 colors |
8 bpp | 256 colors |
10 bpp | 1024 colors |
16 bpp | 65536 colors |
24 bpp | 16777216 colors (16.7 million colors) |
32 bpp | 4294967296 colors (4294 million colors) |
This table shows different bits per pixel and the amount of color they contain.