Unit 5
Signal system
- What is sampling theorem?
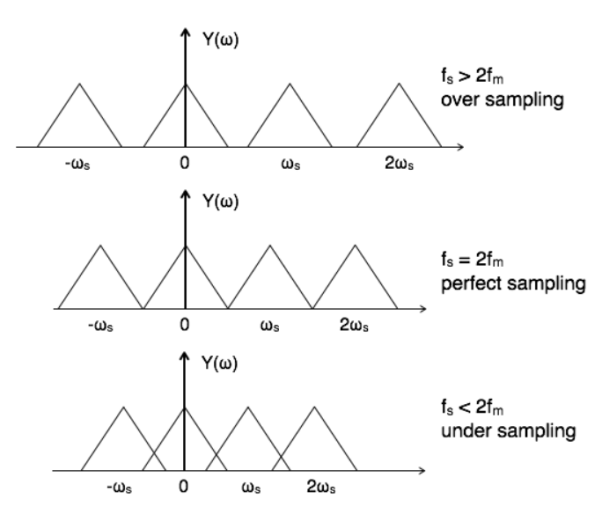
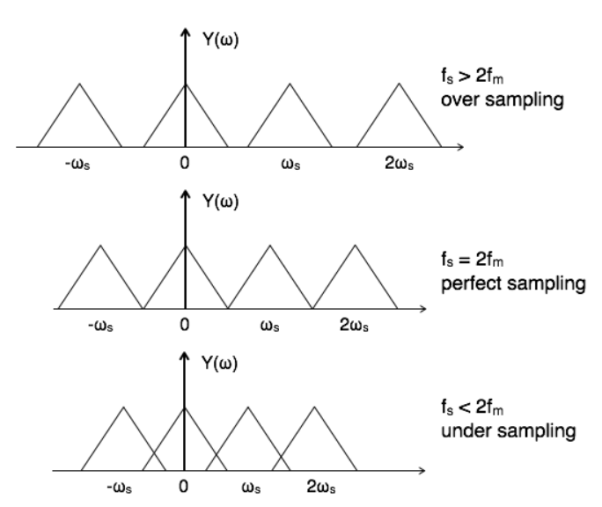
Sampling theorem states that for a continuous form of a time-variant signal it can be represented in the discrete form of a signal with help of samples and the sampled (discrete) signal can be recovered to original form when the sampling signal frequency Fs having the greater frequency value than or equal to the input signal frequency Fm.
2. Explain the sampling theorem for different conditions?
If the sampling frequency (Fs) equals twice the input signal frequency (Fm), then such a condition is called the Nyquist Criteria for sampling. When sampling frequency equals twice the input signal frequency is known as “Nyquist rate”.
3. Explain the reconstruction of the signal?
In time domain, the reconstruction of the continuous signal x(t) from its sampled version xs(t) can be considered as an interpolation process of filling the gaps between neighbouring samples. The interpolation can be considered as convolution of xs(t) with a certain function h(t):
x(t) reconstructed = h(t) * xs(t)
In frequency domain, the interpolation can be considered as a filtering process:
X(w) reconstructed = H(w) Xs(w)
With the general effect of reserving the central portion of the periodic spectrum Xs(w) while suppressing all its replica at higher frequencies.
4. Explain zero order hold and first order hold?
Ho(t) = { 1 0  t < Ts
0 otherwise
A continuous signal xo(t) can be recovered by
Xo(t) = ho(t) *xs(t)
Which is a series of square pulses with their heights modulated by x(mTs). The interpolation corresponds a low-pass filtering in frequency domain by
Ho(w) = F{ho(t)] = 2/w sin(wTs/2) e -jwTs/2
First-order hold
h1(t) = { 1-|t|/Ts 0 |t|<Ts
0 otherwise
A continuous signal x1(t) can be recovered by
x1(t) = h1(t) * xs(t)
Which is the linear interpolation of the sample train x(mTs) (connecting every two consecutive samples by a straight line). This interpolation corresponds a low-pass filtering in frequency domain by
H1(w) = F [h1(t)] = 4/ w 2 Ts sin 2 (wTs/2)
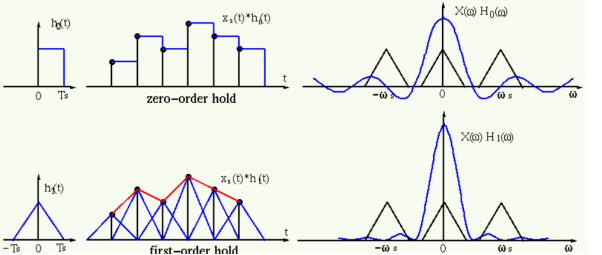
Figure.
5. Explain aliasing? Explain the measures to reduce its effects?
Aliasing can be referred to as “the phenomenon of a high-frequency component in the spectrum of a signal, taking on the identity of a low-frequency component in the spectrum of its sampled version.”
The corrective measures taken to reduce the effect of Aliasing are −
- In the transmitter section of PCM, a low pass anti-aliasing filter is employed, before the sampler, to eliminate the high frequency components, which are unwanted.
- The signal which is sampled after filtering, is sampled at a rate slightly higher than the Nyquist rate.
This choice of having the sampling rate higher than Nyquist rate, also helps in the easier design of the reconstruction filter at the receiver.
6. Explain the differences between continuous and discrete signal?
Continuous time signal | Discrete time signal |
It is analog in nature | Digital representation of continuous time signal |
It can be converted to discrete time signal by Euler’s method | Discrete time signal can be converted into continuous time signal by zero order or first order hold |
It is defined over finite or infinite domain of sequence | It is defined over finite domain of sequence |
The value of the signal can be obtained at any arbitrary point of time | The value of the signal can be obtained only at sampling instants of time |
7. Explain the relation between discrete and continuous time signal?
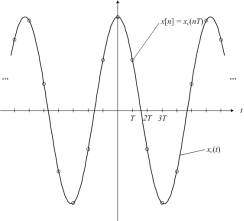
By sampling a continuous-time signal as shown in the figure.
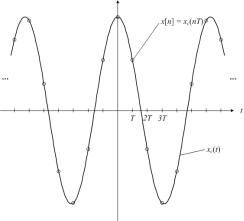
Mathematically, the relationship between the discrete-time signal and the continuous-time signal is given by:
x[n] = xc(nT)
The sampling frequency is fs = 1/T or Ωs= 2π/T.
The discrete-time Fourier transform of x[n] is related to the continuous-time Fourier transform of xc(t) as follows:
X(w) = 1/T  (w/T + 2πk/T)
There are two key pieces to this equation.
The first is a scaling relationship between w and Ω : w=Ω T.
This means that the sampling frequency in the continuous-time Fourier transform, Ωs , becomes the frequency 2π in the discrete-time Fourier transform. The discrete-time frequency w=π corresponds to half the sampling frequency, or Ωs/2 .
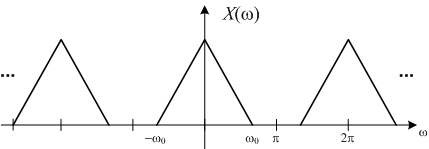
The second key piece of the equation is that there are an infinite number of copies of Xc(w/T) spaced by 2π .
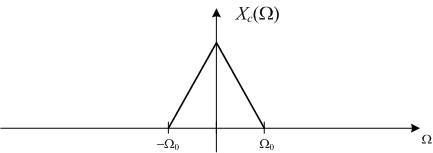
Suppose Xc(Ω) looks like this:
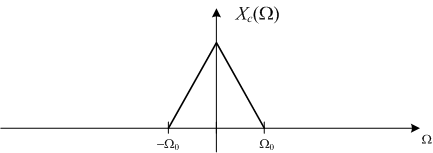
Note that Xc(Ω) equals zero for all frequencies |Ω|  Ωo. This is what we mean when we say a continuous-time signal is band-limited. The frequency Ωo is called the bandwidth of the signal.
The discrete-time Fourier transform of x[n] = xc[nT] looks like this:
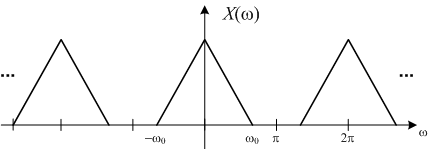
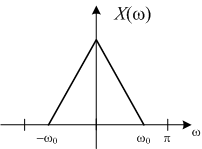
Where wo = ΩoT. X(w) is as shown in figure.
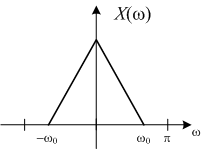
For this example, then, X(w) between -π and π looks just like a scaled version of Xc(Ω) .
8. What are the advantages of sampling ?
Low cost of sampling
If data were to be collected for the entire population, the cost will be quite high. A sample is a small proportion of a population. So, the cost will be lower if data is collected for a sample of population which is a big advantage.
2. Less time consuming in sampling
Use of sampling takes less time also. It consumes less time than census technique. Tabulation, analysis etc., take much less time in the case of a sample than in the case of a population.
3. Scope of sampling is high
The investigator is concerned with the generalization of data. To study a whole population in order to arrive at generalizations would be impractical.
Some populations are so large that their characteristics could not be measured. Before the measurement has been completed, the population would have changed. But the process of sampling makes it possible to arrive at generalizations by studying the variables within a relatively small proportion of the population.
4. Accuracy of data is high
Having drawn a sample and computed the desired descriptive statistics, it is possible to determine the stability of the obtained sample value. A sample represents the population from which its is drawn. It permits a high degree of accuracy due to a limited area of operations. Moreover, careful execution of field work is possible. Ultimately, the results of sampling studies turn out to be sufficiently accurate.
5. Organization of convenience
Organizational problems involved in sampling are very few. Since sample is of a small size, vast facilities are not required. Sampling is therefore economical in respect of resources. Study of samples involves less space and equipment.
6. Intensive and exhaustive data
In sample studies, measurements or observations are made of a limited number. So, intensive and exhaustive data are collected.
9. What are the applications of sampling?
- To maintain sound quality in music recordings.
- Sampling process applicable in the conversion of analog to discrete form.
- Speech recognition systems and pattern recognition systems.
- Modulation and demodulation systems
- In sensor data evaluation systems
- Radar and radio navigation system sampling is applicable.
- Digital watermarking and biometric identification systems, surveillance systems.
10. What are the disadvantages of sampling?
- Chances of bias.
- Difficulties in selecting truly a representative sample.
- Need for subject specific knowledge.
- Changeability of sampling units.
- Impossibility of sampling.
Unit 5
Signal system
- What is sampling theorem?
Sampling theorem states that for a continuous form of a time-variant signal it can be represented in the discrete form of a signal with help of samples and the sampled (discrete) signal can be recovered to original form when the sampling signal frequency Fs having the greater frequency value than or equal to the input signal frequency Fm.
2. Explain the sampling theorem for different conditions?
If the sampling frequency (Fs) equals twice the input signal frequency (Fm), then such a condition is called the Nyquist Criteria for sampling. When sampling frequency equals twice the input signal frequency is known as “Nyquist rate”.
3. Explain the reconstruction of the signal?
In time domain, the reconstruction of the continuous signal x(t) from its sampled version xs(t) can be considered as an interpolation process of filling the gaps between neighbouring samples. The interpolation can be considered as convolution of xs(t) with a certain function h(t):
x(t) reconstructed = h(t) * xs(t)
In frequency domain, the interpolation can be considered as a filtering process:
X(w) reconstructed = H(w) Xs(w)
With the general effect of reserving the central portion of the periodic spectrum Xs(w) while suppressing all its replica at higher frequencies.
4. Explain zero order hold and first order hold?
Ho(t) = { 1 0  t < Ts
0 otherwise
A continuous signal xo(t) can be recovered by
Xo(t) = ho(t) *xs(t)
Which is a series of square pulses with their heights modulated by x(mTs). The interpolation corresponds a low-pass filtering in frequency domain by
Ho(w) = F{ho(t)] = 2/w sin(wTs/2) e -jwTs/2
First-order hold
h1(t) = { 1-|t|/Ts 0 |t|<Ts
0 otherwise
A continuous signal x1(t) can be recovered by
x1(t) = h1(t) * xs(t)
Which is the linear interpolation of the sample train x(mTs) (connecting every two consecutive samples by a straight line). This interpolation corresponds a low-pass filtering in frequency domain by
H1(w) = F [h1(t)] = 4/ w 2 Ts sin 2 (wTs/2)
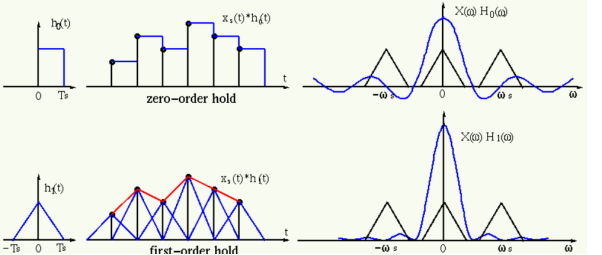
Figure.
5. Explain aliasing? Explain the measures to reduce its effects?
Aliasing can be referred to as “the phenomenon of a high-frequency component in the spectrum of a signal, taking on the identity of a low-frequency component in the spectrum of its sampled version.”
The corrective measures taken to reduce the effect of Aliasing are −
- In the transmitter section of PCM, a low pass anti-aliasing filter is employed, before the sampler, to eliminate the high frequency components, which are unwanted.
- The signal which is sampled after filtering, is sampled at a rate slightly higher than the Nyquist rate.
This choice of having the sampling rate higher than Nyquist rate, also helps in the easier design of the reconstruction filter at the receiver.
6. Explain the differences between continuous and discrete signal?
Continuous time signal | Discrete time signal |
It is analog in nature | Digital representation of continuous time signal |
It can be converted to discrete time signal by Euler’s method | Discrete time signal can be converted into continuous time signal by zero order or first order hold |
It is defined over finite or infinite domain of sequence | It is defined over finite domain of sequence |
The value of the signal can be obtained at any arbitrary point of time | The value of the signal can be obtained only at sampling instants of time |
7. Explain the relation between discrete and continuous time signal?
By sampling a continuous-time signal as shown in the figure.
Mathematically, the relationship between the discrete-time signal and the continuous-time signal is given by:
x[n] = xc(nT)
The sampling frequency is fs = 1/T or Ωs= 2π/T.
The discrete-time Fourier transform of x[n] is related to the continuous-time Fourier transform of xc(t) as follows:
X(w) = 1/T  (w/T + 2πk/T)
There are two key pieces to this equation.
The first is a scaling relationship between w and Ω : w=Ω T.
This means that the sampling frequency in the continuous-time Fourier transform, Ωs , becomes the frequency 2π in the discrete-time Fourier transform. The discrete-time frequency w=π corresponds to half the sampling frequency, or Ωs/2 .
The second key piece of the equation is that there are an infinite number of copies of Xc(w/T) spaced by 2π .
Suppose Xc(Ω) looks like this:
Note that Xc(Ω) equals zero for all frequencies |Ω|  Ωo. This is what we mean when we say a continuous-time signal is band-limited. The frequency Ωo is called the bandwidth of the signal.
The discrete-time Fourier transform of x[n] = xc[nT] looks like this:
Where wo = ΩoT. X(w) is as shown in figure.
For this example, then, X(w) between -π and π looks just like a scaled version of Xc(Ω) .
8. What are the advantages of sampling ?
Low cost of sampling
If data were to be collected for the entire population, the cost will be quite high. A sample is a small proportion of a population. So, the cost will be lower if data is collected for a sample of population which is a big advantage.
2. Less time consuming in sampling
Use of sampling takes less time also. It consumes less time than census technique. Tabulation, analysis etc., take much less time in the case of a sample than in the case of a population.
3. Scope of sampling is high
The investigator is concerned with the generalization of data. To study a whole population in order to arrive at generalizations would be impractical.
Some populations are so large that their characteristics could not be measured. Before the measurement has been completed, the population would have changed. But the process of sampling makes it possible to arrive at generalizations by studying the variables within a relatively small proportion of the population.
4. Accuracy of data is high
Having drawn a sample and computed the desired descriptive statistics, it is possible to determine the stability of the obtained sample value. A sample represents the population from which its is drawn. It permits a high degree of accuracy due to a limited area of operations. Moreover, careful execution of field work is possible. Ultimately, the results of sampling studies turn out to be sufficiently accurate.
5. Organization of convenience
Organizational problems involved in sampling are very few. Since sample is of a small size, vast facilities are not required. Sampling is therefore economical in respect of resources. Study of samples involves less space and equipment.
6. Intensive and exhaustive data
In sample studies, measurements or observations are made of a limited number. So, intensive and exhaustive data are collected.
9. What are the applications of sampling?
- To maintain sound quality in music recordings.
- Sampling process applicable in the conversion of analog to discrete form.
- Speech recognition systems and pattern recognition systems.
- Modulation and demodulation systems
- In sensor data evaluation systems
- Radar and radio navigation system sampling is applicable.
- Digital watermarking and biometric identification systems, surveillance systems.
10. What are the disadvantages of sampling?
- Chances of bias.
- Difficulties in selecting truly a representative sample.
- Need for subject specific knowledge.
- Changeability of sampling units.
- Impossibility of sampling.