Unit - 1
Crystal Structure
Q1) Define Unit Cells along with various types of unit cells.
A1) A small 3D representative Structural subunit of lattice is called unit cell.
A unit cell is the smallest repeating portion of a crystal lattice. Unit cells occur in many different varieties. As one example, the cubic crystal system is composed of three different types of unit cells:
(1) Simple cubic,
(2) face-centred cubic, and
(3) body-centred cubic.
Q2) What is crystal metallic structure? Explain its type.
A2) The metallic structure is formed by associating every lattice point with an assembly or atoms or molecules or ions which are identical in composition, arrangement and orientation.
Crystal Structure has three types of unit cells which are mostly being used:
- Body Centred Cubic structure (BCC):
BCC Structure has atoms at its each corner and one atom at its centre. So, the BCC consists of net total of two atoms.
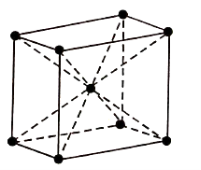
Figure: BCC
Therefore, Total atoms in the BCC = (1/8) × 8+1=2
The coordination number of BCC arrangement is 8 and packing factor is 0.68.
The BCC structure can be generally seen in Lithium, Potassium, and Sodium etc.
2. Face Centred Cubic Structure (FCC):
It consists of atoms at its each corner and one atom at centre of each face.
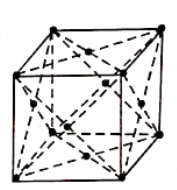
Figure: FCC
Total atoms in FCC Unit cell= (1/8) × 8+ (1/2) × 6
=1+3
=4 atoms.
The coordination number is 12 and packing factor is 0.74.
The FCC structure can be generally seen in Copper, Gold, Silver and Lead etc.
3. Hexagonal Closed-Packed Structure ( HCP):
The unit cell is like a hexagonal prism in HCP.
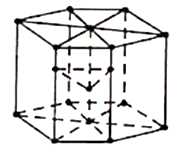
Figure: HPC
There are twelve corners and each corner have an atom and one atom at the centre of each of the two hexagonal faces and three atoms in the body of the cell. In total, seventeen atoms take part in formation of a HCP unit cells.
Total atoms in HCP=12× (1/6) +3+2× (1/2)
= 6 atoms.
This is identical to FCC, having coordination number 12 and packing factor 0.74.
This HCP structure is generally seen in Zinc, Magnesium and Beryllium etc.
Q3) What is ceramics? Explain with example.
A3) A ceramic is any of the various hard, brittle, heat-resistant and corrosion-resistant materials made by shaping and then firing a non-metallic mineral, such as clay, at a high temperature. Common examples are earthenware, porcelain, and brick.
Ceramics are generally made by taking mixtures of clay, earthen elements, powders, and water and shaping them into desired forms. Once the ceramic has been shaped, it is fired in a high temperature oven known as a kiln. Often, ceramics are covered in decorative, waterproof, paint-like substances known as glazes.
There are basically five types of ceramics are known:
- Pottery,
- Porcelain,
- Stoneware,
- Earthenware
- Bone China.
Those four vary in accordance to the clay used to create them, as well as the heat required to fire them.
Q4) Explain point and Line imperfections.
A4)
1. Point Imperfections:
- Point defects imperfections are where an atom is missing or is in irregular place in the lattice structure.
- These effects are completely local in effect.
- Point imperfections are always present in crystal and their presence results in a decrease in the free energy.
- The number of defects at equilibrium concentrations at the certain temperature can be computed as,
n =Ne-Ed/kT
Where, n = Number of imperfections
N= Number of atomic sites per mole,
k =Boltzmann constant
Ed = the free energy required to form the defect, and
T= Absolute temperature.
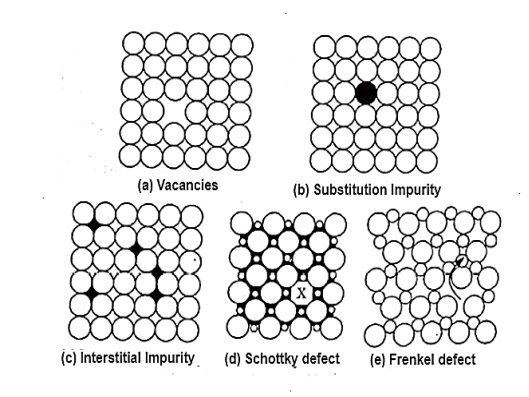
Figure: point imperfections
2. Line Imperfections:
- A linear disturbance of the atomic arrangement, which can be very easily occurring on the slip plane through the crystal, is known as dislocation.
- Dislocation is a two-dimensional line defect and is a very important crystal imperfection. It is responsible for the deformations of metal by slip phenomenon.
- It may also be concluded that it is region of localised lattice disturbances separating the slipped and unslipped regions of the crystal.
- These are formed in the process of solidification of metals and mainly in their plastic deformation of strain hardening, yield point creep and fatigue and brittle fractures.
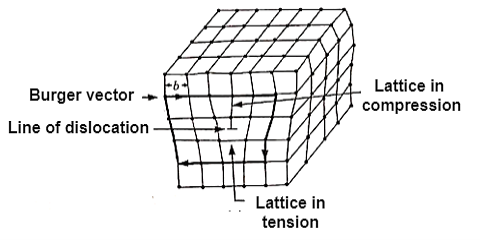
Figure: Line Imperfection or dislocation
Causes of line imperfections are:
- Thermal stresses or external stresses causing plastic flow.
- Crystal growth.
- Phase transformation.
- Segregation of solute atoms causing mismatches.
Types of line imperfections:
- Edge line imperfection or dislocation:
It is formed by adding extra partial planes of atoms.
b. Screw line imperfection or dislocation:
A screw dislocation has its displacement or Burger Vector parallel to the linear defect but there is a distortion of the plane.
These dislocations are responsible for the useful property of ductility in metal, ceramics and polymers.
Q5) Define Interfacial and volume imperfections in solid.
A5)
- Interfacial Imperfections:
Interfacial defects can be defined as boundaries that have two dimensional imperfections in crystalline solid, and have different crystal structures and or crystallographic orientations on either side of them. They refer to the regions of distortions that lie about a surface having thickness of few atomic diameters. For example external surface, grain boundaries, twin boundaries, stacking faults and phase boundaries. These imperfections are not thermodynamically stable, rather than they are meta-stable imperfections. They arise from the clustering of line defects into a plane.
2. Volume or Bulk imperfections:
Volume defects as name suggests are defects in 3-D dimensions. These include pores, cracks, foreign inclusions and other phases. These defects are normally introduced during processing and fabrication steps. All these effects are capable of acting as stress raisers, and thus deleterious to parent metal’s mechanical behaviour. However in some cases foreign particles are added purposefully to strengthen the parent material. The procedure is called dispersion hardening where foreign particles acts as an obstacle to movement of dislocation which facilitates the plastic deformation. The second phase particle act in two distinct ways- particles are either may be cut by the dislocations or the particle cutting and dislocations are forced to bypass them. Strengthening due to ordered particles is responsible for the good high-temperature strength on many super-alloys. However, pores are detrimental because they reduce effective load bearing area and act as stress concentrations sites.
Q6) What is Dislocation Strengthening Mechanism? Explain Strengthening by grain size reduction.
A6) The ability of metal to deform depends on the ability of dislocations to move.
Restricting the dislocation motion makes the material stronger.
Strengthening by grain size reduction:
Grain boundary barrier to dislocation motion: slip plane discontinues or change orientation.
Small angle grain boundaries are not very effective in blocking dislocations.
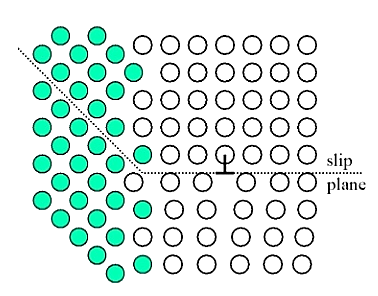
Figure: Grain size reduction
High angle grain boundaries block slip and increase strength of material. A stress concentration at end of a slip plane may trigger new dislocations in an adjacent grain.
The finer the grains, larger the area of grain boundaries that impedes dislocation motion. It usually improves the toughness as well. Usually, the yield strength varies with grain size d according to the hall Petch equation.

Where σ0 and ky are constant for a particular material, d is the average grain diameter.
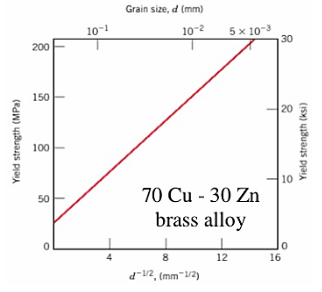
Figure: Graph for grain size reduction
Q7) Define solid solution and strain hardening strengthening.
A7)
- Solid solution alloying:
Interstitial or substitutional impurities cause lattice strain. As a result, these impurities interact with the dislocation strain fields and hinder dislocation motion.
Impurities tend to diffuse and segregate around dislocation cores to find atomic sites that suit their radii. This reduces their overall strain energy and anchors the dislocations.
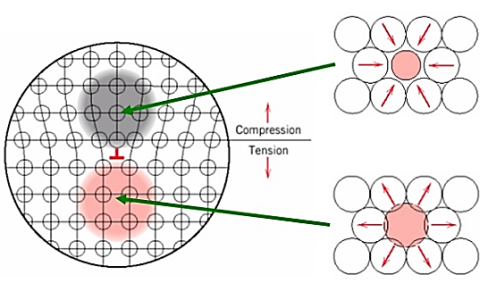
Figure: Solid Solution alloying Strengthening
Motion of dislocation core away from the impurities moves it to a region of lattice where the atomic strains are greater.
2. Strain hardening strengthening:
Ductile metals become stronger when they are deformed plastically at temperatures well below the melting point.
The reason for strain hardening is the increase of the dislocation density with plastic deformation. The average distance between dislocations decrease and dislocation starts blocking the motion of each other.
The percent cold work is often used to express the degree of plastic deformation:

Q8) Explain Slip System with its classification.
A8)
Slip is lose one’s footing and slide and unintentionally for a short distance or to fall down.
A plane surface through a crystal along which slip can take place under some conditions without apparently disrupting the crystal.
Slip planes are the plane with the highest density of atoms.
Slip Direction is the direction in which the dislocation moves, which is the Burger vector for the edge locations.
Slip does not move at the same degree of ease on all crystallographic planes and direction of atoms.
The preferred plane with specified directions along which dislocation motion occurs is called slip planes.
The combination of slip planes and the slip direction is known as slip system.
For a particular crystal structure:
- Slip plane: plane with greatest planar density.
- Slip Direction: direction with highest linear density in slip plane.
- Types of slip system:
There are types of slip system:
- Face centred cubic (FCC) slip having 12 slip systems.
- Body centred cubic (BCC) slip having 12 to 24 slip systems.
- Hexagonal closed packed (HCP) slip having less slip system than BCC and FCC.
Q9) What is critically resolved shear stress?
A9) Slip results in the formation of steps the surface of the crystal. These are readily detected if the surface is carefully polished before plastic deformation.
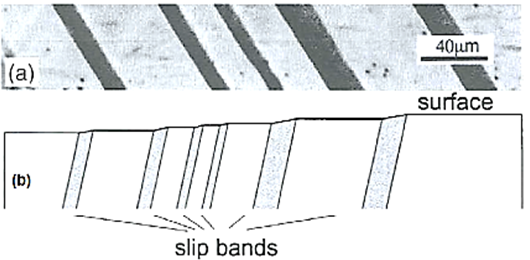
Figure: Slip bands
Erich Schmid discovered that if a crystal is stressed, slip begins when the shear stress on a slip system reaches a critical value, Ϡc, often called the critical resolved shear stress.
Q10) Explain Tensile test with stress-strain diagram.
A10)
- The stress-strain diagram for brittle material, in which the axial strain is plotted along x-axis and corresponding stresses (P/A) = (Load/Area) are plotted along y-axis.
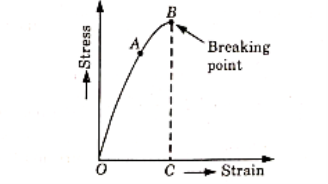
Figure: Stress-strain diagram for brittle material
- The diagram is obtained by performing a tensile test on the specimen.
- The end of the test piece is fixed into grips connected to a straining device and load measuring device. The load on the test piece is increased slowly and corresponding extension is measured. From these readings, the curve OAB is obtained.
- In this curve, from O to A the stress is proportional to the strain and this is known as elastic edge stage.
- Upto point A, Hooke’s law is applicable. The stress at A represents the proportional limit.
- If the load is increased further the elongation becomes more rapid and diagram becomes curved. This stress will not be proportional to the strain.
- At point B, suddenly the specimen breaks into pieces. The total elongation OC before fractures is very small as compared to total elongation of ductile materials.
Q11) Describe Compression test with diagram.
A11)
Compression tests are used to determine a material's behaviour under applied crushing loads, and are typically conducted by applying compressive pressure to a test specimen (usually of either a cuboids or cylindrical geometry) using platens or specialized fixtures on a universal testing machine.
During the test, various properties of the material are calculated and plotted as a stress-strain diagram which is used to determine qualities such as elastic limit, proportional limit, yield point, yield strength, and, for some materials, compressive strength.
Compression testing allows manufacturers to assess the integrity and safety of materials, components, and products during several phases of the manufacturing process. The potential applications can vary from strength testing of a car windshield to endurance testing of concrete beams used in construction. Materials that exhibit high tensile strength tend to (but do not always!) exhibit low compressive strength. Likewise, materials high in compressive strength tend to exhibit low tensile strength. Therefore, compression testing is often used on brittle materials such as concrete, metals, plastics, ceramics, composites, and corrugated materials like cardboard. These materials are often used in a load-bearing capacity where their integrity under compressive forces is critical.
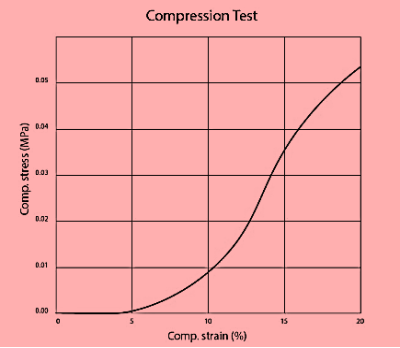
Figure: Compression test
Q12) Explain the torsion test with its classification.
A12)
Torsion tests twist a material or test component to a specified degree, with a specified force, or until the material fails in torsion. The twisting force of a torsion test is applied to the test sample by anchoring one end so that it cannot move or rotate and applying a moment to the other end so that the sample is rotated about its axis. The rotating moment may also be applied to both ends of the sample but the ends must be rotated in opposite directions. The forces and mechanics found in this test are similar to those found in a piece of string that has one end held in a hand and the other end twisted by the other.
Types of Torsion test:
The three common forms that torsion testing take include failure, proof and operational. A torsion test for failure requires that the test sample be twisted until it breaks and is designed to measure the strength of the sample. A proof test is designed to observe the material under a specified torque load over a set period of time. Finally, operational testing is measures the material’s performance under the expected service conditions of its application. All of these forms of tests may be performed with either torsion only loading or a combination of torsion and axial (tension or compression) loading depending upon the characteristics to be measured.
Types of Torsion Testing Materials:
Many materials experience torques or torsional forces in their applications and so will benefit from or require torsion testing. Materials used in structural, biomedical and automotive applications are among the more common materials to experience torsion in their applications. These materials may be composed of metals, plastics, woods, polymers, composites, or ceramics among others and commonly take the forms of fasteners, rods, beams, tubes and wires.
Q13) Discuss the relation between true and engineering stress-strain curves)
A13) Stress-strain curve for material is plotted by elongating the sample and recording the stress variation with strain until the sample fractures. The strain is set to horizontal axis and stress is set to vertical axis. It is often assumed that the cross-section area of the material does not change during the whole deformation process. This is not true since the actual area will decrease while deforming due to elastic and plastic deformation. The curve based on the original cross-section and gauge length is called the engineering stress-strain curve, while the curve based on the instantaneous cross-section area and length is called the true stress-strain curve.
For engineering stress, we assume the length and diameter of the sample remain constant throughout the whole experiment.
Engineering stress is calculated by:

Engineering strain is calculated by:

True stress is the applied load divided by the actual cross-sectional area (the changing area with time) of material. Engineering stress is the applied load divided by the original cross-sectional area of material.
Q14) Define yielding and yield strength.
A14)
- In materials science and engineering, the yield point is the point on a stress-strain curve that indicates the limit of elastic behaviour and the beginning of plastic behaviour.
- Below the yield point, a material will deform elastically and will return to its original shape when the applied stress is removed.
- Once the yield point is passed, some fraction of the deformation will be permanent and non-reversible and is known as plastic deformation.
- Yield strength is defined as the stress at which a material begins to deform plastically.
- The plastic deformation begins at a point known as yield point.
- The yield point determines the limits of performance for mechanical components, since it represents the upper limit to forces that can be applied without permanent deformation.
Q15) Explain Ductility and Resilience.
A15) Ductility
Ductility is a property that measures the degree of plastic deformation that has been sustained at fracture.
A material that experiences very little or no plastic deformation upon fracture is termed brittle. Ductility may be expressed quantitatively as either percent elongation or percent reduction in area. The percent elongation %EL is the percentage of plastic strain at fracture, or
%EL=(lf-lo)/(lo)×100
Where, lf=Fracture length, and
lo= Original gauge length
Resilience:
In material science, resilience is the ability of a material to absorb energy when it is deformed elastically, and release that energy upon unloading. Proof resilience is defined as the maximum energy that can be absorbed up to the elastic limit, without creating a permanent distortion.
Thus, resilient materials are those having high yield strengths and low moduli of elasticity such alloys are used in spring applications. The energy expended in deforming the spring is stored in it and can be recovered when the spring returns to its original shape.
Q16) Define toughness and hardness.
A16)
Toughness:
The term toughness is defined as the property of metal by virtue which it can absorb maximum energy before fracture takes place.
Tenacity and hardness of a metal are the measures of its toughness.
It has been found the value of toughness fall with the rise in temperature.
Toughness of materials is indicated by the total area under the material tensile stress-strain curve up to the point of fracture.
Hardness:
The term “hardness” is defined as the property of metal by virtue of which it is able to resist abrasion, indentation (or penetration) and scratching by harder bodies.
It is measured by the resistance of the metal which it offers.
Q17) Elaborate the phenomenon of the Elastic recovery.
A17)
Elastic recovery:
Elastic recovery, or resilience, is a measure of the ability of an elastomer to return to its original shape when a compression load is removed. Ideally a seal should have a good resilience which can be largely controlled by compounding.
Ideally a seal should have a good resilience which can be largely controlled by compounding. It is a peculiarity of many elastomers, however, that resilience can vary widely with temperature, and with a sharply defined minimum value which commonly occurs in the range of –20 to +20 °C. Some elastomers, notably silicones, retain substantially constant resilience over a wide range of temperatures.
A low rating is desirable for dynamic seals, where recovery is important; this may refer to compression set or tension set and is a measure of the permanent change in original dimension after being compressed, or stretched, under compressive or tensile loading, respectively.
Compression Set is significant in that because most seals are loaded in compression some permanent reduction in dimension or shrinkage will occur, by the amount of set characteristic for that material. This may, however, be offset by other factors, such as swelling of the seal in contact with the fluid or can be allowed for in seal design.
Excessive Tension Set may result in a seal ring being a loose fit after being stretched in place over a rod because the seal does not recover to its original inside diameter to which the groove was matched. This would probably be offset by compression set on completion of the assembly and so tension is normally ignored.
The latter may be significant in plastomers which have low elongation and slow recovery, particularly if over-stretched. Both elastomers and plastomers, however, if loaded in tension, or with residual tensile stresses, will tend to contract with an increase in temperature.
Q18) Explain Rockwell and Brinell testing for determining the strength.
A18)
1. The Rockwell hardness:
This test is widely used because of its speed and freedom from personal errors.
This test requires much smaller penetrators and loads than used on Brinell hardness testers.
There are two scales on a Rockwell hardness testing machine, B-scale and C-scale.
While performing the Rockwell hardness test the following procedure is used:
- The test piece is placed on the machine’s test table.
- The test piece is raised by turning the hand wheel, till it just touches the indicator and the needle on the machine dial reads zero. This indicates that a minor load of 10 kg has been applied on the test sample by the machine and ensures is seated properly.
- After that a major load of 100 kg (for B-scale) or 150 kg (for C-scale) is applied by pressing the crank provided for this purpose.
- The depth of the indentation is recorded automatically by means of a dial scale. The reading is correlated with arbitrary hardness numbers.
2. Brinell hardness:
In this test a standard hardened steel ball of diameter D is presented into the surface of the specimen by a gradually applied load P which is maintained on the specimen for a definite period of time.
The impression of the steel ball (indentor) so obtained is measured by a microscope and the Brinell hardness number (BHN) is found by the following relations:
BHN=
=
P= Applied load, D= Diameter of steel ball and d=diameter of the impression, measured with a microscope.
A Brinell hardness tester is shown in figure below:
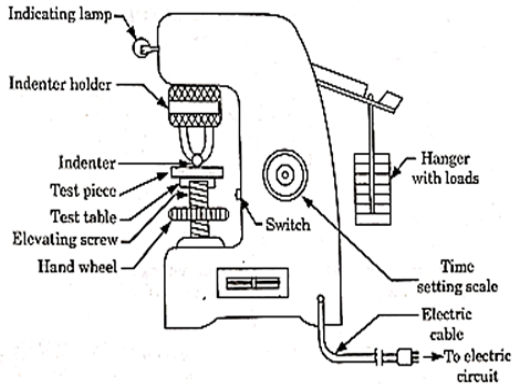
Figure: Brinell Hardness testing
The test sample is placed on the top of the test table which can be which can be raised by the elevating screw so that test sample just touches the ball.
The desired load is applied either mechanically or by oil pressure.
During this period the steel moves to the position of the sample and makes an impression or indentation.
The indentation diameter is measured at two places, either on the screen provided with the machine or by coinciding the two points of the reading microscope.