Unit – 1
Introduction to computer graphics
Q1) Introduce computer graphics?
A1) Computer graphics necessitates the use of technology. The Process turns data into a visual representation and displays it to the user. Insensible to the role of computer graphics. Computer graphics are becoming a widespread feature in user interfaces and commercial motion films on television.
The use of a computer to create images is known as computer graphics. A picture is the end product of computer graphics; it could be a business graph, drawing, or engineering.
Two-dimensional or three-dimensional images for research can be made using computer graphics. With the passage of time, many hardware devices algorithms have been developed to improve the speed of picture generation. It includes the creation storage of models and image of objects. These models for various fields like engineering, mathematical and so on.
Today's computer visuals are vastly different from those of the past. This isn't feasible. It is an interactive user interface that allows users to manipulate the structure of an item using a variety of input devices.
The more complex objects and operations are constructed by the primitives that are low level objects or the operations from higher level. The primitives are the basic elements used in computer graphics.
Lines, curves and polygons are the basic elements that are used to create complex graphical images in computer. The operations of basic primitives are used in programing language. To create any drawing in computer these primitives are used as software. To store the type of display the data is important.
Q2) Write the basics of graphics system?
A2) Following are the graphics primitives which are form together to create complex images in computer.
Graphics is made by this basic element that are used to create graphics application.
The most basic element of structure is pixel that is short of picture element.
Pixel:
It is a building block of graphics.
A pixel is the point of light or it is just a tiny dot on raster display.
Line:
The line is the especial build block of graphics it is used in various platform such as line graphs, bar and pie chart, 2D and 3D graphs in mathematical function, engineering drawing and architectural plans.
The straight line is developed in two ways as structural method which shows the pixels that should be set before drawing line and conditional method that is used to find the pixels which should be set next.
Resolution
A resolution of 100 dots line per inch has the dot size of 0.01 inch.
The resolution of CRT is related to the dot size.
Aspect ratio
The ratio of the distance between the center of two adjacent horizontal pixel to that of the vertical pixel is known as aspect ratio that is used in line generation algorithms.
Frame Buffer
The frame buffer is the video output device which drives a video display from the memory buffer as complete set of data.
The images are stored in terms of pixel by pixel.
The memory cane be disc, integrated circuits, etc.
Q3) What are Raster scan & Random scan displays?
A3) Random Scan Display
The electron beam is directed only to the area where picture has to be drawn.
It is also called as vector display.
It draws the picture as one line at time.
In any specified sequence the picture line can be drawn or refresh.
For ex. Pen plotter
Raster Scan Display
The raster scan display uses the CRT method.
It is based on television technology.
The electron beam in raster scan sweeps from top to bottom by covering one row at a time.
The beam is intensity on and off is creating the pattern of illuminated pattern of spots as it moves from each row.
The memory area is known as refresh buffer or frame buffer as it stores picture definition.
The memory area holds intensity values for all screen points.
The figure 1 shows the representation of scan line, vertical retrace and horizontal retrace in raster scan display.
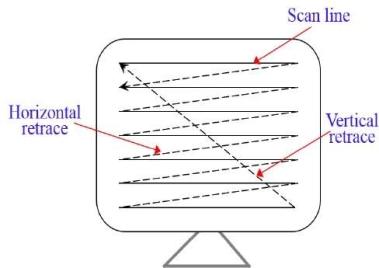
Fig 1: Raster line display
Q4) What is the Basic Display Processor?
A4) The display device is an output device which is used to represent the information in the form of images.
It is also known as the video monitor or video display unit (VDU).
These devices are designed to display, view, model or display information.
The main advantage of displaying is the sharing of information.
There are some display devices given below.
● Cathode-ray tube (CRT)
● Color CRT monitor
● Light emitting diode (LED)
● Liquid crystal display (LCD)
● Direct view storage tubes (DVST)
● Plasma display
● 3D display
Q5) Explain the raster graphic system?
A5) Raster graphics, often known as bitmap graphics, is a sort of digital image that represents an image by using tiny rectangular pixels, or picture elements, arranged in a grid configuration. The format is well-suited for presenting continuous-tone pictures such as photographs or shaded drawings, as well as other detailed images, because it can handle a wide range of colors and depict nuanced graded tones.
Raster graphics have its roots in television technology, with visuals built similarly to those shown on a television screen. A raster graphic is made up of a grid of columns and rows made up of tiny, evenly sized pixels. Depending on the degree of detail in the image, each pixel includes one or more pieces of information.
A black-and-white image, for example, contains only one bit per pixel (a binary bit can be in one of two states; thus, a single bit can represent white or black); an image with shading and color, on the other hand, typically contains 24 bits of information per pixel, resulting in 224, or more than 16 million possible states per pixel. 24-bit color, often known as "truecolor," can realistically depict color images.
The color depth refers to the number of bits recorded in each pixel. The resolution, or number of pixels, determines how much detail can be displayed in an image. The number of pixels in a column multiplied by the number of pixels in a row (for example, 800 600) is a common way to represent resolution.
Large file sizes are generally the result of detailed photographs, although file sizes can be reduced by using data compression. Compression can be lossy (meaning some data is lost) or lossless (no data is lost) (no data is lost).
GIF (graphics interchange format) and JPEG (joint photographic experts group) are lossy raster file formats, while BMP (Windows bitmap) and TIFF (tagged image file format) are lossless raster file formats.
Although raster graphics were used in some applications throughout the 1970s and 1980s, they were primarily limited to high-end graphics workstations (i.e., high-end computers that were specially optimized for working with graphics). Raster graphics became popular in the 1990s as personal computers' graphics capabilities improved. Raster graphics are used to create images from optical scanners and digital cameras, as well as the majority of photos on the Internet. Adobe Photoshop is a popular graphics application for working with raster pictures.
Q6) Write about vector graphic systems?
A6) In the 1960s and 1970s, vector graphics, which are made up of lines defined by mathematical formulas, were initially employed in computer displays. The displays were essentially modified oscilloscopes, and vector images were used instead of raster graphics, or bit-mapped graphics, because the RAM required for showing raster graphics was too expensive. Early arcade games, such as Asteroids, also featured vector graphics. Raster graphics, which employ dots called pixels to generate an image, had almost completely supplanted vector graphics displays by the 1980s.
However, vector graphics have made a comeback. Vector graphics are used by graphic designers to produce graphics that can be resized. The mathematical definition of each line, curve, shape, and color in vector graphics allows for the creation of pictures that can be scaled down for a business card or up for a billboard. The World Wide Web Consortium (W3C) created a graphics language called scalable vector graphics in response to the popularity of vector graphics (SVG). SVG is a royalty-free language that can include raster visuals as well as vector shapes and text. Geographic information systems are a common application for vector graphics in general, and SVG in particular (GIS). In GIS applications, SVG is used to create scalable and interactive maps.
Vector graphics, unlike JPEGs, GIFs, and BMP images, are not formed up of a grid of pixels. Vector graphics, on the other hand, are made up of pathways with a start and finish point, as well as other points, curves, and angles along the way. A path can take the form of a straight line, a square, a triangle, or a curved shape. Simple or sophisticated diagrams can be created using these routes. Even the characters of certain typefaces are defined using paths.
Vector-based graphics can be scaled to any size without losing image quality since they are not made up of a specific number of dots. When a raster graphic is blown up, it appears blocky or "pixelated." When a vector graphic is blown up, the edges of each object within it remain smooth and clean. Vector images are perfect for logos because they may be small enough to fit on a business card yet large enough to fill a billboard. Adobe Illustrator, Macromedia Freehand, and EPS files are examples of vector graphics. Vector graphics are used in many Flash animations because they scale better and take up less space than bitmap images.
Q7) Describe a video display unit?
A7) The display device is an output device which is used to represent the information in the form of images.
It is also known as the video monitor or video display unit (VDU).
This device is designed to display, view, model or display information.
The main advantage of displaying is the sharing of information.
There are some display devices given below.
- Cathode-ray tube (CRT)
- Color CRT monitor
- Light emitting diode (LED)
- Liquid crystal display (LCD)
- Direct view storage tubes (DVST)
- Plasma display
- 3D display
Cathode ray tube (CRT)
It is a traditional computer monitor and television.
It a particular type of vacuum tube that displays images when an electron beam collides on the radiant surface.
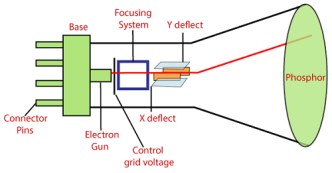
Fig 2: CRT
Following are the elements of the CRT.
Electron gun: it is focused on narrow beam facing the CRT
Focusing and accelerating anodes: Used to produce a narrow and sharply focused beam of electrons.
Horizontal and vertical deflection plates: used to guide the path of the electron beam which produces the electromagnetic field that bends the electron beam through the area as it travels.
Phosphorus coated screen: used to produce bright spots when the high velocity electron beam hits it
Color CRT Monitor
It is same as CRT monitor.
It is basically used to combine three colors that is red, green and blue.
By using these three colors we can create millions on different colors.
There are two basic color display producing techniques are given below:
a) Beam Penetration Method:
It is used with a random scan monitor for displaying picture.
In this there are two phosphorus layers that are red and green which are coated inside the screen.
The colors are depending on how far the electron beam penetrates the phosphorus surface.
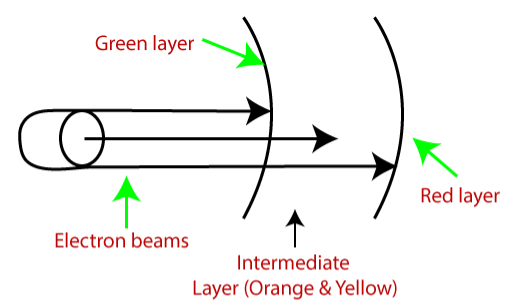
Fig 3: Beam Penetration Method
b) Shadow Mask Method:
It is used with raster scan monitor for displaying pictures.
It has more range of color than beam penetration method.
It is used in television sets and monitor.
It has three phosphorus color dots at each position of the pixel.
First for red color, second for green and third for blue color.
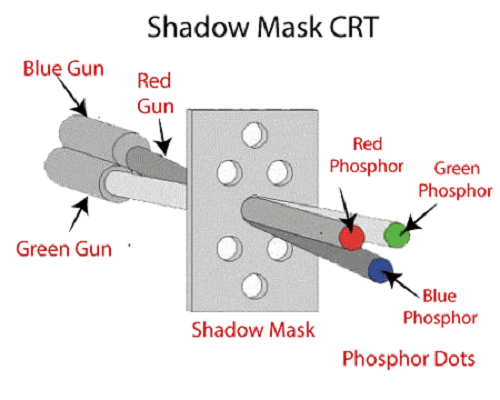
Fig 4: Shadow mask CRT
Liquid Crystal Display (LCD)
It is depending on the light modulating properties of liquid crystal.
It requires the AC power than DC hence it is difficult to use in circuit.
It uses watches and portable computers.
It consumes less power than LED and also it works on flat panel display technology.
It uses the liquid crystal to turn on or off the pixels.
Light Emitting Diode (LED)
It is a semiconductor device.
It emits when current passes through it.
It has small size hence we can make any display unit by arranging a large number of LEDs.
It consumes more power than LCD.
It is used in TV, smartphones, motor vehicles, traffic light, etc.
It has power to stand with mechanical pressure as it is powerful.
It also works at high temperature.
Direct View Storage Tube (DVST)
It is used to store the picture information as charge distribution behind the phosphorus coated screen.
It has two guns:
Primary gun: used to store the picture information
Flood or secondary gun: used to display a picture on the screen.
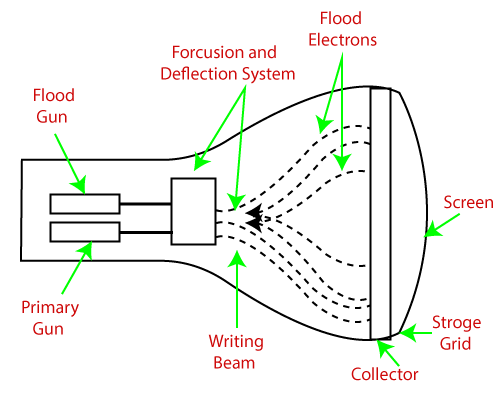
Fig 5: Direct View Storage Tube
Plasma Display
It is also called as gas discharge display.
It is type of flat panel display which uses tiny plasma cells.
It has following components:
Anode: used to deliver a positive voltage.
Cathode: used to provide negative voltage to gas cell
Gas plates: works as capacitor. As soon as the voltage passes, the cell lights regularly.
Fluorescent cell: As soon as the voltage passes to the neon gas it emits light.
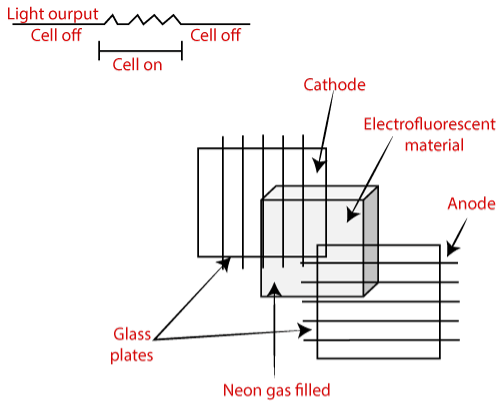
Fig 6: Plasma Display
3D Display
It is also called as stereoscope display technology.
It has capability to bring depth perception to the viewer.
It is used in 3D gaming and 3D TVs.
Some examples of 3D display are such as holographic display, retina display, fog display, etc.
Q8) What are the physical input devices?
A8) Physical input devices are input devices that have a specific hardware architecture.
Keyboard devices, such as regular keyboards, flexible keyboards, and handheld keyboards, are two of the most common types of physical input devices. Character input, such as letters, numerals, and symbols, is provided through these.
Mouse, track ball, light pen, and other pointing devices These are used to specify the computer screen's location.
Keyboard
It's a standard keyboard with a variety of characters. We represent the character with an ASCII value, and it interacts with the programmer by passing the ASCII value of the key pressed by the programmer. The software can be given a single character or an array of characters as input.
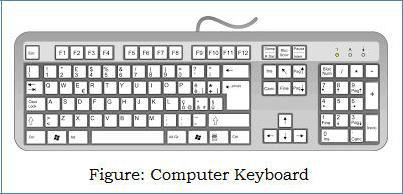
Fig 7: Keyboard
Mouse
These are pointing devices that are used to indicate a location. The position of the clicked button is passed to the application software by the mouse and trackball. In terms of functionality and design, these two devices are very similar. In these devices, a pair of encoders inside the device transform the ball's motion into a signal that is relayed back to the computer. The motion of these encoders is measured in two orthogonal directions.
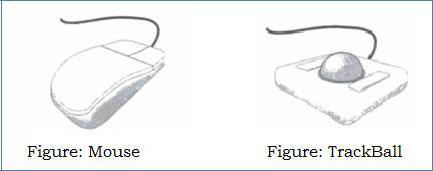
Fig 8: Mouse
The pointing device values can be interpreted as positions and transformed to a 2-D location in either screen or world coordinates. As a mouse moves across a surface, the integrals of the velocities produce x,y values that can be transformed to display a cursor's position on the screen, as seen below:
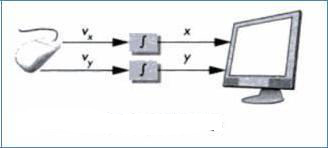
Fig 9: Cursor positioning
Because changes in the position of the ball result in a position in the user program, these devices are referred to as relative positioning devices.
Data tablets
It allows for precise positioning. Underneath its surface are rows and columns of wires. Electromagnetic interactions between signals traveling through cables and sensors in the stylus define the stylus' location.
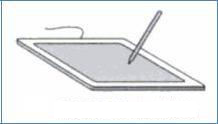
Fig 10: Data tablet
Light pen
It is made up of a light-sensing device called a "photocell." The light pen is held in front of the computer monitor. Light is emitted from the CRT when the electron beam strikes the phosphor. If the value exceeds the threshold, the light pen's light sensor device sends a signal to the computer, which specifies the position.
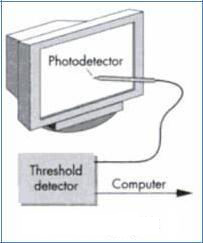
Fig 11: Light pen
The main disadvantage is that it is difficult to find a spot on the screen that corresponds to a dark area.
Joysticks
To identify a screen position, the motion of the stick in two orthogonal directions is encoded, read as two velocities, and integrated. The integration implies that the cursor position remains unchanged if the stick is left in its resting position. The screen location changes faster the faster the stick is moved from its resting position. As a result, a joystick is a device with changeable sensitivity.
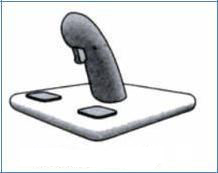
Fig 12: Joystick
The advantage is that mechanical parts such as springs and dampers are used to provide resistance to the user when pushing it. Such a mechanical sensation is appropriate for applications like flight simulators and game controllers, among others.
Space ball
It's a three-dimensional input device that resembles a joystick with a ball at the end.
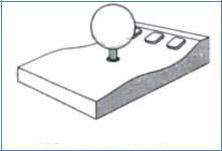
Fig 13: Space ball
The stick does not move; instead, pressure sensors in the ball measure the user's forces. Not only can the space ball measure three direct forces (up-down, front-back, and left-right), but it can also measure three independent twists. As a result, the entire device measures six distinct values and so has six degrees of freedom.
Q9) What do you mean by logical input devices?
A9) GKS divides data that can be entered into an application software into six categories, each of which is associated with a logical input device. The physical input devices are mapped to these logical devices, allowing GKS to organize various types of data in a device-independent manner and thereby aiding in the portability of the code. Three characteristics distinguish a logical input device:
● A workstation identifier
● An input class
● A device number
The six input classes and the logical input values they provide are:
Locator
Returns a World Coordinates position (an x,y value) and the Normalization Transformation number that was used to map back from Normalized Device Coordinates to World Coordinates. The viewport with the highest Viewport Input Priority is represented by the NT (set by calling GSVPIP).
CALL GSVPIP(TNR, RTNR, RELPRI)
TNR
Transformation Number
RTNR
Reference Transformation Number
RELPRI
One of the values 'GHIGHR' or 'GLOWER' defined in the Include File, ENUM.INC, which is listed in the Appendix on Page
STROKE
As with the Locator, returns a sequence of (x,y) locations in World Coordinates and a Normalization Transformation.
VALUATOR
Returns a real value, which can be used to operate analogue devices.
CHOICE
Returns a non-negative integer that represents a pick from among numerous options. This may, for example, be implemented as a menu.
STRING
Returns a character string from the keyboard.
PICK
Returns the segment name and pick identifier of an object that the user has selected. As a result, the application doesn't have to use the locator to return a position and then figure out which object it belongs to.
Q10) Explain colour model?
A10) CIE Chromaticity Diagram
CIE stands for Commission Internationale Eclairage.
The RGB values become unpleasant when the values of RGB representation are negative.
It is defined in 1931 in base terms of virtual primary axes X, Y and Z.
This axes are used to allow to match all visible colors as linear combination with positive coefficient only.
Hence it is known as the chromaticity values X, Y, Z.
The visible colors can be expressed as the C=XX+YY+ZZ.
The normalization processed and it becomes X+Y+Z=1.
This gives new coordinates as x, y and z =1-x-y which are independent on luminous energy X+Y+Z.
The coordinates of visible chromatic value form a horseshoe shaped region with the spectrally pure colors on the curved boundary.
Following figure 14 (a) shows the horseshoe shape of the visible region.
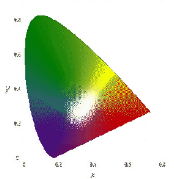
Fig 14(a)
Following is the figure 14 (b) of CIE chromaticity.
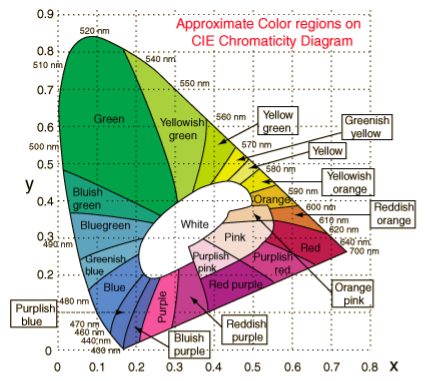
Fig 14(b)
Color Gamut
The color gamut is used to describe the range of color within the spectrum of colors.
This colors are identified by by the human eye i.e. visible color spectrum.
It is a subset of colors used in computer graphics.
The subset of colors are used to represent the given circumstances within given color space.
The output device generally use gamut to sense the original colors which are lost in process.
Following figure 14 (c) shows the color Gamut.
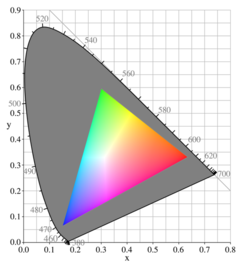
Fig 14 (c)
YCbCr
It is used as part of image color.
It is used in pipeline video, digital photography systems.
It is also reffered as YPb/Cb Pr/Cr, Y’CbCr.
Y’ is the luma component and Cb and Cr are the blue ab=nd red difference chroma components.
Y’ is difeered by Y i. e. Luminance (light intensity is nonlinear based on gamma corrected RGB primaries)
This color space can defined by mathematical coordinate transformation from associated RGB colors.
Following figure 14 (d) shows the representation of RGB to YCbCr transformation.
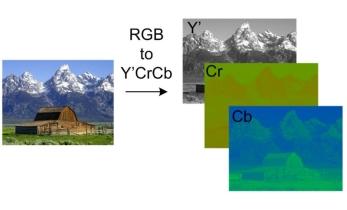
Fig 14(d)
RGB
It is color space which is commonly used.
RGB stands for Red Green Blue.
The RGB model states that the image having more colors and that colors are made up of three different images i.e red image, black image and blue image.
The grayscale image is shown by only one matrix but color image is shown by three different matrices.
One color image matrix contains: red matrix + green matrix + blue matrix
Application of RGB
● Liquid crystal display (LCD)
● Plasma display or LED display such as TV
● Cathode ray tube (CRT)
● Compute monitor or large scale screen
HSV
It is also known as HSB (Hue Saturation Brightness)
HSV stands for Hue Saturation Value.
In HSV there are three main components are: Hue, saturation and the value.
It defines the shades and the brightness of the color.
It may be depicted as cone or cylinder.
There are secondary colors In HSV are red, yellow, green, cyan, blue and magenta.
It also having the mixture of adjacent pairs of them.
It is an alternative representation of RGB model.
The colors of each hue are arrange in radial slice.
The slices are placed around the central axis of neutral colors.
This neutral colors are ranges from the black at the bottom to white at the top.
The saturation dimension resembling various tints of brightly colored paint that colors are mix together to represent the HSV color model.
The value dimension resembling the mixture of paint is vary with the amount of black and white color.
The geometric cylinder of HSV starts with red primary at 00 passing through green primary at 120o and blue at 240o , then back to red 360o.
The geometry of central vertical axis comprises neutral, achromatic or gray colors ranging from top to bottom.
The range starts from the white at lightness 1 to black at lightness 0.
Following is the figure 14 (e) of HSV.
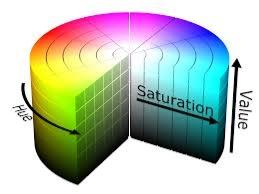
Fig 14 (e)
CMY
The CMY color model is a subtractive color model.
The CMY color model named from three colors as Cyan Magenta Yellow.
It contains the cyan, magenta and yellow color.
Thus main colors are used to reproduce various colors of array.
Thus are the primary color but this is not used to specify as absolute because of CMY does not meant by cyan, magenta and yellow mixture.
When the cyan, yellow and magenta becomes exact chromaticity’s of color then it can be specified as absolute color space.
The mixture of subtracted dyes of wavelength from the spectral power distribution of the illuminating light.
The illuminating light which scatters back into the viewer’s eyes and perceives as colors.
Following figure 14 (f) shows the CMY color model.
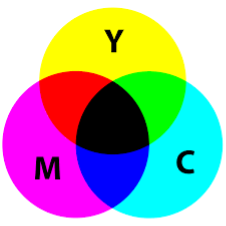
Fig 14(f)
Q11) Why do we use computer graphics?
A11) Let's imagine a shoe manufacturer wants to illustrate the sales of shoes over a five-year period. It is necessary to store such a large amount of data. As a result, a significant amount of time and memory will be required. This strategy will be difficult for the average person to comprehend. Graphics is a better option in this circumstance. Charts and graphs are examples of graphic tools. Data can be expressed in a graphical format using graphs. A single glance at an image is all it takes to understand it.
The concept of two-way communication between computer users is used in interactive computer graphics. The computer receives signals from the input device and adjusts the image accordingly. When we use the command, the picture will change swiftly.
Q12) Write the application of computer graphics?
A12) Computer Graphics has numerous applications, some of which are listed below:
● Computer graphics user interfaces
● GUIs
● GUIs − A graphic, mouse-oriented paradigm which allows the user to interact with a computer.
● Business presentation graphics − "A picture is worth a thousand words".
● Cartography − Drawing maps.
● Weather Maps − Real-time mapping, symbolic representations.
● Satellite Imaging − Geodesic images.
● Photo Enhancement − Sharpening blurred photos.
● Medical imaging − MRIs, CAT scans, etc. - Non-invasive internal examination.
● Engineering drawings − mechanical, electrical, civil, etc. - Replacing the blueprints of the past.
● Typography − The use of character images in publishing - replacing the hard type of the past.
● Architecture − Construction plans, exterior sketches - replacing the blueprints and hand drawings of the past.
● Art − Computers provide a new medium for artists.
● Training − Flight simulators, computer aided instruction, etc.
● Entertainment − Movies and games.
● Simulation and modeling − Replacing physical modeling and enactments