Unit – 2
Points & lines
Q1) Describe points and lines?
A1) The point on a line, which lie between two end points p1 and p2.

Just as in English textbooks the correct words are used for making correct sentences; in Engineering Graphics, the details of various objects are drawn by different types of lines. Each line has a definite meaning and sense to convey.
IS 10714 (Pint 20): 2001 (General principles of presentation on technical drawings) and SP 46:2003specify the following types of lines and their applications:
1. Visible Outlines, Visible Edges: (Continuous wide lines)
The lines drawn to represent the visible outlines/ visible edges / surface boundary lines of objects should be outstanding in appearance.
2. Dimension Lines: (Continuous narrow Lines)
Dimension Lines are drawn to mark dimension.
3. Extension Lines: (Continuous narrow Lines)
There are extended slightly beyond the respective dimension lines.
4. Construction Lines: (Continuous narrow Lines)
Construction Lines are drawn for constructing drawings and should not be erased after completion of the drawing.
5. Hatching / Section Lines: (Continuous Narrow Lines)
Hatching Lines are drawn for the sectioned portion of an object. These are drawn inclined at an angle of 45° to the axis or to the main outline of the section.
6. Guide Lines: (Continuous Narrow Lines)
Guide Lines are drawn for lettering and should not be erased after lettering.
7. Break Lines: (Continuous Narrow Freehand Lines)
Wavy continuous narrow line drawn freehand is used to represent break of an object.
8. Break Lines: (Continuous Narrow Lines with Zigzags)
Straight continuous arrow line with zigzags is used to represent break of an object.
9. Dashed Narrow Lines: (Dashed Narrow Lines)
Hidden edges / Hidden outlines of objects are shown by dashed lines of short dashes of equal lengths of about 3 mm, spaced at equal distances of about 1 mm. The points of intersection of these lines with the outlines / another hidden line should be clearly shown.
10. Center Lines: (Long-Dashed Dotted Narrow Lines)
Center Lines are drawn at the center of the drawings symmetrical about an axis or both the axes. These are extended by a short distance beyond the outline of the drawing.
11. Cutting Plane Lines:
Cutting Plane Line is drawn to show the location of a cutting plane. It is long-dashed dotted narrow line, made wide at the ends, bends and change of direction. The direction of viewing is shown by means of arrows resting on the cutting plane line.
12. Border Lines
Border Lines are continuous wide lines of minimum thickness 0.7 mm.
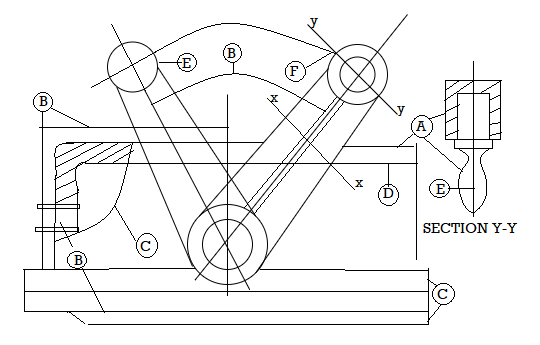
Fig: Types of lines
Table: Types of lines and their applications
Line | Description | General application |

| Continuous thick or continuous wide | Visible outlines, visible edges, main representation in diagrams, maps; system lines |

| Continuous thin (narrow) (straight or curved) | Imaginary lines of intersection; grid, dimension. Extension, projection, reference lines and hatching. |

| Continuous thin (narrow) freehand. | Limits of partial or interrupted views and sections, if the limit is not a chain thin line. |
 
| Continuous thin (narrow) with zigzags (straight) | Long break line |
 | Dashed thick (wide) | Line showing permissible of surface treatment. |
 | Dashed thin (narrow) | Hidden outline; hidden edges |
 | Chain thin Long-dashed dotted (narrow) | Centre line; lines of symmetry; trajectories; pitch circle of gears, pitch circle of holes. |
 | Chain thick or long - dashed (dotted) wide | Indication of lines or surfaces to which a special requirement applies. |
Line widths:
Line width means line thickness
Choose line widths according to the size of the drawing from the following range: 0.13, 0.18, 0.25, 0.35, 0.5, 0.7 and 1 mm.
Precedence of Lines
1. When a Visible Line coincides with a Hidden Line or Center Line, draw the Visible Line. Also, extend the Center Line beyond the outlines of the view.
2. When a Hidden Line coincides with a Center Line, draw the Hidden Line.
3. When a Visible Line coincides with a Cutting Plane, draw the Visible Line.
4. When a Center line coincides with a Cutting Plane, draw the Center Line and show the Cutting Plane line outside the outlines of the view at the ends of the Center Line by thick dashes.
Q2) Define DDA algorithm?
A2) A line connects two points.
It is a basic element in graphics.
Two points are required to draw a line as X0, Y0, and X1, Y1.
Digital Differential Analyzer (DDA)
The digital differential analyzer (DDA) is a simple line generation algorithm.
The line connects two points.
Hence to draw any line we need at least two points.
Hence we prefer one point as (X1, Y1) and the second point is (X2, Y2).
Following are some steps to perform the DDA algorithm.
Step 1: Get the input (X1, Y1) and (X2, Y2)
Step 2: Calculate the slope of the line using inputs.
M= Y2-Y1/X2-X1
Step 3: according to the slope of the line, we need to decide the case which gives the next point of the line.
Following are three cases are used to solve the DDA algorithm.
Case 1: m<1 Xn=X1+1 and Yn=Y1+m
Case 2: m>1 Xn=X1+1/m and Yn=Y1+1
Case 3: m=1 Xn=X1+1 and Yn=Y1+1
Step 4: the process continues till we get the input point(X2, Y2). Then the line generates with the help of coordinates that we occur.
DDA is the line generation algorithm where the line connects two points.
Three cases are used to solve the line problems.
Cases are: m<1, m>1 and m=1
As the cases occurred the steps will be followed by case steps.
Example:
Inputs: (X1,Y1) = (0,0) and (X2,Y2) = (8,4)
M= Y2-Y1/X2-X1
M=4-0/8-0
M = 0.5
Here M=0.5
Hence follow case 1 where M<1 then Xn=X1+1 and Yn=Y1+m
X1 | Y1 | Xn | Yn |
0 | 0 | 0 | 0 |
0+1=1 | 0+0.5=0.5 | 1 | 1 |
1+1=2 | 0.5+0.5=1 | 2 | 1 |
2+1=3 | 1+0.5=1.5 | 3 | 2 |
3+1=4 | 1.5+0.5=2 | 4 | 2 |
4+1=5 | 2+0.5=2.5 | 5 | 3 |
5+1=6 | 2.5+0.5=3 | 6 | 3 |
6+1=7 | 3+0.5=3.5 | 7 | 4 |
7+1=8 | 3.5+0.5=4 | 8 | 4 |
At last, we get the last point (X2, Y2) = (8,4) we stop.
Q3) What is the Bresenham algorithm?
A3) It is another line generation algorithm known as incremental scan conversion algorithm.
It uses only integer calculations.
Following are steps to perform bresenham’s algorithm.
Step 1: Get the input (X1,Y1) and (X2,Y2)
Step 2: Find decision parameter Pk and P0
Pk=2 ∆Y - ∆X
Where ∆X=X2-X1 and ∆Y=Y2-Y1
Step 3: according to the value of Pk we need to decide the case which gives the next point of line.
Following are three cases are used to solve the bresenham’s algorithm.
Case 1: Pk>0, Pk+1=Pk + 2 ∆Y - 2 ∆X
Where Xn=X1+1 and Yn=Y1+1
Case 2: Pk<0, Pk+1=Pk + 2 ∆Y
Where Xn=X1+1 and Yn=Y1+1
Step 4: the process continues till we get the input point(X2, Y2). Then the line generates with the help of coordinates that we occur.
Example:
Step 1: Get the input (X1,Y1) and (X2,Y2)
(X1,Y1)=(20,10) and (X2,Y2)=(30,18)
Step 2: find decision parameter Pk and P0
Pk=2 ∆Y - ∆X
Where ∆X=X2-X1=30-20=10 and∆Y=Y2-Y1=18-10=8
Hence, Pk=2 ∆Y - ∆X = 2*8-10= 16-10=6
Pk | Xn | Yn |
>0 | 21 | 11 |
2>0 | 22 | 12 |
-2<0 | 23 | 12 |
14>0 | 24 | 13 |
10>0 | 25 | 14 |
6>0 | 26 | 15 |
2>0 | 27 | 16 |
-2<0 | 28 | 16 |
14>0 | 29 | 17 |
10>0 | 30 | 18 |
At last we get the last point (X2, Y2)=(30,18) we stop.
Q4) Explain circle generation algorithm?
A4) It is difficult to draw a circle than a line drawing.
The equation of a circle is r2=X2+Y2
There is some circle drawing algorithm as follows:
● Digital differential analyzer (DDA) circle drawing algorithm
● Bresenham’s circle drawing algorithm
● Midpoint circle drawing algorithm
Digital Differential Analyzer (DDA) Circle Drawing Algorithm
This algorithm uses the incremental method to draw each point.
The algorithm calculates the starting point and by the value of E, the value of x and y coordinates will be increased and decreases respectively.
The equation of a circle is r2=X2+Y2
To calculate the value of E,
We have a formula,
2n-1<=r <=2n where r = radius of circle
E=2^-n=1/2^n
E is used to calculate the value of circle point which helps to draw a circle as
X2=X1+E Y1 for x and
Y2=Y1- E X2 for y
Algorithm:
Step 1: Read the radius r of the circle and calculate the value of E
Step 2: Start X=0 i.e. initial point and
Start Y=r i.e. radius
Step 3: X1=0 and Y1=r
Step 4:
Do {
X2=X1+E Y1
Y2=Y1-E X2
//Here X2 represents Xn+1 and X1 represent Xn
//Xn is from the equation of a circle
Plot (int X2, int Y2)
//here swapping points to calculate next closest pixel
X1=X2
Y1=Y2
}
While ((Y1-Y0)< E or (X0-X1)>E)
//here, while the condition is to check the current position, is a starting point or not, if the current point is not starting point then repeats.
Step 5: stop
Q5) What is Bresenham’s Circle Drawing Algorithm?
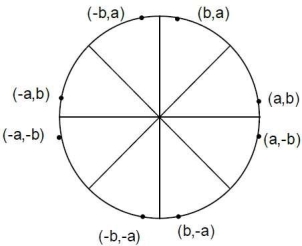
A5) The following circle shows the 8 portions from which we will occur the coordinates of the circle.
Algorithm:
Step 1: input of circle radius r, (Xc, Yc)
Step 2: initial value X=0 and Y=r
Step 3: plot pixel (X+Xc, Y+Yc)
Step 4: decision parameter Pk=3-2r
Step 5: Start of the loop
If Case 1:
If Pk<0 then Pk+1=Pk+4X+6
Where Xn=X+1 and Yn=Y
Else Case 2:
If Pk>0 then Pk+1=Pk+4(X-Y)+10
Xn=X+1 and Yn=Y-1
Step 6: X=Y stop
Figure shows the portion of the circle where 8 points are required to form a circle using bresenham’s algorithm.
Here are we need to calculate the value of Pk and then the cases occur.
As the case s as Pk<0 and Pk>0 suits the value of x and y coordinates are calculated.
Example:
Given R=10
Hence Y=R
If we want to draw a circle in the center then we have given the center points as (Xc, Yc)=(2,2)
Decision parameters are Pk and P0.
P0=3-2r
Here, P0=3-2*10=3-20=-17
Hence Pk=P0= -17
Following are two cases that will be decided according to Pk’s value.
Case 1:
If Pk<0 then Pk+1=Pk+4X+6
Where Xn=X+1 and Yn=Y
Case 2:
If Pk>0 then Pk+1=Pk+4(X-Y)+10
Xn=X+1 and Yn=Y-1
Pk | Xn | Yn |
-17<0 | 0 | 10 |
-17+4*1+6=-7<0 | 1 | 10 |
-7+4*2+6=7>0 | 2 | 10 |
7+4*(3-9)+10=-7<0 | 3 | 9 |
-7+4*4+6=15>0 | 4 | 9 |
15+4*5-4*8+10=-7<0 | 5 | 8 |
-7+4*6+6=23>0 | 6 | 8 |
| 7 | 7 |
Here X=Y then stop
Q6) What do you mean by scan line polygon?
A6) This technique fills the polygon between pairs of crossings by intersecting scan lines with polygon edges. The steps below show how this algorithm works.
Step 1 − Find out the Ymin and Ymax from the given polygon.
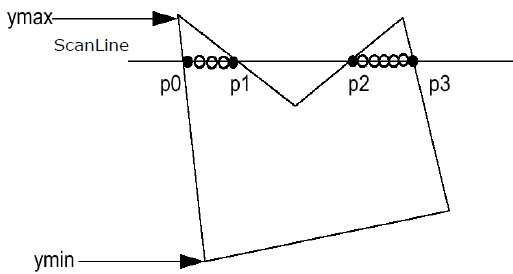
Step 2 – Scan Line intersects with each edge of the polygon from Ymin to Ymax. Name each intersection point of the polygon. As per the figure shown above, they are named as p0, p1, p2, p3.
Step 3 − Sort the intersection point in the increasing order of X coordinate i.e. p0,p1, p1,p2, and p2,p3.
Step 4 − Fill all those pair of coordinates that are inside polygons and ignore the alternate pairs.
Q7) Explain boundary fill algorithm?
A7) The border fill algorithm does exactly what it says. This algorithm selects a spot within an object and fills it until it reaches the object's boundary. For this algorithm to work, the color of the boundary and the color of the fill must be distinct.
The color of the boundary is assumed to be the same throughout the object in this algorithm. 4-connected pixels or 8-connected pixels can be used to implement the border fill technique.
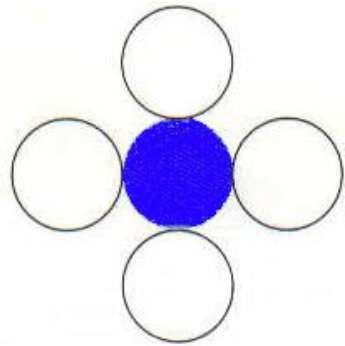
4-Connected Polygon
As indicated in the diagram, this approach employs four connected pixels. We are adding pixels above, below, to the right, and to the left of the present pixels, and this process will continue until we reach a color boundary.
Algorithm
Step 1 − Initialize the value of seed point seedx,seedy, fcolor and dcol.
Step 2 − Define the boundary values of the polygon.
Step 3 − Check if the current seed point is of default color, then repeat the steps 4 and 5 till the boundary pixels reached.
If getpixel(x, y) = dcol then repeat step 4 and 5
Step 4 − Change the default color with the fill color at the seed point.
SetPixel(seedx, seedy, fcol)
Step 5 − Recursively follow the procedure with four neighborhood points.
FloodFill (seedx – 1, seedy, fcol, dcol)
FloodFill (seedx + 1, seedy, fcol, dcol)
FloodFill (seedx, seedy - 1, fcol, dcol)
FloodFill (seedx – 1, seedy + 1, fcol, dcol)
Step 6 − Exit
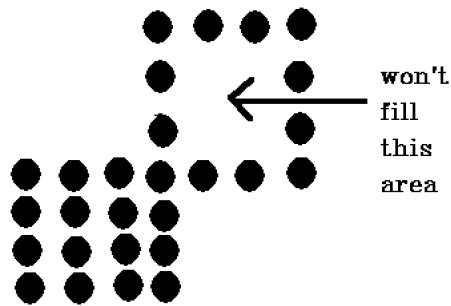
There is an issue with this method. Consider the following example, in which we attempted to fill the full region. The image is just half filled in this case. In such instances, the four-connected-pixels approach is ineffective.
8-Connected Polygon
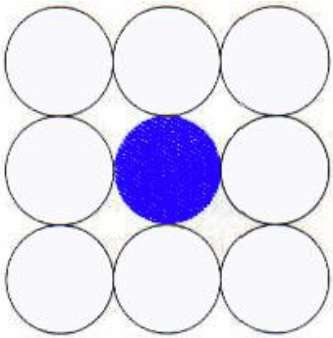
8-connected pixels are employed in this technique, as seen in the picture. As in the 4-connected technique, we are placing pixels above, below, right, and left of the existing pixels.
Furthermore, we place pixels in diagonals such that the complete region of the current pixel is covered. This procedure will be repeated until a boundary of a different hue is discovered.
Algorithm
Step 1 − Initialize the value of seed point seedx, seedy, fcolor and dcol.
Step 2 − Define the boundary values of the polygon.
Step 3 − Check if the current seed point is of default color then repeat the steps 4 and 5 till the boundary pixels reached
If getpixel(x,y) = dcol then repeat step 4 and 5
Step 4 − Change the default color with the fill color at the seed point.
SetPixel(seedx, seedy, fcol)
Step 5 − Recursively follow the procedure with four neighbourhood points
FloodFill (seedx – 1, seedy, fcol, dcol)
FloodFill (seedx + 1, seedy, fcol, dcol)
FloodFill (seedx, seedy - 1, fcol, dcol)
FloodFill (seedx, seedy + 1, fcol, dcol)
FloodFill (seedx – 1, seedy + 1, fcol, dcol)
FloodFill (seedx + 1, seedy + 1, fcol, dcol)
FloodFill (seedx + 1, seedy - 1, fcol, dcol)
FloodFill (seedx – 1, seedy - 1, fcol, dcol)
Step 6 – Exit
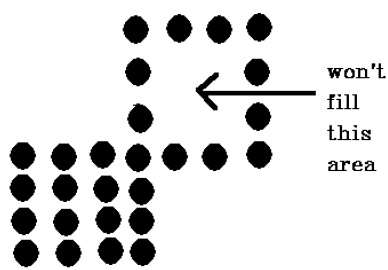
The 4-connected pixel technique failed to fill the area as marked in the following figure which won’t happen with the 8-connected technique.
Q8) What is a flood fill algorithm?
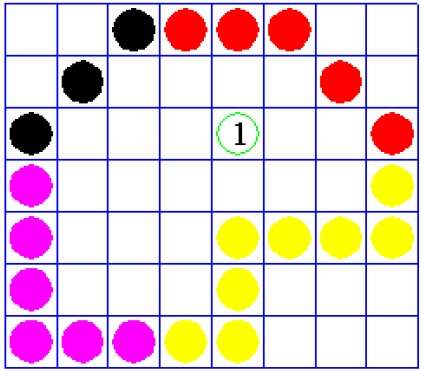
A8) We occasionally come into an object where we wish to use multiple colors to fill the region and its boundaries. Instead of searching for a specific boundary color as in the boundary filling algorithm, we can paint such objects with a specified inside color.
Instead of relying on the object's boundaries, the fill color is used. In other words, it uses the fill color to replace the object's internal color. The algorithm is finished when there are no more pixels of the original inner color.
This algorithm uses the Four-Connect or Eight-Connect approach to fill in the pixels once again. However, rather than looking for the boundary color, it searches for all nearby pixels that are part of the interior.
Disadvantages
● The algorithm is really sluggish.
● It's possible that big polygons will fail.
● The initial pixel necessitated a greater understanding of the surrounding pixels
Algorithm
Procedure floodfill (x, y,fill_ color, old_color: integer)
If (getpixel (x, y)=old_color)
{
Setpixel (x, y, fill_color);
Fill (x+1, y, fill_color, old_color);
Fill (x-1, y, fill_color, old_color);
Fill (x, y+1, fill_color, old_color);
Fill (x, y-1, fill_color, old_color);
}
}
Q9) Compare boundary and flood fill algorithm?
A9) Comparison between boundary and flood fill algorithm
BASIS FOR COMPARISON | FLOOD-FILL ALGORITHM | BOUNDARY-FILL ALGORITHM |
Basic
| It can have an area containing several colours. | It defines the area with a single colour. |
Painting process
| A random colour can be used to colour the interior portion then the old one is replaced with a new one. | Interior points are coloured by continuously searching for the boundary colour. |
Memory consumption | High | Low |
Speed | Comparatively slower | Fast |
Algorithm complexity | Simple relatively | Complicated
|
Q10) Write the difference between DDA and Bresenham algorithm?
A10) Difference between DDA and Bresenham algorithm
BASIS FOR COMPARISON | DDA ALGORITHM | BRESENHAM ALGORITHM |
Efficiency | Low | High |
Calculations involved | Complex | Simple |
Speed | Comparatively less | More |
Operations used | Multiplication and division | Additions and subtraction |
Arithmetic computation values | Floating point | Integer type |
Precision | Low | High |
Cost | Expensive | Moderate or cheaper relatively. |
Optimization | Not provided | Provided |