Unit – 5
Hidden Surfaces
Q1) What do you mean by hidden surface?
A1) The hidden surface is used to remove the parts from the image of solid objects.
The hidden surface is disabled by using opaque material which obstructs the hidden parts and prevents us from seeing them.
The automatic elimination does not happen when the objects are projected onto the screen coordinate system.
To remove some part of the surface or object we need to apply a hidden line or hidden surface algorithm to such objects.
The algorithm operates on the different kinds of models.
The model will generate various forms of output or different complexities in images.
The geometric sorting algorithms are used for distinguishing the visible parts and invisible parts.
The hidden surface algorithm is generally used to exploit one or many coherence properties to increase efficiency.
Following are the algorithms that are used for hidden line surface detection.
● Backface removal detection
● Depth buffer (z-buffer) algorithm
● depth sort (Painter) algorithm
● Area subdivision algorithm
Q2) What is depth comparison?
A2) Because object depth is commonly measured from the view plane along the z-axis, this method is also known as the depth buffer method or the z-buffer method.
Each surface of a scene is analyzed separately, one point on the surface at a time.
The method is used on scenes with polygon surfaces.
Each (x,y,z) position on a polygon surface corresponds to the orthographic projection point (x,y) on the view plane when object descriptions are transformed to projection coordinates.
[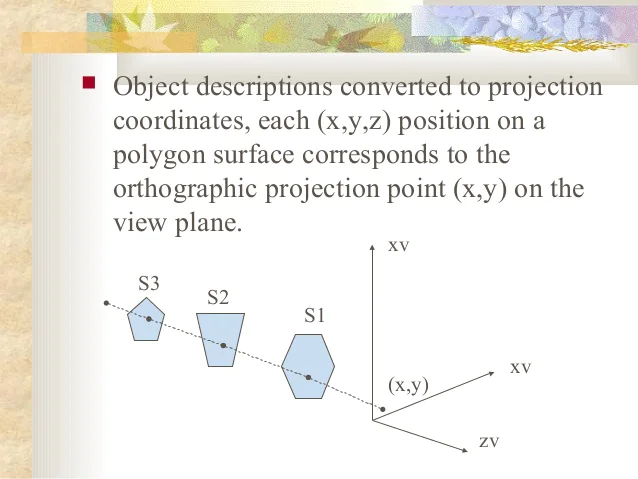
Fig 1: Projection coordinates
In normalized coordinates, the Depth Buffer algorithm is applied.
A total of two buffer zones are necessary.
(i) As surfaces are analyzed, a depth buffer is used to hold depth data for each (x,y) point.
(ii) For each position, a refresh buffer records the intensity value.
Initially, Depth buffer = 0(min depth) refresh buffer = background intensity.
After that, each surface is scanned, and the depth(z value) at each (x,y) pixel point is calculated.
The depth value calculated is compared to the previous one stored in the buffer.
If the calculated value is greater than the depth buffer value, the new depth value is saved, and the intensity at the point is stored in the refresh buffer.
Q3) Write about the Z buffer algorithm?
A3) A Depth Buffer Algorithm is another name for it. The simplest image space algorithm is the depth buffer algorithm. We keep track of the depth of an object within the pixel nearest to the observer for each pixel on the display screen. We also record the intensity that should be presented to show the object, in addition to the depth. The depth buffer is a frame buffer expansion. The depth buffer approach necessitates two arrays, one for intensity and the other for depth, both of which are indexed by pixel coordinates (x, y).
It is the simplest image-space algorithm. The depth of the object is computed by each pixel of the object displayed on the screen from this we get to know about how an object closer to the observer. The record of intensity is also kept with the depth that should be displayed to show the object.
It is an extension of the frame buffer. Two arrays are used for intensity and depth, the array is indexed by pixel coordinates (x,y).
Algorithm:
Initially set depth(x,y) as (1,0) and intensity (x,y) to background value.
Find all the pixels (x,y) that lies on the boundaries of the polygon when projected onto the screen.
To calculate pixel coordinates:
1. Calculate the depth z of the polygon at (x,y).
2. If z < depth (x,y) then this polygon lies closer to the observer else others are already recorded for this pixel.
3. Set depth (x,y) to z and intensity(x,y) to the value according to polygon shading.
4. If z > depth (x,y) then this polygon is new and no action is taken.
After all, polygons have been processed the intensity array will contain the solution.
This algorithm contains common features to the hidden surface algorithm.
It requires the representation of all opaque surfaces in scene polygon in the given figure below.
These polygons may be faces of polyhedral recorded in the model of the scene.
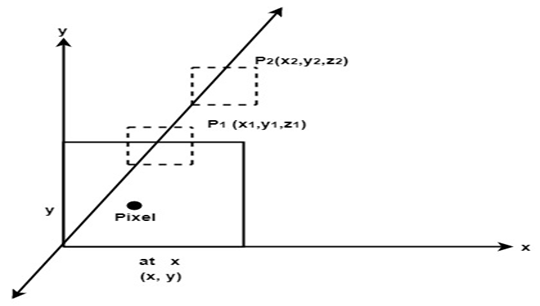
Fig 2: z buffer
Limitations
● Because depth and intensity arrays are so large, the depth buffer algorithm isn't always viable.
● Each array requires 2,50,000 storage places to create an image with a raster of 500x500 pixels.
● Despite the fact that the frame buffer provides memory for the intensity array, the depth array is still somewhat huge.
● The image can be broken into numerous smaller images and the depth buffer algorithm applied to each one individually to reduce the amount of storage required.
● The original 500 x 500 faster, for example, can be broken into 100 rasters, each of 50 x 50 pixels.
● Each little raster takes only a 2500-element array to process, but the execution time increases as each polygon is processed multiple times.
● Screen division does not always increase execution time; instead, it can help reduce the amount of work necessary to generate the image. Coherence between small sections of the screen causes this drop.
Q4) What is back face detection?
A4) It is a simple and straight forward method.
It reduces the size of databases, as only front or visible surfaces are stored.
The area that is facing the camera is only visible in the back face removal algorithm.
The objects on the backside are not visible.
The 50% of polygons are removed in this algorithm when it uses parallel projection.
When the perspective projection is used then more than 50% of polygons are removed.
If the objects are nearer the center of projection then some polygons are removed.
It is applied to individual objects.
It does not consider the interaction between various objects.
Many polygons are captured by the front face as they are closer to the viewer.
Hence for removing such faces back face removal algorithm is used.
When the projection takes place, there are two surfaces one is a visible front surface and the other is not a visible back surface.
Following is the mathematical representation of the back face removal algorithm.
N1 = (V2 - V1) (V3 - V2)
If N1 * P >= 0 visible and N1 * P < 0
Q5) Explain bsp tree methods?
A5) The visibility is calculated via binary space partitioning. To construct the BSP trees, begin with polygons and name all of the edges. Extend each edge so that it splits the plane in half, working with only one edge at a time. As the tree's root, place the initial edge. Depending on whether they're inside or outside, add more edges. Edges that cross the expansion of an already-in-the-tree edge are split into two and added to the tree.
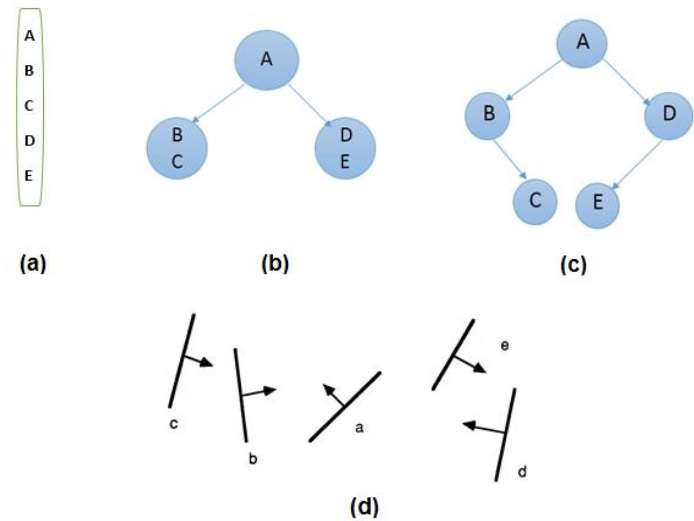
Fig 3: BSP tree
Take A as a root from the diagram above.
● Make a list of all the nodes shown in figure a.
● As illustrated in figure b, place all of the nodes in front of root A on the left side of node A and all of the nodes behind root A on the right side.
● Process all of the front nodes first, then the back nodes.
● The node B will be processed first, as shown in figure c. We've put NIL in front of node B because there's nothing in front of it. However, because node C is behind node B, it will be moved to the right side of node B.
● Carry out the identical steps for node D.
Q6) Define painter's algorithm?
A6) It was classified as a list priority algorithm. A depth-sort algorithm is another name for it. The visibility of an object is ordered using this approach. When objects are reversed in a specific order, a correct image is produced.
Objects are ordered in ascending order from the x coordinate to the z coordinate. The rendering is done in z coordinate order. Near one, more items will conceal it. Pixels from the farthest object will be overwritten by pixels from the farthest object. If the z values of two objects overlap, we can use the Z value to establish the right order, as seen in fig (a).
When z items overlap, as seen in fig. (b), the right order can be maintained by dividing the objects.
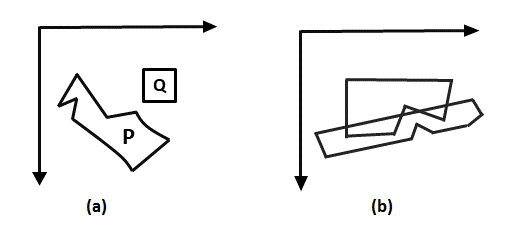
Fig 4: Objects
Sancha Newell created the depth sort method, sometimes known as the painter algorithm. The painter algorithm gets its name from the fact that the frame buffer is painted in decreasing order of distance. The distance is measured in relation to the view plane. First, the polygons at a greater distance are painted.
The color scheme was inspired by a painter or artist. When a painter creates a picture, he begins by painting the background color throughout the entire canvas. Then, farther away items such as mountains and trees are added. Then, either in the background or in the front, objects are added to the picture. We'll take a similar approach. Surfaces will be sorted based on their z values. In the refresh buffer, the z values are saved.
Algorithm
Step1: Start Algorithm
Step2: Sort all polygons by z value keep the largest value of z first.
Step3: Scan converts polygons in this order.
Test is applied
● Does A is behind and non-overlapping B in the dimension of Z as shown in fig (a)
● Does A is behind B in z and no overlapping in x or y as shown in fig (b)
● If A is behind B in Z and totally outside B with respect to view plane as shown in fig (c)
● If A is behind B in Z and B is totally inside A with respect to view plane as shown in fig (d)
Any test with a single overlapping polygon that succeeds allows F to be painted.
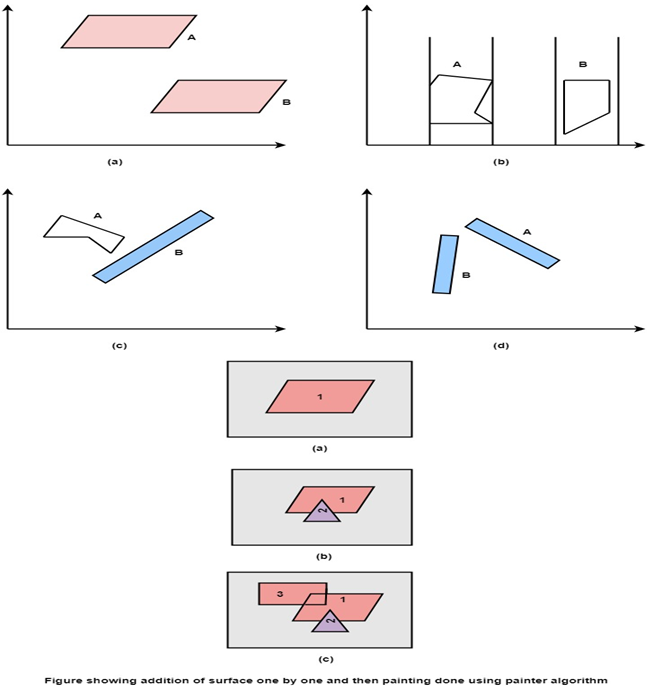
Fig 5: Showing surface
Q7) What is scan line algorithm?
A7) It is an image space algorithm.
This method process one line at a time instead of one pixel at a time.
It follows the area of coherence mechanism.
In the scan line method, the active edge list is recorded as an edge list.
The edge list or edge table is the record of the coordinate of two endpoints.
Active edge list is edged a given scan line intersects during its sweep.
The active edge list should be sorted in increasing order of x. It is dynamic, growing, and shrinking.
This method deals with multiple surfaces. As the line intersects many surfaces.
The intersecting line will display the visible surface in the figure.
Therefore, the depth calculation will be done.
The surface area is rear to view plane is defined.
The value of the entered refresh buffer is shown as visibility of the surface.
The following figure shows edges and active edge lists using the scan line method.
In the following figure, the active edge is displayed as AC1 which contains e1, e2, e5, e6 edges, and AC2 with e5, e6, e1 edges.
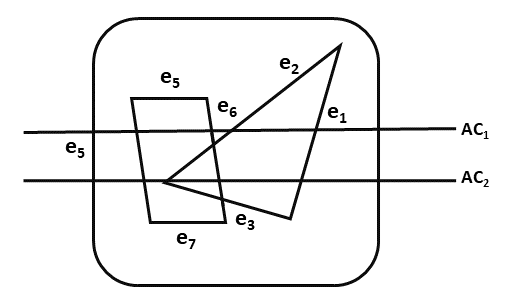
Fig. 6
Q8) Describe hidden line elimination?
A8) In a computer representation, solid things are frequently represented by polyhedra. A face of a polyhedron is a planar polygon with edges that are straight line segments. A polygon mesh is commonly used to approximate curved surfaces. Computer programs for line drawings of opaque objects must be able to determine which edges or portions of edges are obscured by the object or other objects. Hidden-line removal is the term for this issue.
L.G. Roberts found the first known solution to the hidden-line problem in 1963. It does, however, significantly limit the model by requiring that all objects be convex. In a 1965 publication, Bell Labs' Ruth A. Weiss reported her 1964 solution to this problem.
Ivan E. Sutherland published a list of ten unsolved computer graphics issues in 1966. The seventh issue was "hidden-line removal." Devai addressed this problem in 1986 in terms of computational complexity.
In computer-aided design, for example, models can have thousands or millions of edges. As a result, a computational-complexity method is critical, which expresses resource requirements such as time and memory as a function of issue sizes. In interactive systems, time constraints are very significant.
Hidden line removal (HLR) is a method for determining which edges of parts are not obscured by their faces in a given view and for displaying parts in a 2D projection of a model. A CAD uses hidden line removal to display the visual lines. It is assumed that information to define a 2D wireframe model as well as 3D topological information is freely available. For accessing this information from an available part representation, the best algorithm is usually necessary.
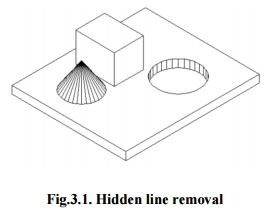
Fig 7: Hidden line removal
3D pieces are easily made and appear frequently in CAD designs for such items. Furthermore, the degrees of freedom are sufficient to illustrate the majority of models while not being excessive in terms of the amount of constraints to be forced. In addition, practically all surface-surface crossings and shadow computations may be performed analytically, resulting in significant time savings over numerical methods.
Priority algorithm
The priority approach is based on grouping all of the polygons in the view by their largest Z-coordinate value. If a face intersects multiple faces, additional visibility tests, in addition to the Z-depth, are necessary to resolve any issues. Wrapper's purposes are included in this stage.
Assumes that objects are represented by lines, and that lines are formed when surfaces intersect. The invisible lines are immediately deleted if only the visible surfaces are generated.
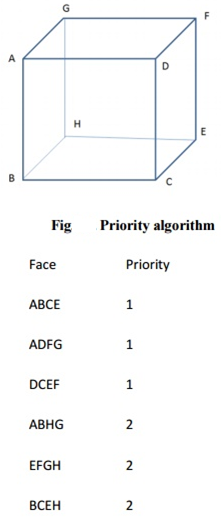
Fig 8: Priority algorithm
ABCD, ADFG, DCEF are given higher priority-1. Hence, all lines in this faces are visible, that is, AB, BC, CD, DA, AD, DF, FG, AG, DC, CE, EF and DF are visible.
AGHB, EFGH, BCEH are given lower priority-2. Hence, all lines in this faces other than priority-1 are invisible, that is BH, EH and GH. These lines must be eliminated.
Q9) Write about wireframe methods?
A9) Visibility tests are applied to surface edges when only the outline of an object is to be displayed. The visible edge sections are shown, whereas the concealed edge sections can be hidden or shown differently than the apparent edges. Hidden edges, for example, could be represented as dashed lines, or depth cueing could be used to reduce the strength of the lines as a linear function of distance from the view plane.
Wireframe-visibility methods are procedures for determining the visibility of object edges. They're also known as hidden-line detection methods or visible-he detection methods. Although special wireframe visibility processes have been created, several of the visible surface approaches outlined in the previous sections can also be utilized to test for edge visibility.
Comparing each line to each surface is a simple way to find visible lines in a scene. The procedure is similar to clipping lines against random window shapes, only we now want to know which sections of the lines are obscured by surfaces. To determine which line portions are not visible, depth values are compared to the surfaces for each line. Coherence methods can be used to find concealed line segments without having to examine each coordinate position.
The line segment between the intersections is entirely covered if both line intersections with the projection of a surface boundary have larger depth than the surface at those sites, as shown in Fig. This is the most common scenario in a scene, however intersecting lines and surfaces are also feasible. When a line has more depth at one boundary junction than the surface at the other, the line must reach the interior of the surface, as shown in Fig. In this scenario, we use the plane equation to calculate the line's crossing point with the surface and only show the visible sections.
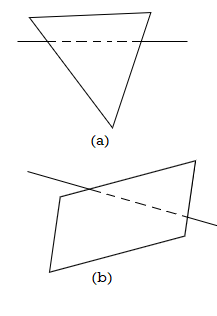
Fig 9
Wireframe visibility testing can benefit from some visible-surface methodologies. We could use a back-face approach to identify all of an object's back surfaces and just show the bounds for the visible surfaces. Surfaces can be painted into the refresh buffer using depth sorting so that surface interiors are in the background and boundaries are in the foreground. Hidden lines are removed by the nearby surfaces while processing the surfaces from back to front. By presenting only the boundaries of visible surfaces, an area-subdivision approach can be adapted to hidden-line removal.
By placing points along the scan line that coincide with the limits of visible surfaces, scan-line approaches can be utilized to display visible lines. In a similar way, any visible-surface method that involves scan conversion can be converted to an edge-visibility detection method.
Q10) What is geometry fractal?
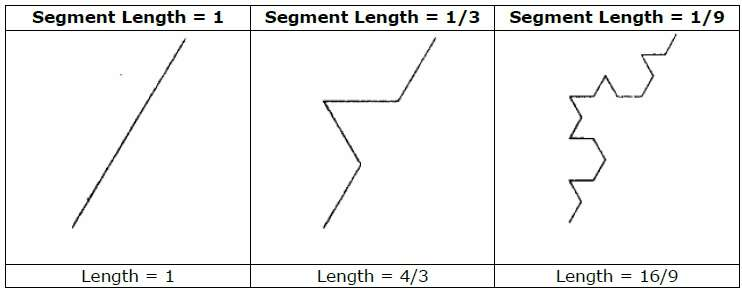
A10) Geometric fractals deal with non-integer or fractal dimensions in nature's shapes. We start with a predefined geometric form called the initiator to geometrically construct a deterministic nonrandom self-similar fractal. Subparts of the initiator are then substituted with a generator pattern.
For example, by repeating the initiator and generator depicted in the above diagram, we can create a good pattern. Each step replaces each straight-line segment in the initiator with four equal-length line segments. The fractal dimension is D = ln 4/ln 3 ≈ 1.2619 because the scaling factor is 1/3.
In addition, as more detail is added to the curve, the length of each line segment in the initiator increases by a factor of 4/3 at each step, so the length of the fractal curve goes to infinity, as seen in the accompanying picture.
In the previous sections, we looked at object representations that used Euclidean-geometry approaches, which meant that object shapes were specified using equations. These techniques work well for characterizing manufactured items with smooth surfaces and predictable forms. Natural objects, such as mountains and clouds, contain uneven or broken features, making Euclidean approaches unsuitable for modeling them. Fractal geometry approaches, which use procedures rather than equations to model objects, can genuinely depict natural objects.
Procedurally defined objects, as one might imagine, differ significantly from objects represented using equations. Fractal geometry representations for objects are widely used to describe and explain the characteristics of natural occurrences in a variety of domains. Fractal methods are used in computer graphics to create displays of natural things as well as visualizations of many mathematical and scientific systems.
A fractal item has two essential properties: infinite detail at every location and a degree of self-similarity between the entity's pieces and overall features. Depending on the fractal representation used, an object's self-similarity features can take on a variety of shapes. A process that specifies a fractal object is described. A process that is repeated to create the detail in the object subparts. Natural things are represented by operations that can theoretically be repeated indefinitely. Natural object graphics are, of course, constructed with a finite number of stages.
Q11) What is rendering a polygon surface?
A11) A collection of surfaces is used to depict an object. There are two types of 3D object representation.
Boundary Representations B−reps - It defines a three-dimensional item as a collection of surfaces that separate the thing's interior from its surroundings.
Space–partitioning representations - It divides the spatial space containing an item into a group of small, non-overlapping, contiguous solids, usually cubes, to define inner attributes.
A set of surface polygons that encircle the item's interior is the most popular boundary representation for a 3D graphics object. This approach is used by many graphics systems. For object description, a set of polygons is saved. Because all surfaces can be described with linear equations, this simplifies and speeds up the surface rendering and display of objects.
Because its wireframe display may be done quickly to give a general sense of surface structure, polygon surfaces are common in design and solid-modeling applications. Then, to illuminate the scene, shading patterns are interpolated across the polygon surface.
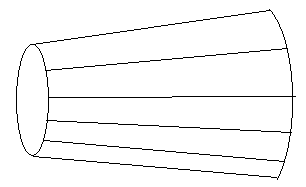
Fig 10: 3D represented by polygons
Q12) What is the shading algorithm?
A12) It is an implementation of the illumination model at the pixel points or polygon surfaces.
It is used to display colors in graphics and also used to compute the intensities.
It has two important ingredients as properties of the surface and properties of the illumination falling on it.
In intensity computation the object illumination is the most significant thing.
The diffuse illumination is the illumination which has the uniformly reflection from all the direction.
The shading models are used to determine the shade of a point on the surface of an object in terms of number of attributes.
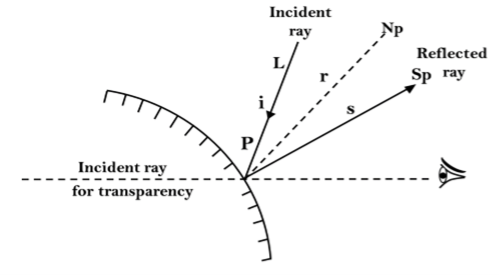
Following figure shows the energy comes out from the point on a surface.
Q13) Explain Gouraud Algorithm?
A13: It is also known as gouraud shading when it renders a polygon surface by linear interpolating intensity value across the surface.
It is an intensity interpolation scheme.
The intensity values for each polygon are coordinates with the value of adjacent polygon along the common edges.
Hence eliminating the intensities discontinuities happens like flat shading.
Following are some calculations that are occurred in gouraud shading.
Determining average unit normal vector at each polygon vertex
Apply an illumination model to each vertex to determine the vertex intensity
Linear interpolate the vertex intensities over the surface of the polygon.
The normal vector obtain by averaging the surface normals of all polygons staring that vertex from each polygon vertex.
Following figure shows the gouraud shading.
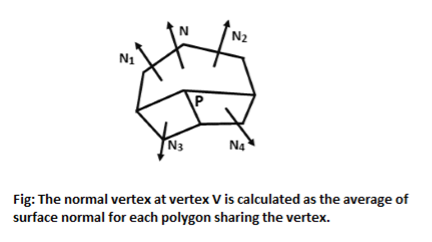
Fig 11: Normal vertex
Q14) What is phong shading?
A14) Phong Shading
It is a more accurate method to render a polygon surface.
The polygon surface that interpolates the normal vertex and then apply the illumination model to each surface point.
This method is also known as the normal vector interpolation shading.
It is used to display more realistic highlights on the surface.
It is also use to reduce the match band effect.
Following are the steps to render a polygon surface using phong shading:
- Determining average unit normal vector at each polygon vertex
- Linear and interpolate the vertex normals over the surface of the polygon.
- Apply an illumination model to each scan line to determine the projected intensities for surface points.
Following figure shows the phone shading between two vertices.
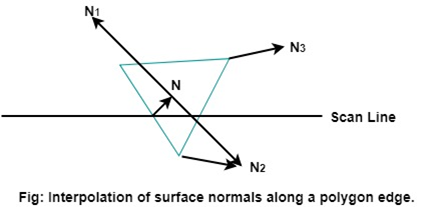
Fig 12: Interpolation of surface normals along a polygon edge
The evaluation of normal between the scam lines are determined by the incremental method along with each scan line.
The illumination model is applied on each of the scan line to determine the surface intensity at that point.
The accurate result is produced by the intensity calculation using approximated normal vector at each point along the scan line instead of using the direct interpolation of intensities. The phone shading requires more calculations than other shading algorithms.
Q15) What is texture mapping?
A15) Texture mapping is a technique for giving a computer-generated image more realism. Like a decal glued to a flat surface, an image (the texture) is added (mapped) to a simpler shape generated in the scene. This cuts down on the amount of computing required to build the scene's forms and textures. For example, instead of computing the contour of the nose and eyes, a sphere may be produced and a face texture applied.
Texture mapping for lighting should become less important as graphics cards become more capable, and bump mapping or greater polygon counts should take over. In actuality, however, there has been a recent trend toward larger and more varied texture images, as well as increasingly sophisticated ways to blend several textures for different elements of the same item. (This is especially true with real-time graphics, where the number of textures that can be displayed at the same time is limited by the amount of graphics RAM available.)
Texture filtering governs how the output pixels on the screen are calculated from the pixels (texture pixels). The quickest option is to use exactly one pixel for each pixel, however there are more advanced techniques available.
Texture mapping is a technique for adding detail and texture to a 3-D object or color to a graphical 3-D model (in the form of a bitmap picture). Texture mapping was initially utilized on computer-generated graffiti by Edwin Catmull in 1974. This approach mapped and merged pixels on a three-dimensional surface. To distinguish it from other forms of mapping techniques, this technique is now known as diffuse mapping.
Height mapping, bump mapping, normal mapping, displacement mapping, reflection mapping, mipmaps, and occlusion mapping are some of the computerized mapping techniques that have made it easier to give computer-generated 3-D visuals a realistic look.
Q16) Write short notes on Bump texture?
A16) Bump mapping is a 3-D graphics simulation approach that alters texture map surface bumps without the usage of additional polygons by using object lighting calculations. Bump mapping is a Phong shading and Phong reflection model extension. Several programs and applications, including gaming, astrophysics, architecture, biology, chemistry, and biology, use bump mapping. Bump mapping and texture mapping are not the same thing.
Bump mapping necessitates a lot of computing power and is usually hardware-based. 3-D graphics card chips provide bump mapping computation support. Bump mapping enhances surface detail by reacting to the direction of light.
There are two forms of bump mapping that are commonly used: Emboss bump mapping is a multi-pass algorithm technique that replicates texture images and extends texture embossing. After that, the images are shifted to the desired bump amount, the underlying texture is darkened, and the superfluous texture is clipped. Finally, the duplicate texture images are stitched together to form a single image. Two-pass emboss bump mapping is another name for emboss bump mapping. EMBM (environment-mapped bump mapping): A surface detailing technique that uses texture, bump, and environment maps. After the shifted environment map is applied to the texture map, the bump and environment maps mix.
Q17) What do you mean by environment map?
A17) Before we discuss environment mapping, let's define what we mean by "environment." The examples so far have mostly had a black background, as though the items were all floating around in space. This is rarely the case, and we prefer our scene to be set in either a closed (e.g., a room) or an open (e.g., a field) (e.g. Outside, with a visible sky). It turns out that creating the illusion of an open environment is more efficient than simulating the Earth, stars, the Sun or the Moon, mountains, or whatever we wish to see in the distance.
Consider a game in which there is a mountain in the distance. A mountain that the player would never be able to reach due to its great distance. The GPU would be used to model the actual geometry of that mountain and then render it at a very narrow range of angles all the time. It is far more efficient and effective to just display a prerendered image of that mountain. The important factors to remember here are that the player should never be able to reach the background and that there should always be enough space between the player and the background. If these criteria are met, we can generate the background as it appears from the scene's center.
The background can then be used as a texture in either a cube or a sphere (or hemisphere). This is commonly referred to as a skybox or skydome. Because the objects are so far away, rotating the camera around makes only a minor difference in the angle from which we view them. As a result, a fixed skybox, where nothing changes, approximates that impression.
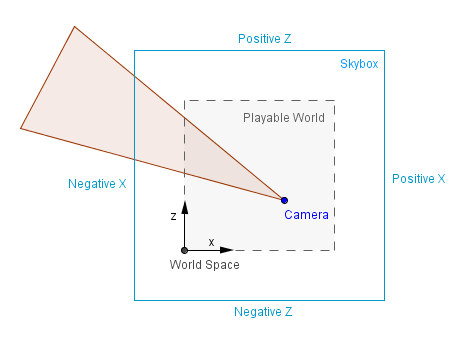
Definitions:
● Reflection - is an operation in which an incoming vector is reflected by the surface normal, resulting in a reflected (outgoing) vector.
● Skybox — a big textured box that can be found all over the earth for displaying objects that are too far away to be seen.
● Skydome — a giant textured sphere or hemisphere that circles the globe to depict very far away items that can't be seen.
● Cube mapping - is the concept of mapping the entire environment to the six faces of a cube.
● Sphere mapping - The idea of mapping everything of one's surroundings to a sphere is known as sphere mapping.
Cube map
The cube mapping approach is arguably most clearly demonstrated in the skybox image above. The images that are mapped to the faces of the skybox cube can be built in such a way that a camera in the skybox's center takes six photographs with a 90° field of view. Of course, this results in distorted visuals, but the actual perspective projection will fix this and the spectator will see the distant things accurately.
Although the actual environment may or may not have been present, that is already an environment mapping. The visuals in the skybox could have been hand-drawn, procedurally produced, captured with a real camera in the real world, or rendered in an environment that will not be recreated again.
Creating reflections is another thing we can accomplish with environment mapping. We previously noticed that diffuse surfaces almost usually absorbed all of the incoming light (and emitting some of it in a random angle). There were also specularly reflecting surfaces that reflected the light source's specular highlight. This is an approximation because light does not come solely from the light source, as we all know.
Light bounces about in our environment and reaches different sections of our scene at different angles depending on where it bounces. There are global illumination approaches that we shall examine later on in order to realistically depict that. We're currently working on a single reflecting object that can detect light coming in from the environment.
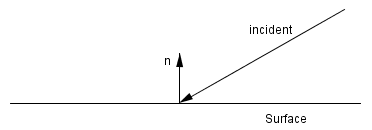
Assume it's a reflective sphere, and our scene consists solely of the sphere, the skybox, and the camera. We can determine the direction of travel from the camera to a sphere fragment. At that piece, we also know the surface normal (interpolated normal in the case of the sphere). With that information, we can calculate the reflected vector as follows:
The incidence vector and the surface normal are both known.
Sphere map
Before there was cube mapping, there was sphere mapping. It involved projecting an image of the environment onto a reflective sphere that was infinitely far away from the camera. This means that nearly the entire environment will be mapped to a spherical image, from which samples will be taken. There are various advantages and disadvantages to this.
Advantages
● Instead of a cube, the entire environment is mapped to one image, from which we can sample.
● The resolution is good in the center, where the reflection angle is approximately 0°.
Disadvantages
● Behind the sphere, there is a blind spot.
● Because we don't have enough pixels to keep the data at the edges, where the reflection angle is approaching 90°, aliasing may occur.
● The sphere map itself is difficult to create: for a true snapshot, a 360° lens is required, and the camera must be included in the image; for programmatic creation, a reflective sphere is required (with cube mapping for example).
● You'd have to re-generate a dynamic spherical map, just like you did with the cube map.
● It is reliant on the camera position because to the varied resolution. To avoid aliasing, you'll need to refresh the camera position if it changes.
Q18) Introduce ray tracing?
A18) Ray tracing is a geometrical optics approach for modeling light's journey by following rays of light as they interact with optical surfaces. It's used to make camera lenses, microscopes, telescopes, and binoculars, among other things. The word is also used to refer to a certain rendering algorithmic approach in 3D computer graphics, in which mathematically-modelled visualisations of programmed settings are created using a process that follows rays outward from the eyepoint rather than originating at the light sources.
It generates results similar to ray casting and scan line rendering, but it also allows for more complex optical effects, such as exact reflection and refraction simulations, and it's still efficient enough to be useful when such high quality output is required.
Pros
The popularity of ray tracing arises from the fact that it is based on a more realistic simulation of lighting than other rendering technologies (such as scanline rendering or ray casting). Reflections and shadows are natural results of the ray tracing process, which are difficult to imitate with other algorithms. Ray tracing is a popular first step into graphics programming since it is relatively easy to implement and produces spectacular visual effects.
Cons
Ray tracing has a significant performance disadvantage. Scanline and other techniques leverage data coherence to exchange computations between pixels, whereas ray tracing usually starts over, handling each eye ray separately. This separation, on the other hand, has other benefits, such as the capacity to shoot more rays as needed for anti-aliasing and image quality improvement. It's a lovely thing.
Ray casting algorithm
The objective behind ray casting, which is the forerunner to recursive ray tracing, is to trace rays from the eye, one per pixel, and discover the closest item blocking that ray's path. Consider an image to be a screen door, with each square representing a pixel. This is the object that the eye sees as it passes through that pixel. This method can determine the shading of this object based on the material qualities and the effect of the lights in the scene. If a surface confronts a light, it is assumed that the light will reach that surface and will not be blocked or under shadow. Traditional 3D computer graphics shading models are used to compute the surface shading.
Ray casting had a significant advantage over prior scanline algorithms in that it could readily deal with non-planar surfaces and solids like cones and spheres. Ray casting can be used to draw any mathematical surface that can be crossed by a ray. Solid modeling techniques can be used to construct complex things that are easily rendered.
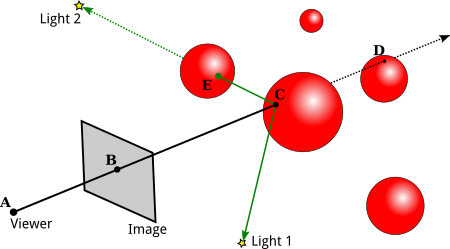
Fig 13: Ray casting
Recursive ray tracing algorithm
Earlier algorithms followed rays from the eye into the scene until they hit an item, but without recursively tracing more rays, they could detect the ray color. The technique is continued with recursive ray tracing. Reflection, refraction, and shadow may cause additional rays to be cast when a ray strikes a surface.
● In the mirror-reflection direction, a reflection ray is traced. What will be seen in the mirror is the closest item it intersects.
● A refraction ray passing through a transparent substance behaves similarly, with the exception that the refractive ray may be entering or departing the material.
● Turner Whitted added refraction effects to the mathematical logic for rays passing through a transparent substance.
● Each light is approached by a shadow ray. If there is an opaque item between the surface and the light, the surface will be under shadow and will not be illuminated.
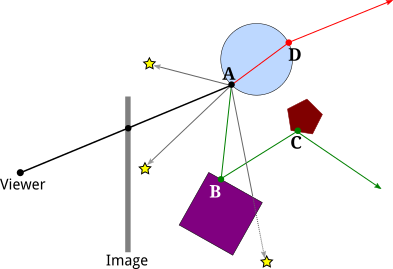
Fig 14: Recursively ray tracing
Q19) What is image synthesis?
A19) The process of making new images from some type of image description is known as image synthesis. The following are examples of images that are commonly synthesized:
● Simple two-dimensional geometric shapes are used to create test patterns and scenes.
● Image noise is a term used to describe images that contain random pixel values, which are commonly generated using parametrized distributions.
● Graphics on the computer, Geometric shape descriptions are used to create scenes or visuals. Models are frequently three-dimensional, although they can also be two-dimensional.
The application of synthetic images to known images is frequently used to check the validity of operators. They're particularly popular for teaching since the operator output is generally 'clean,' whereas noise and unpredictable pixel distributions in real images make it difficult to illustrate unambiguous conclusions. Binary, grayscale, or color images could be used.
The core concept of 3D Computer Graphics is image synthesis, or "rendering." It combines a number of artificial imaging techniques to create digital photos from virtual 3D scene models. Computer science, physics, applied mathematics, signal processing, and perception are all used in rendering. It is widely utilized in a variety of industries, including computer-aided design (CAD), visual special effects (VFX), computer animation, video games, simulation, and architecture.
Q20) What are sampling techniques?
A20) When a continuous function has to be represented by a small number of sample values, sampling issues arise. Images with moire effects or computer generated lines with staircase artifacts are well-known examples. However, sampling issues do not occur solely when pixelated images are displayed:
A procedure of sampling and reconstruction is used to represent a surface using the vertices of a triangle-mesh or control points in the case of a freeform surface, which results in comparable challenges. Many efforts have been made in recent years to solve challenges that are directly or indirectly linked to discrete sampling.
Antialiasing techniques, mesh simplification, multiresolution approaches, and even lighting scene strategies must all be mentioned in this context.
Why do we use sampling?
● When sampling pixels, to avoid aliasing.
● To illustrate depth of field, cameras with a finite-area lens are utilized. As a result, the lens must be sampled.
● To more precisely represent area lights and soft shadows, we must sample the light surfaces.
● The sampling of BRDFs and BTDFs is required for global illumination and glossy reflection.
Sampling and reconstruction
Functions are frequently discretized in practice by sampling them at specific locations within their domain. It can be shown that this sampling corresponds to a representation of the original function by basis functions if the function meets specific criteria. The so-called sampling theorems specify these criteria. If they are not met, unique issues arise, which have been widely researched in the context of signal processing. The problem of sampling is particularly visible in the context of image sampling in computer graphics. Pictures are saved and shown as raster images, which means that both synthetic and natural images must be split into lines and pixels.
The opposing process, reconstruction, is the creation of a continuous function from discrete values. This reconstruction is done for photographs, for example, by displaying the sample values on a screen. In essence, reconstruction can be thought of as a filtering phase.
The basic technique of sampling and reconstruction of continuous functions is depicted in Fig. It is suggested that the sample be done on a regular grid, as this simplifies not just the sampling but also the reconstruction. Regular sampling, on the other hand, is not required.
As can be seen, sampling is preceded by a filtering step that ensures the aforementioned constraints, after which the sample values can be multiplied with the correct basis functions to accomplish reconstruction.
The filter that comes before sampling and the reconstruction filter are usually linear, shift invariant filters. However, this isn't required; in some cases, nonlinear filters are required to reconstruct functions from sample values.
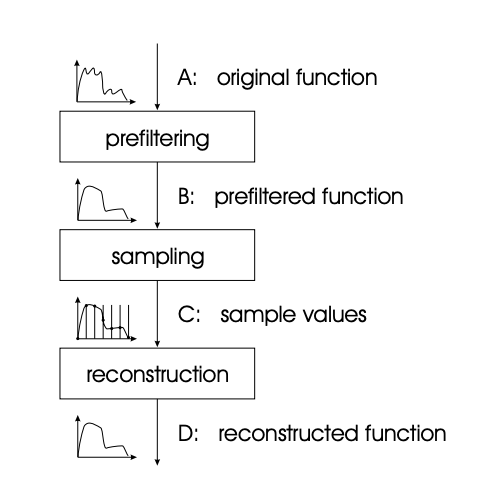
Fig 15: Standard process of sampling and reconstruction of continuous image signals