Unit – 2
Introduction to Spreadsheet Software
Q1) Define Spreadsheet Software.
A1) A spreadsheet is a piece of software that allows you to quickly perform quantitative analyses on statistical data, such as totalling long columns of data or calculating percentages and averages. And if some of the raw data you enter into the spreadsheet change – for example, if you have final statistics to replace provisional ones – the spreadsheet will adjust any of the equations you've done based on the new numbers.
You may also use a spreadsheet to create data visualisations, such as maps, to show the statistical data you've gathered on a website.
Q2) Present Layout of Spreadsheet.
A2)

Q3) Note on Creation of Spreadsheet-range,formulas and function.
A3) The fundamentals to making your first Microsoft Excel spreadsheet A spreadsheet is a document with columns and rows of cells for sorting and manipulating data. Each cell is intended to store a single piece of information, such as numbers, letters, or formulas that correspond to other cells. After that, the data can be organised, formatted, graphed, and referred to in other records.
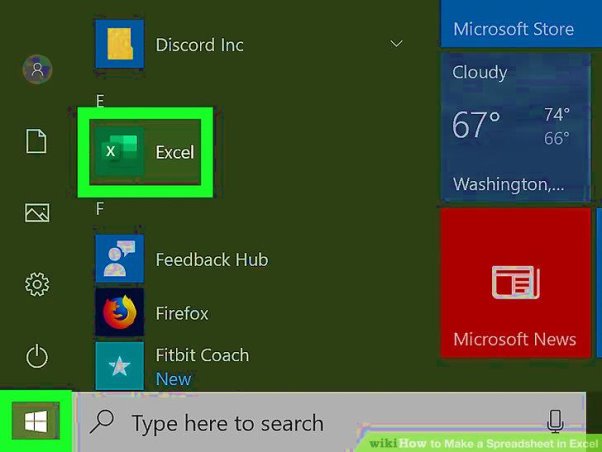
Excel can now be available. It's in the Start menu (Windows) or the Applications folder (Mac) (macOS). You'll be taken to a screen where you can make or pick a folder. If you don't have a premium version of Microsoft Office, you can make a simple spreadsheet using the free online version at https://www.office.com. Everything you have to do now is sign in with your Microsoft account and choose Excel in the row of icons. 
To make a new workbook, click Blank workbook. The name of the folder that includes your spreadsheet is called a workbook (s). This produces Sheet1, a blank spreadsheet that you can access through the tab at the bottom of the sheet. When creating more complicated spreadsheets, press + next to the first sheet to add another line.To swap between spreadsheets, use the bottom tabs.
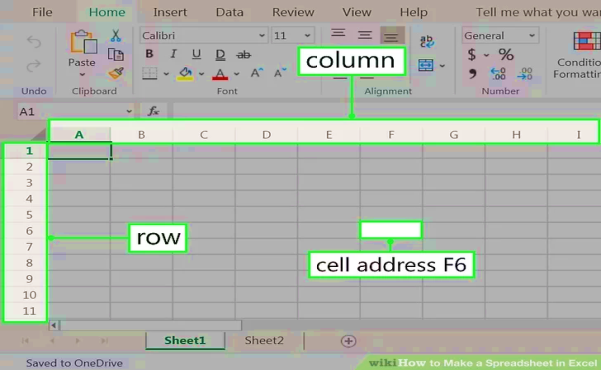
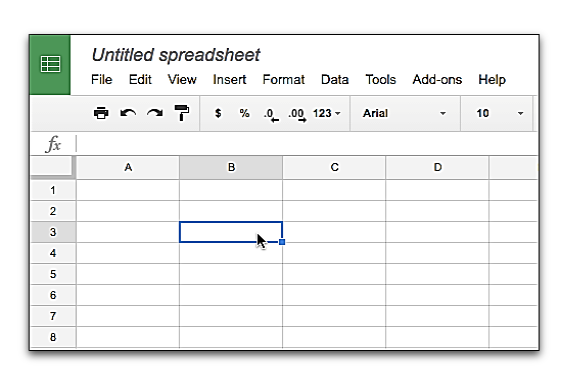
Familiarize yourself with the style of the spreadsheet. The spreadsheet comprises hundreds of rectangular cells divided into vertical columns and horizontal rows, which is the first thing you'll remember. There are a few things to keep in mind about this design:
Along the side of the spreadsheet, all rows are labelled with numbers, while the columns are labelled with letters.
Each cell has a unique address that begins with the column letter and ends with the row number. The address of the cell in the first column (A), first row (1), for example, is A1. The cell in column B row 3 has the address B3.

Fill in the blanks. Simply click any cell once and begin typing right away. Click the Tab key to move to the next cell in the list, or the Enter key to move to the next cell in the column, when you're done with that cell.
See how the content of the cell shows in the bar that runs across the top of the spreadsheet when you write. This bar is known as the Formula Bar, and it comes in handy when entering long strings of data or formulas.
Double-click a cell that already has data to pull back the cursor and edit it. You may also press the cell once and change the formula in the formula bar.
To delete data from a single cell, first click it and then press Del. This leaves the cell vacant without affecting the data in adjacent rows or columns. To delete several cell values at once, hold down Ctrl (PC) or Cmd (Mac) while clicking each cell, then press Del.
Right-click the letter above the column after which you'd like the new one to appear, and then select Insert from the context menu.
To insert a new blank row between current rows, right-click the row number for the row after the desired position and choose Insert from the menu.

Examine the features that are available for specialised uses. Excel's ability to look up data and make equations based on mathematical formulas is one of its most valuable functions. Each formula you write includes an Excel function, which is the "action" you're carrying out. Formulas often begin with an equal (=) symbol, followed by the function name (for example, =SUM, =LOOKUP, =SIN). Following that, the parameter.
At the top of the page, choose the Formulas tab. In the panel called "Function Library," you'll find some icons in the toolbar at the top of the application. You can quickly search the library using certain icons until you understand how the various functions operate.
The Insert Function button, which also shows a fx, should be clicked. The first icon on the bar should be that. This brings up the Insert Function window.
From the "Or pick a category" menu, choose a category. "Most Recently Used" is the default type. Select Math & Trig, for example, to see the math functions.
In the "Select a function" panel, click any function to see its syntax and a rundown of what it does. Click the Help button for more information on a function.
When you're finished surfing, click Cancel.
See How to Type Formulas in Microsoft Excel for more information on entering formulas.

When you're done editing, save your file. To save the file, go to the top-left corner of the screen and pick File > Save As. Depending on the Excel edition, you will be able to save the file to your device or to OneDrive.
Check out the "Creating a Home Inventory from Scratch" approach and see this stuff in action now that you've mastered the fundamentals.
Q4) Note on Presentation Graphics.
A4) Presentation software (also known as "presentation graphics") is a type of software that allows you to generate word and image sequences that say a storey or endorse a speech or public presentation. Company presentation software and more general interactive authoring applications are the two types of presentation software, though some products combine the two.
The simplicity and speed at which business presentation software can be learned and used is emphasised. You may use multimedia authoring tools to create a more complex display of audio and video sequences. You may typically provide photographs, as well as audio and video created from other instruments, in business presentation apps.
Any of the more common presentation tools, such as Microsoft Powerpoint and Lotus Freelance Graphics, can be purchased separately or as part of office suites or bundles. Adobe Persuasion, Astound, Asymetrix Compel, Corel Presentations, and Harvard Graphics are all common goods.
Your Web browser, as well as applications for designing Web sites, such as Microsoft's FrontPage and Adobe's PageMill, have recently arrived as a modern presentation app. This is a common technique, particularly where a presentation will mix HTML pages on the hard disc with links to outside sites, due to the ubiquity of these resources and the browser as a playback system (if you have a live Internet connection).
a) Make a slide show.
b) To begin, open PowerPoint.
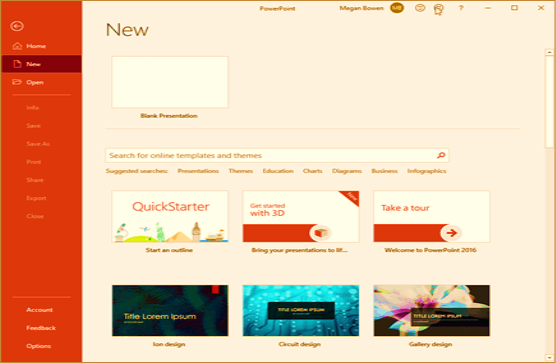
c) Choose one of the following:
d) To start from the beginning, choose Blank Presentation.
e) Choose a prototype from the list.
f) To learn how to use PowerPoint, go to Take a Tour and then Create.
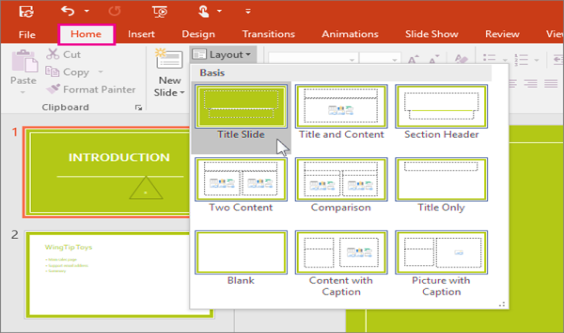
g) Insert a slide
h) Choose which slide you want the latest slide to be based on.
i) Choose Home > New Slide from the drop-down menu.
j) From the drop-down menu, choose Layout and the style you want.
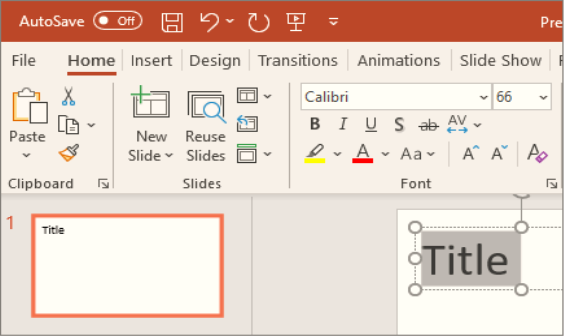
k) Text may be added and formatted.
l) Put the cursor where you like it and start typing.
m) Pick the document, then go to the Home tab and choose one of the following options: Bold, Italic, Underline, etc. Font, Font style, Bold, Italic, Underline, etc.
n) Choose the text and then select Bullets or Numbering to create bulleted or numbered lists.
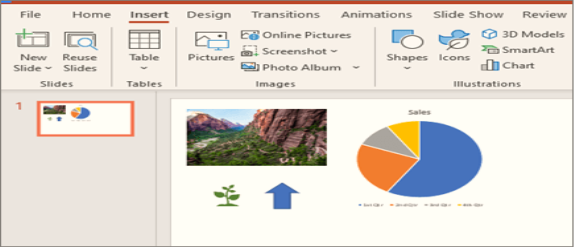
o) Include an image, a form, or a graph.
p) Insert is the option to use.
q) To provide a photograph, follow these steps:
r) Choose a photograph.
s) Click Insert after you've found the image you want.
t) To add a shape, artwork, or map, follow these steps:
u) Shapes, Icons, SmartArt, and Charts are all options.
v) Choose the one that you like.
Q5) Note on Spreadsheet Software and show its layout.
A5) A spreadsheet is a piece of software that allows you to quickly perform quantitative analyses on statistical data, such as totalling long columns of data or calculating percentages and averages. And if some of the raw data you enter into the spreadsheet change – for example, if you have final statistics to replace provisional ones – the spreadsheet will adjust any of the equations you've done based on the new numbers.
You may also use a spreadsheet to create data visualisations, such as maps, to show the statistical data you've gathered on a website.
Spreadsheet Layout:
Q6) Various steps on Graphic Presentation on PC.
A6) Various steps on Graphic Presentation on PC are-
a) Make a slide show.
b) To begin, open PowerPoint.
c) Choose one of the following:
d) To start from the beginning, choose Blank Presentation.
e) Choose a prototype from the list.
f) To learn how to use PowerPoint, go to Take a Tour and then Create.
g) Insert a slide
h) Choose which slide you want the latest slide to be based on.
i) Choose Home > New Slide from the drop-down menu.
j) From the drop-down menu, choose Layout and the style you want.
k) Text may be added and formatted.
l) Put the cursor where you like it and start typing.
m) Pick the document, then go to the Home tab and choose one of the following options: Bold, Italic, Underline, etc. Font, Font style, Bold, Italic, Underline, etc.
n) Choose the text and then select Bullets or Numbering to create bulleted or numbers.
o) Include an image, a form, or a graph.
p) Insert is the option to use.
q) To provide a photograph, follow these steps:
r) Choose a photograph.
s) Click Insert after you've found the image you want.
t) To add a shape, artwork, or map, follow these steps:
u) Shapes, Icons, SmartArt, and Charts are all options.
v) Choose the one that you like- numbered lists.


