Unit - 4
Properties of Pure Substance
Q1) Explain Quality of steam (Dryness fraction)?
A1)
Dryness fraction in simple words denotes the mass of dry steam in given steam. Or how much steam is dry or in other words how much water vapour is present in steam. It is denoted by ‘x’.
X = M / M +m
Where M=mass of the dry steam
m=mass of water vapour
The use of dryness fraction allows us to know both the mass of dry steam and mass of water vapour.
Now, see
If x = 0.9 that means dry steam is 0.9 kg and water vapour is 0.1 kg in 1 kg of given steam.
Obviously for dry steam, x = 1
Quality is represented in percentage but meaning is same as ‘x’.
If quality of steam is 80%, then it has 80% of dry steam and 20 % water vapour by mass.
Q2) Explain Specific volume?
A2)
Gases (steam is a gas) occupy less space under higher pressure than under lower pressure. This means 1 kilogram of steam occupies different volumes, depending upon its pressure. The term specific volume refers to the volume that one kg of steam occupies at a given pressure and temperature.
Unit is m3 / kg denoted by v
Q3 Explain Enthalpy?
A3)
The total heat content of a substance is called enthalpy. Actually it has much broad definition in thermodynamics but for 1st year BME students this definition works just fine. So, total heat content by steam is termed as its enthalpy. It is denoted by ‘H’. SI unit is KJ ‘h‘ is generally used term which represents specific enthalpy, unit for which is KJ/Kg. In steam tables you will see enthalpy written as hi, hg, hig hi is the enthalpy of liquid that is water at boiling point that’s why subscript ‘l’ is used, point ‘D’ in h-T diagram. Similarly hg is enthalpy of dry saturated steam, point ‘E’ in h-T diagram and hig is the latent heat, Process D to E in h-T diagram.
Q4 Write non-flow process?
A4)
Considering a piston cylinder arrangement and process is quasistatic for a instant piston travel a distance of 'x' with no change in pressure(quasistatic process)
Hence the work done for the instant is
W=F*D F=force and D=distance travelled by piston
W= (P*A)*D p=pressure and A=areas of piston
W=P*A*x x=distance travelled by piston
A*x = volume swept by piston=dV
we can write this work as
dW=PdV where P is pressure inside cylinder and dV is volume swept piston
Q3) Explain flow process?
A5)
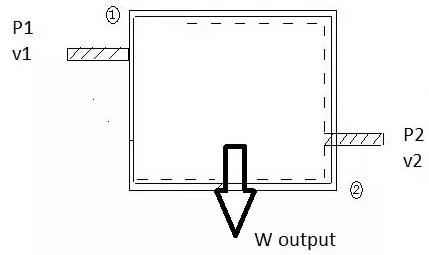
first assumption is fluid is incompressible so the volume flow rate is constant
at inlet pressure is P1 and volume flow rate is v1
at exit pressure is P2 and volume flow rate is v2

Fig 1
Work at inlet is force *displacement of fluid per unit time
W1=F*D
W1=P1*A1*x1 A1 is inlet area and x1 is fluid velocity
W1=P1*v1 A1*x1 is volume swept of liquid per unit time
similarly at exit
W2=P2*v2
W= work done in flow process
W=W1-W2
W=P1*v1 - P2*v2
volume flow rates are same (incompressible fluid)
v=v1=v2
W=(P1-P2)v
W=-(P2-P1)v
dW=-vdP
Q4) Differences between Pure Substances and Mixtures
A6)
The differences between pure substances and mixture are given below.
Pure Substances | Mixtures |
It cannot be broken down or separated into new products. | It can be separated using different separation methods. |
Constant physical and chemical properties. | Mixtures have varying physical and chemical properties. |
Pure substances are made up of a single element. | A mixture is a combination of two substances or elements. |
Q5) Explain Phases of a Pure Substance?
A7)
A pure substance may exist in different phases. There are three principal phases solid, liquid, and gas.
A phase: is defined as having a distinct molecular arrangement that is homogenous throughout and separated from others (if any) by easily identifiable boundary surfaces. A substance may have several phases within a principal phase, each with a different molecular structure. For example, carbon may exist as graphite or diamond in the solid phase, and ice may exist in seven different phases at high pressure.
Molecular bonds are the strongest in solids and the weakest in gases.
Solid: the molecules are arranged in a three‐dimensional pattern (lattice) throughout the solid. The molecules cannot move relative to each other; however, they continually oscillate about their equilibrium position.
Liquid: the molecular spacing in liquid phase is not much different from that of the solid phase (generally slightly higher), except the molecules are no longer at fixed positions relative to each other.
Gas: the molecules are far apart from each other, and a molecular order does not exist. Gas molecules move randomly, and continually collide with each other and the walls of the container they are in.
Molecules in the gas phase are at a considerably higher energy level than they are in liquids or solid phases.
Q6) Describe Property Tables?
A8)
In addition to the temperature, pressure, and specific volume data, tables contain data for the specific internal energy u, the specific enthalpy h, and the specific entropy s. In thermodynamics analysis, we will encounter the combination of properties U + PV frequently. For simplicity this combination is defined as a new property called enthalpy.
H =U + PV (kJ)
The enthalpy per unit mass is
h = u + PV (kJ/kg)
Q7) Write Enthalpy–Entropy (H-S) Diagram For water And Steam or Mollier Chart
A9)
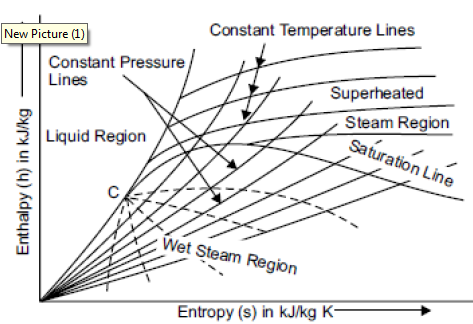
Mollier chart is a graphical representation of the steam tables, in which the enthalpy (h) Is plotted along the ordinate and entropy (s) along abscissa. First of all, enthalpy and entropy of water and dry saturated steam, for any particular pressure, are obtained from the steam tables. These values of enthalpies and entropies are plotted and then liquid line and dry saturated line is obtained. Both these line meet at C, i.e., the critical point as shown in figure. The critical point corresponds to the enthalpy of liquid and dry saturated steam at 221.2 bar. The enthalpy-entropy chart like temperature entropy chart is also very useful in solving the problems in adiabatic or isentropic expansion and compression of steam. In actual diagram, abscissa of the diagram represents the entropy of 1 kg of water and steam, i.e., specific entropy above the freezing point of water and the vertical ordinate shows the values of specific enthalpy i.e., total heat, as shown in figure. The diagram is divided into two parts by a line termed as saturation line. Upper region of the saturation line is called superheated region where temperature of steam increases at given pressure and lower region of saturation line is called wet region where temperature of steam remains constant at a given pressure.
The Mollier diagram has the following lines
1. Dryness fraction lines
2. Constant volume (i.e., specific volume) line
3. Constant pressure lines
4. Isothermal lines
5. Isentropic lines and
6. Throttling line

Fig 2
Q8) Describe Constant Volume Line?
A10)
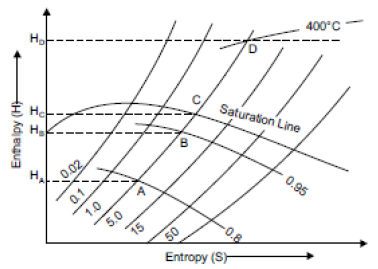
The constant volume lines are drawn in both the wet region and superheated steam region. These lines are straight in the wet steam region, but curved upwards above the saturation curve, i.e., superheated region as shown in figure. By parts AB and CD of line of constant volume 1.0.

Fig 3