UNIT 1
DIGITAL IMAGE FUNDAMENTALS
Q1) Define Image types of image, digital representation, overlapping images?
A1)
An image is defined as a two-dimensional function, F(x, y), where x and y are spatial coordinates, and the amplitude of F at any pair of coordinates (x, y) is called the intensity of that image at that point. When x, y, and amplitude values of F are finite, we call it a digital image. In other words, an image can be defined by a two-dimensional array specifically arranged in rows and columns. Digital Image is composed of a finite number of elements, each of which elements has a particular value at a particular location. These elements are referred to as picture elements, image elements, and pixels. A Pixel is most widely used to denote the elements of a Digital Image.
Types of an image
- BINARY IMAGE– The binary image as its name suggests, contains only two-pixel elements i.e 0 & 1, where 0 refers to black and 1 refers to white. This image is also known as Monochrome.
- BLACK AND WHITE IMAGE– The image which consists of the only black and white color is called BLACK AND WHITE IMAGE.
- 8-bit COLOR FORMAT– It is the most famous image format. It has 256 different shades of colors in it and is commonly known as Grayscale Image. In this format, 0 stands for Black, and 255 stands for white, and 127 stands for gray.
- 16-bit COLOR FORMAT– It is a color image format. It has 65, 536 different colors in it. It is also known as High Color Format. In this format, the distribution of color is not as same as the Grayscale image.
A 16-bit format is divided into three further formats which are Red, Green, and Blue. That famous RGB format.
Image as a Matrix
As we know, images are represented in rows and columns we have the following syntax in which images are represented: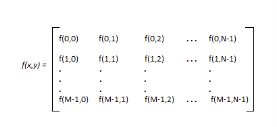
The right side of this equation is a digital image by definition. Every element of this matrix is called an image element, picture element, or pixel.
DIGITAL IMAGE REPRESENTATION IN MATLAB:

In MATLAB the start index is from 1 instead of 0. Therefore, f(1, 1) = f(0, 0).
henceforth the two representations of the image are identical, except for the shift in origin. In MATLAB, matrices are stored in a variable i.e X, x, input_image , and so on. The variables must be a letter as same as other programming languages.
PHASES OF IMAGE PROCESSING:
1.ACQUISITION– It could be as simple as being given an image that is in digital form. The main work involves:
a) Scaling
b) Color conversion(RGB to Gray or vice-versa)
2.IMAGE ENHANCEMENT– It is amongst the simplest and most appealing in areas of Image Processing it is also used to extract some hidden details from an image and is subjective.
3.IMAGE RESTORATION– It also deals with appealing of an image but it is objective(Restoration is based on a mathematical or probabilistic model or image degradation).
4.COLOR IMAGE PROCESSING– It deals with pseudocolor and full-color image processing color models apply to digital image processing.
5.WAVELETS AND MULTI-RESOLUTION PROCESSING– It is the foundation of representing images in various degrees.
6.IMAGE COMPRESSION-It involves developing some functions to perform this operation. It mainly deals with image size or resolution.
7.MORPHOLOGICAL PROCESSING-It deals with tools for extracting image components that are useful in the representation & description of shape.
8.SEGMENTATION PROCEDURE-It includes partitioning an image into its constituent parts or objects. Autonomous segmentation is the most difficult task in Image Processing.
9.REPRESENTATION & DESCRIPTION-It follows the output of the segmentation stage, choosing a representation is only the part of the solution for transforming raw data into processed data.
10.OBJECT DETECTION AND RECOGNITION-It is a process that assigns a label to an object based on its descriptor.
OVERLAPPING FIELDS WITH IMAGE PROCESSING
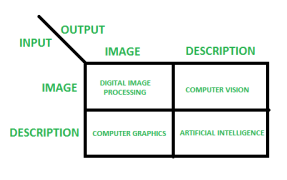
According to block 1, if the input is an image and we get out the image as an output, then it is termed as Digital Image Processing.
According to block 2, if the input is an image and we get some kind of information or description as an output, then it is termed as Computer Vision.
According to block 3, if the input is some description or code and we get the image as an output, then it is termed as Computer Graphics.
According to block 4, if the input is a description or some keywords or some code and we get a description or some keywords as an output, then it is termed Artificial Intelligence
Q2) Define Image Sampling?
A2)
Sampling has already been introduced in our tutorial of introduction to signals and systems. But we are going to discuss here more.
Here what we have discussed of the sampling.
The term sampling refers to take samples
We digitize the x-axis in sampling
It is done on the independent variable
In case of equation y = sin(x), it is done on x variable
It is further divided into two parts, upsampling and downsampling
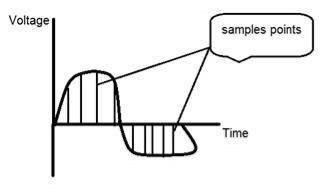
If you will look at the above figure, you will see that there are some random variations in the signal. These variations are due to noise. In sampling, we reduce this noise by taking samples. The more samples we take, the quality of the image would be better, the noise would be more removed, and the same happens vice versa.
However, if you take sampling on the x-axis, the signal is not converted to digital format, unless you take a sampling of the y-axis too which is known as quantization. More samples eventually mean you are collecting more data, and in the case of an image, it means more pixels.
Q3) Define Quantization?
A3)
Quantization is the opposite of sampling. It is done on the y-axis. When you are quantizing an image, you are dividing a signal into quanta(partitions).
On the x-axis of the signal, are the coordinate values, and on the y axis, we have amplitudes. So digitizing the amplitudes is known as Quantization.
Here how it is done
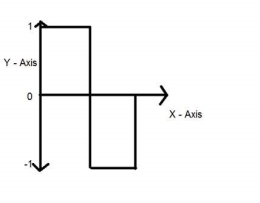
You can see in this image, that the signal has been quantified into three different levels. That means that when we sample an image, we gather a lot of values, and in quantization, we set levels to these values. This can be more clear in the image below.
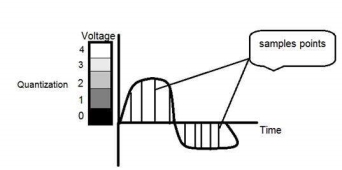
In the figure shown in sampling, although the samples have been taken, they were still spanning vertically to a continuous range of gray level values. In the figure shown above, these vertically ranging values have been quantized into 5 different levels or partitions. Ranging from 0 black to 4 white. This level could vary according to the type of image you want.
The relation of quantization with gray levels has been further discussed below.
Relation of Quantization with gray level resolution:
The quantized figure shown above has 5 different levels of gray. It means that the image formed from this signal would only have 5 different colors. It would be a black and white image more or less with some colors of gray. Now if you were to make the quality of the image better, there is one thing you can do here. Which is, to increase the levels, or gray level resolution up. If you increase this level to 256, it means you have a grayscale image. Which is far better than simple black and white image.
Now 256, or 5, or whatever level you choose is called gray level. Remember the formula that we discussed in the previous tutorial of gray level resolution which is,

We have discussed that gray levels can be defined in two ways. Which were these two.
- Gray level = a number of bits per pixel (BPP). (k in the equation)
- Gray level = a number of levels per pixel.
In this case, we have a gray level is equal to 256. If we have to calculate the number of bits, we would simply put the values in the equation. In the case of 256levels, we have 256 different shades of gray and 8 bits per pixel, hence the image would be grayscale.
Q4) What is Dynamic Range?
A4)
Dynamic range in photography describes the ratio between the maximum and minimum measurable light intensities (white and black, respectively). In the real world, one never encounters true white or black — only varying degrees of light source intensity and subject reflectivity. Therefore the concept of dynamic range becomes more complicated and depends on whether you are describing a capture device (such as a camera or scanner), a display device (such as a print or computer display), or the subject itself.

Just as with color management, each device within the above imaging chain has its dynamic range. In prints and computer displays, nothing can become brighter than paperwhite or a maximum intensity pixel, respectively. Another device not shown above is our eyes, which also have their dynamic range. Translating image information between devices may therefore affect how that image is reproduced. The concept of dynamic range is therefore useful for relative comparisons between the actual scene, your camera, and the image on your screen or in the final print.
INFLUENCE OF LIGHT: ILLUMINANCE & REFLECTIVITY
The light intensity can be described in terms of incident and reflected light; both contribute to the dynamic range of a scene.
 Strong Reflections
 Uneven Incident Light
Scenes with high variation in reflectivity, such as those containing black objects in addition to strong reflections, may have a greater dynamic range than scenes with a large incident light variation. Photography under either scenario can easily exceed the dynamic range of your camera — particularly if the exposure is not spot on.
Accurate measurement of light intensity, or luminance, is therefore critical when assessing dynamic range. Here we use the term illuminance to specify only incident light. Both illuminance and luminance are typically measured in candelas per square meter (cd/m2). Approximate values for commonly encountered light sources are shown below.


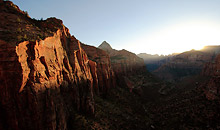
Here we see the vast variation possible for incident light since the above diagram is scaled to powers of ten. If a scene were unevenly illuminated by both direct and obstructed sunlight, this alone can greatly increase a scene's dynamic range (as apparent from the canyon sunset example with a partially-lit cliff face).
DIGITAL CAMERAS
Although the meaning of dynamic range for a real-world scene is simply the ratio between lightest and darkest regions (contrast ratio), its definition becomes more complicated when describing measurement devices such as digital cameras and scanners. Light is measured at each pixel in a cavity or well (photosite). Each photosite's size, in addition to how its contents are measured, determines a digital camera's dynamic range.
 Black Level
(Limited by Noise)
 White Level
(Saturated Photosite)
 Darker White Level
(Low Capacity Photosite)
Photosites can be thought of as buckets that hold photons as if they were water. Therefore, if the bucket becomes too full, it will overflow. A photosite that overflows is said to have become saturated and is therefore unable to discern between additional incoming photons — thereby defining the camera's white level. For an ideal camera, its contrast ratio would therefore be just the number of photons it could contain within each photosite, divided by the darkest measurable light intensity (one photon). If each held 1000 photons, then the contrast ratio would be 1000:1. Since larger photosites can contain a greater range of photons, the dynamic range is generally higher for digital SLR cameras compared to compact cameras (due to larger pixel sizes).
Technical Note: In some digital cameras, there is an extended low ISO setting that produces less noise, but also decreases dynamic range. This is because the setting in effect overexposes the image by a full f-stop, but then later truncates the highlights — thereby increasing the light signal. An example of this is many of the Canon cameras, which have an ISO-50 speed below the ordinary ISO-100.
In reality, consumer cameras cannot count individual photons. Dynamic range is therefore limited by the darkest tone where texture can no longer be discerned; we call this the black level. The black level is limited by how accurately each photosite can be measured and is therefore limited in darkness by image noise. Therefore, dynamic range generally increases for lower ISO speeds and cameras with less measurement noise.
Technical Note: Even if a photosite could count individual photons, it would still be limited by photon noise. Photon noise is created by the statistical variation in the arrival of photons, and therefore represents a theoretical minimum for noise. Total noise represents the sum of photon noise and read-out noise.
Overall, the dynamic range of a digital camera can therefore be described as the ratio of maximum light intensity measurable (at pixel saturation), to minimum light intensity measurable (above read-out noise). The most commonly used unit for measuring dynamic range in digital cameras is the f-stop, which describes total light range by powers of 2. A contrast ratio of 1024:1 could therefore also be described as having a dynamic range of 10 f-stops (since 210 = 1024). Depending on the application, each unit f-stop may also be described as a "zone" or "eV."
SCANNERS
Scanners are subject to the same saturation: noise criterion as for dynamic range in digital cameras, except it is instead described in terms of density (D). This is useful because it is conceptually similar to how pigments create tones in printed media, as shown below.
 |  |  | |
Low Reflectance | High Reflectance | High Pigment Density | Low Pigment Density |
The overall dynamic range in terms of density is therefore the maximum pigment density (Dmax), minus the minimum pigment density (Dmin). Unlike powers of 2 for f-stops, density is measured using powers of 10 (just as the Richter scale for earthquakes). A density of 3.0 therefore represents a contrast ratio of 1000:1 (since 103.0 = 1000).
Dynamic Range of Original |    |
| |
Dynamic Range of Scanner |
Instead of listing total density (D), scanner manufacturer's typically listed just the Dmax value, since Dmax - Dmin is approximately equal to Dmax. This is because unlike digital cameras, a scanner has full control over its light source, ensuring that minimal photosite saturation occurs.
For high pigment density, the same noise constraints apply to scanners as digital cameras (since they both use an array of photosites for measurement). Therefore the measurable Dmax is also determined by the noise present during the read-out of the light signal.
COMPARISON
Dynamic range varies so greatly that it is commonly measured on a logarithmic scale, similar to how vastly different earthquake intensities are all measured on the same Richter scale. Here we show the maximum measurable (or reproducible) dynamic range for several devices in terms of any preferred measure (f-stops, density, and contrast ratio). Move your mouse over each of the options below to compare these.
Select Measure for Dynamic Range: | ||
f-stops | Density | Contrast Ratio |


Select Types to Display Above: | |||
Printed Media | Scanners | Digital Cameras | Display Devices |
Note the huge discrepancy between reproducible dynamic range in prints, and that measurable by scanners and digital cameras. For a comparison with real-world dynamic range in a scene, these vary from approximately 3 f-stops for a cloudy day with nearly even reflectivity, to 12+ f-stops for a sunny day with highly uneven reflectivity.
Care should be taken when interpreting the above numbers; real-world dynamic range is a strong function of ambient light for prints and display devices. Prints not viewed under adequate light may not give their full dynamic range, while display devices require near-complete darkness to realize their full potential — especially for plasma displays. Finally, these values are rough approximations only; actual values depend on the age of the device, model generation, price range, etc.
Be warned that contrast ratios for display devices are often greatly exaggerated, as there is no manufacturer standard for listing these. Contrast ratios above 500:1 are often only the result of a very dark black point, instead of a brighter white point. For this reason, attention should be paid to both contrast ratio and luminosity. High contrast ratios (without a correspondingly higher luminosity) can be completely negated by even ambient candlelight.
THE HUMAN EYE
The human eye can perceive a greater dynamic range than is ordinarily possible with a camera. If we were to consider situations where our pupil opens and closes for varying light, our eyes can see over a range of nearly 24 f-stops.

On the other hand, for accurate comparisons with a single photo (at the constant aperture, shutter, and ISO), we can only consider the instantaneous dynamic range (where our pupil opening is unchanged). This would be similar to looking at one region within a scene, letting our eyes adjust, and not looking anywhere else. For this scenario, there is much disagreement, because our eye's sensitivity and dynamic range change depending on brightness and contrast. Most estimate anywhere from 10-14 f-stops.
The problem with these numbers is that our eyes are extremely adaptable. For situations of extreme low-light star viewing (where our eyes have adjusted to using rod cells for night vision), our eyes approach even higher instantaneous dynamic ranges.
BIT DEPTH & MEASURING DYNAMIC RANGE
Even if one's digital camera could capture a vast dynamic range, the precision at which light measurements are translated into digital values may limit usable dynamic range. The workhorse which translates these continuous measurements into discrete numerical values is called the analog to digital (A/D) converter. The accuracy of an A/D converter can be described in terms of bits of precision, similar to bit depth in digital images, although care should be taken that these concepts are not used interchangeably. The A/D converter is what creates values for the digital camera's RAW file format.
Bit Precision | Contrast Ratio | Dynamic Range | |
f-stops | Density | ||
8 | 256:1 | 8 | 2.4 |
10 | 1024:1 | 10 | 3.0 |
12 | 4096:1 | 12 | 3.6 |
14 | 16384:1 | 14 | 4.2 |
16 | 65536:1 | 16 | 4.8 |
Note: Above values are for A/D converter precision only, and should not be used to interpret results for 8 and 16-bit image files. Furthermore, the values shown are a theoretical maximum, assuming noise is not limiting, and this applies only to linear A/D converters.
As an example, 10-bits of tonal precision translates into a possible brightness range of 0-1023 (since 210 = 1024 levels). Assuming that each A/D converter number is proportional to actual image brightness (meaning twice the pixel value represents twice the brightness), 10-bits of precision can only encode a contrast ratio of 1024:1.
Most digital cameras use a 10 to 14-bit A/D converter, and so their theoretical maximum dynamic range is 10-14 stops. However, this high bit depth only helps minimize image posterization since the total dynamic range is usually limited by noise levels. Similar to how a high bit depth image does not necessarily mean that image contains more colors if a digital camera has a high precision A/D converter it does not necessarily mean it can record a greater dynamic range. In effect, dynamic range can be thought of as the height of a staircase whereas bit depth can be thought of as the number of steps. In practice, the dynamic range of a digital camera does not even approach the A/D converter's theoretical maximum; 8-12 stops is generally all one can expect from the camera.
INFLUENCE OF IMAGE TYPE & TONAL CURVE
Can digital image files record the full dynamic range of high-end devices? There seems to be much confusion on the internet about the relevance of image bit depth on recordable dynamic range.
We first need to distinguish between whether we are speaking of recordable dynamic range or displayable dynamic range. Even an ordinary 8-bit JPEG image file can conceivably record an infinite dynamic range — assuming that the right tonal curve is applied during RAW conversion and that the A/D converter has the required bit precision. The problem lies in the usability of this dynamic range; if too few bits are spread over too great of a tonal range, then this can lead to image pasteurization
On the other hand, the displayable dynamic range depends on the gamma correction or tonal curve implied by the image file or used by the video card and display device. Using a gamma of 2.2 (standard for PC's), it would be theoretically possible to encode a dynamic range of nearly 18 f-stops (see a tutorial on gamma correction, to be added). Again though, this would suffer from severe posterization. The only current standard solution for encoding a nearly infinite dynamic range (with no visible posterization) is to use high dynamic range (HDR) image files in Photoshop (or another supporting program).
Q5) Define Mach band effect?
A5)
Mach Band is a perceptual phenomenon. When the human eye looks at two bands of colors, one light and one dark, side-by-side, an eye perceives a narrow strip of gradient light to the dark light, in the middle separating the two solid bands. However, this is not the actual image.
In figure 1 below, we see the two bands as gradient however the colors are solid colors. Each solid-color reflects a different amount of light with the darker band reflecting lesser than the white band. The borders appear ‘blurred’ due to the focus of receptive fields onto the edge. This is caused by a competing reaction in the receptor cells in the retina known as lateral inhibition.
The bottom black line shows the physical intensity of light distributed across whilst the red line indicates our perception of light and dark Mach Band field with the dip indicating the dark Mach Band and the protrusion indicating the light Mach Band.
Q6) Define Brightness?
A6)
Brightness is a relative term. It depends on your visual perception. Since brightness is a relative term, so brightness can be defined as the amount of energy output by a source of light relative to the source we are comparing it to. In some cases, we can easily say that the image is bright, and in some cases, it's not easy to perceive.
For example
Just have a look at both of these images, and compare which one is brighter.

We can easily see, that the image on the right side is brighter as compared to the image on the left.
But if the image on the right is made darker than the first one, then we can say that the image on the left is brighter than the left.
How to make an image brighter.
Brightness can be simply increased or decreased by simple addition or subtraction, to the image matrix.
Consider this black image of 5 rows and 5 columns

Since we already know, that each image has a matrix at its behind that contains the pixel values. This image matrix is given below.
0 | 0 | 0 | 0 | 0 |
0 | 0 | 0 | 0 | 0 |
0 | 0 | 0 | 0 | 0 |
0 | 0 | 0 | 0 | 0 |
0 | 0 | 0 | 0 | 0 |
Since the whole matrix is filled with zero, and the image is very much darker.
Now we will compare it with another same black image to see this image got brighter or not.

Still, both the images are the same, now we will perform some operations on the image1, due to which it becomes brighter than the second one.
What we will do is, that we will simply add a value of 1 to each of the matrix values of image 1. After adding the image 1 would something like this.

Now we will again compare it with image 2, and see any difference.

We see, that still we cannot tell which image is brighter as both images look the same.
Now what we will do, is that we will add 50 to each of the matrix values of image 1 and see what the image has become.
The output is given below.

Now again, we will compare it with image 2.

Now you can see that image 1 is slightly brighter than image 2. We go on and add another 45 value to its matrix of image 1, and this time we compare again both images.
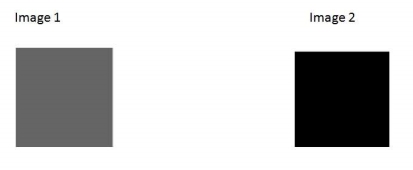
Now when you compare it, you can see that the image1 is brighter than image 2.
Even it is brighter than the old image1. At this point the matrix of the image1 contains 100 at each index as first add 5, then 50, then 45. So 5 + 50 + 45 = 100.
Q7) Define Tapered Quantization?
A7)
If gray levels in a certain range occur frequently while others occur rarely, the
Quantization levels are finely spaced in this range and coarsely spaced outside of
It. This method is sometimes called Tapered Quantization.
Q8) What do you mean by Gray level?
A8)
Image resolution
A resolution can be defined as the total number of pixels in an image. This has been discussed in Image resolution. And we have also discussed, that clarity of an image does not depends on a number of pixels, but on the spatial resolution of the image. This has been discussed in the spatial resolution. Here we are going to discuss another type of resolution which is called gray-level resolution.
Gray level resolution
Gray level resolution refers to the predictable or deterministic change in the shades or levels of gray in an image.
In short, the gray-level resolution is equal to the number of bits per pixel.
We have already discussed bits per pixel in our tutorial of bits per pixel and image storage requirements. We will define bpp here briefly.
BPP
The number of different colors in an image depends on the depth of color or bits per pixel.
Mathematically
The mathematical relation that can be established between gray level resolution and bits per pixel can be given as.

In this equation, L refers to a number of gray levels. It can also be defined as the shades of gray. And k refers to bpp or bits per pixel. So the 2 raised to the power of bits per pixel is equal to the gray level resolution.
For example:
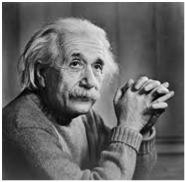
The above image of Einstein is grayscale. Means it is an image with 8 bits per pixel or 8bpp.
Now if were to calculate the gray-level resolution, here how we gonna do it.
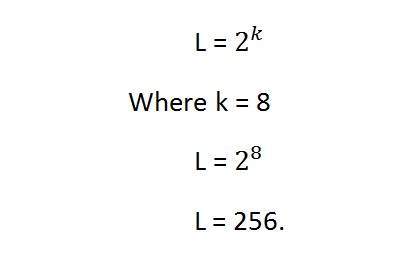
It means its gray-level resolution is 256. Or in another way, we can say that this image has 256 different shades of gray.
The more is bits per pixel of an image, the more is its gray-level resolution.
Defining gray-level resolution in terms of bpp
A gray-level resolution doesn't need to only be defined in terms of levels. We can also define it in terms of bits per pixel.
For example
If you are given an image of 4 bpp, and you are asked to calculate its gray-level resolution. There are two answers to that question.
The first answer is 16 levels.
The second answer is 4 bits.
Finding bpp from Gray level resolution
You can also find the bits per pixel from the given gray-level resolution. For this, we just have to twist the formula a little.
Equation 1.

This formula finds the levels. Now if we were to find the bits per pixel or in this case k, we will simply change it like this.
K = log base 2(L) Equation (2)
Because in the first equation the relationship between Levels (L ) and bits per pixel (k) is exponential. Now we have to revert it, and thus the inverse of exponential is the log.
Let's take an example to find bits per pixel from gray-level resolution.
For example:
If you are given an image of 256 levels. What are the bits per pixel required for it.
Putting 256 in the equation, we get.
K = log base 2 ( 256)
K = 8.
So the answer is 8 bits per pixel.
Gray level resolution and quantization:
The quantization will be formally introduced in the next tutorial, but here we are just going to explain the relationship between gray level resolution and quantization.
Gray level resolution is found on the y axis of the signal. In the tutorial of Introduction to signals and systems, we have studied that digitizing an analog signal requires two steps. Sampling and quantization.

Sampling is done on the x-axis. And quantization is done on Y-axis.
So that means digitizing the gray level resolution of an image is done in quantization.
Q9) Define Resolutions?
A9)
Image resolution
Image resolution can be defined in many ways. One type of it which is pixel resolution that has been discussed in the tutorial of pixel resolution and aspect ratio.
In this tutorial, we are going to define another type of resolution which is spatial resolution.
Spatial resolution
The spatial resolution states that the clarity of an image cannot be determined by the pixel resolution. The number of pixels in an image does not matter.
Spatial resolution can be defined as the
Smallest discernible detail in an image. (Digital Image Processing - Gonzalez, Woods - 2nd Edition)
Or in another way, we can define spatial resolution as the number of independent pixels values per inch.
In short what spatial resolution refers to is that we cannot compare two different types of images to see that which one is clear or which one is not. If we have to compare the two images, to see which one is more clear or which has more spatial resolution, we have to compare two images of the same size.
For example:
You cannot compare these two images to see the clarity of the image.
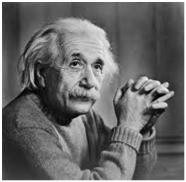

Although both images are of the same person, that is not the condition we are judging on. The picture on the left is a zoomed-out picture of Einstein with dimensions of 227 x 222. Whereas the picture on the right side has the dimensions of 980 X 749 and also it is a zoomed image. We cannot compare them to see that which one is more clear. Remember the factor of zoom does not matter in this condition, the only thing that matters is that these two pictures are not equal.
So in order to measure spatial resolution, the pictures below would serve the purpose.
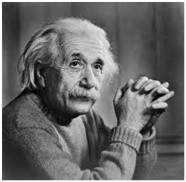
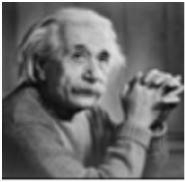
Now you can compare these two pictures. Both the pictures have the same dimensions which are 227 X 222. Now when you compare them, you will see that the picture on the left side has a more spatial resolution or it is more clear than the picture on the right side. That is because the picture on the right is a blurred image.
Measuring spatial resolution
Since the spatial resolution refers to clarity, so for different devices, the different measure has been made to measure it.
For example
- Dots per inch
- Lines per inch
- Pixels per inch
They are discussed in more detail in the next tutorial but just a brief introduction has been given below.
Dots per inch
Dots per inch or DPI is usually used in monitors.
Lines per inch
Lines per inch or LPI is usually used in laser printers.
Pixel per inch
Pixel per inch or PPI is a measure for different devices such as tablets, Mobile phones e.t.c.
Q10) Write the M X N digital image in compact matrix form?
A10)
f(x, y )= f(0, 0) f(0, 1)………………f(0, N-1)
f(1, 0) f(1, 1)………………f(1, N-1)
.
.
.
f(M-1) f(M-1, 1)…………f(M-1, N-1)