Unit - 4
Frequency Domain Analysis - I
Q1) Plot polar plot for T(S) = 1/S + 1
A1) (1) For polar plot substitute S=jw.
TF = 1/1 + jw
(2). Magnitude M = 1 + 0j / 1 + jw = 1/√1 + w2
(3). Phase φ = tan-1(0)/ tan-1w = - tan-1w
W M φ
0 1 00
1 0.707 -450
∞ 0 -900
The plot is shown in fig. 1
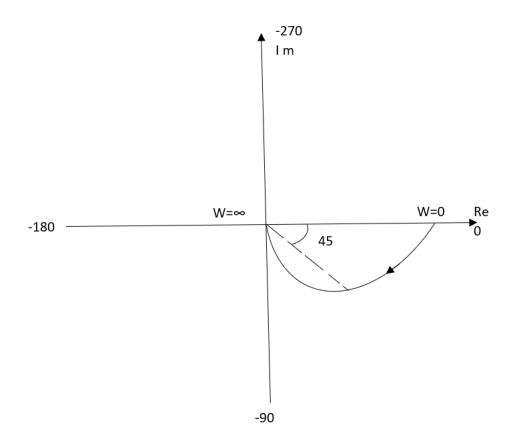
Fig 1 Polar Plot T(S) = 1/S + 1
Q2) Plot polar plot for T(S) = 1/(S+1)(S+2)
A2)
(1). S = jw
TF = 1/(1+jw)(2+jw)
(2). M = 1/(1+jw)(2+jw) = 1/-w2 + 3jw + 2
M = 1/√1 + w2√4 + w2
(3). Φ = - tan-1 w - tan-1(w/2)
W M Φ
0 0.5 00
1 0.316 -71.560
2 0.158 -108.430
∞ 0 -1800
The plot is shown in fig 2
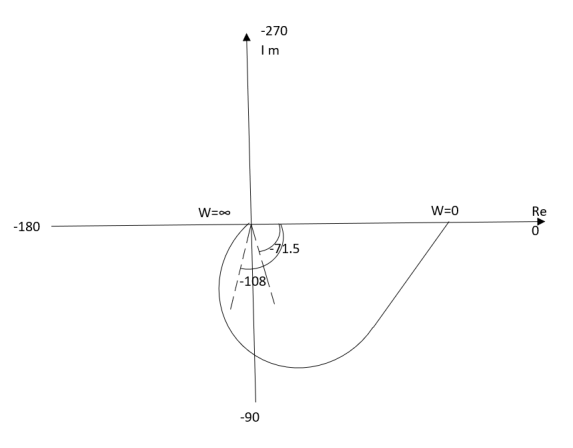
Fig 2 Polar Plot for T(S) = 1/(S+1)(S+2)
Intersection of polar plot with imaginary axis will be when real part of Transfer function = 0
M = 1/(jw + 1)(jw + 2)
= 1/-w2 + j3w + 2
Real part
Re(M) = 1/(2-w2)+j3w x (2-w2)-3jw/(2-w2)-3jw
Re(M) = (2-w2)/(2-w2+9w2) - 3jw/(2-w2) +9w2
Equating Real part = 0
(2-w2)/(2-w2)+ 9w2 = 0
W = +-√2
For w=√2 real part on the polar plot becomes zero.
So, polar plot intersects imaginary axis at w=√2 at φ = -900
Q3) Plot polar plot for T(S) = 1/(S+1)(S+2)(S+3)
A3)
(1). Substitute S =jw
(2). M = 1/√1+w2 √4+w2 √9+w2
(3). Φ = -tan-1w – tan-1 w/2 – tan-1w/3
W M φ
0 0.16 0
1 0.1 -900
2 0.04 -142.10
∞ 0 -270
(4). Intersection of Polar plot with Real axis
M = 1/(S+1)(S+2)(S+3)
= 1/S3+6S2+11S+6
=1/(jw)2+6(jw)2+11jw+6
= 1/(6-6w2)+j(11w-w3)
Re(M) = 0 [Intersection with imaginary axis ]
M = 6-6w2/(6-6w2)2+(11w-w2)2 - j(11w-w3)/(6-6w2)2+(11w-w2)2
Re(M) = 0
6-6w2 = 0
w=1
Im(M) = 0[Intersection with Real axis]
11w = w3
The plot is shown in fig 3
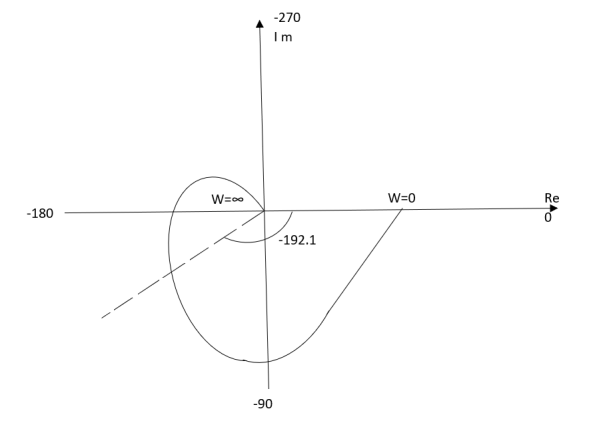
Fig 3 Polar Plot for T(S) = 1/(S+1)(S+2)(S+3)
Q4) For T(S) = 1/S(S+1) plot polar plot?
A4)
(1). M = 1/W√1+w2
(2). Φ = -900 –
Tan -1(W/T)
W M φ
0 ∞ -900
1 0.707 -1350
2 0.45 -153.40
∞ 0 -1800
The plot is shown in fig.4
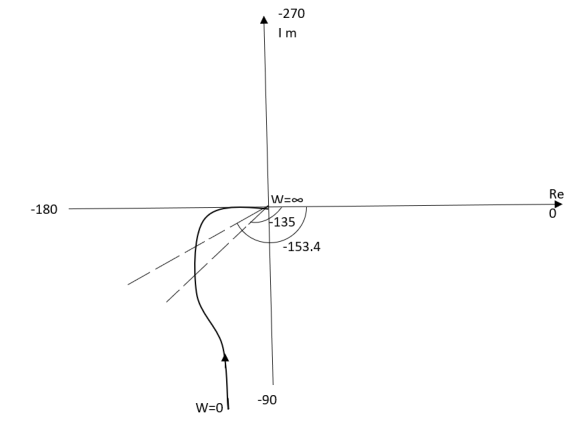
Fig 4 Polar Plot for T(S) = 1/S(S+1)
Q5) For T(s) = 1/S2(S+1) plot polar plot?
A5)
(1). M = 1/w2√1+jw
(2). Φ = -1800 – tan-1W/T
The plot is shown in fig. 5
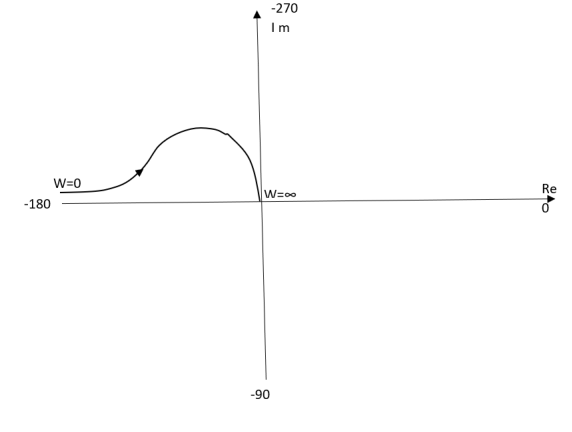
Fig 5 Polar Plot for T(s) = 1/S2(S+1)
Q6) Sketch the bode plot for transfer function
G(S) = 
A6)
Replace S = j
G(j =
= 
This is type 0 system. So initial slope is 0 dB decade. The starting point is given as
20 log10 K = 20 log10 1000
= 60 dB
Corner frequency  1 =
1 =  = 10 rad/sec
 2 =
2 =  = 1000 rad/sec
Slope after  1 will be -20 dB/decade till second corner frequency i.e
  2 after
  2 the slope will be -40 dB/decade (-20+(-20)) as there are poles
For phase plot
 = tan-1 0.1
 - tan-1 0.001
For phase plot


100 -900
200 -9.450
300 -104.80
400 -110.360
500 -115.420
600 -120.00
700 -124.170
800 -127.940
900 -131.350
1000 -134.420
The plot is shown in figure 6.
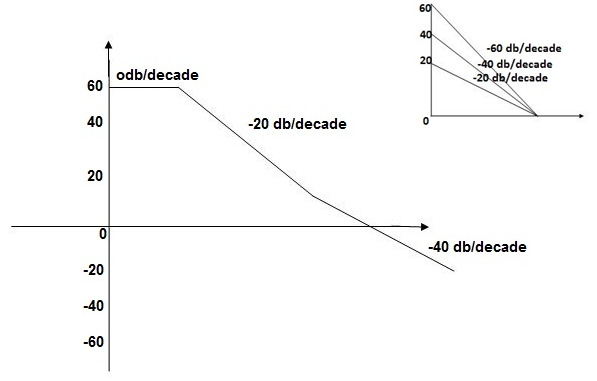
Fig 6. Magnitude Plot for G(S) = 
Q7) For the given transfer function determine
G(S) = 
Gain cross over frequency phase cross over frequency phase mergence and gain margin
A7)
Initial slope = 1
N = 1, (K)1/N = 2
K = 2
Corner frequency
 1 =
1 =  = 2 (slope -20 dB/decade
 2 =
2 =  = 20 (slope -40 dB/decade

Phase
 = tan-1
 - tan-1 0.5
  - tan-1 0.05
 = 900- tan-1 0.5
  - tan-1 0.05


1 -119.430
5 -172.230
10 -195.250
15 -209.270
20 -219.30
25 -226.760
30 -232.490
35 -236.980
40 -240.570
45 -243.490
50 -245.910
Finding  gc (gain cross over frequency
M = 
4 =  2 (
2 ( (
(
 6 (6.25
 104) + 0.252
 4 +
4 + 2 = 4
2 = 4
Let  2 = x
2 = x
X3 (6.25 104) + 0.252
 2 + x = 4
X1 = 2.46
X2 = -399.9
X3 = -6.50
For x1 = 2.46
 gc = 3.99 rad/sec(from plot )
For phase margin
PM = 1800 - 
 = 900 – tan-1 (0.5×
 gc) – tan-1 (0.05 ×
  gc)
gc)
= -164.50
PM = 1800 - 164.50
= 15.50
For phase cross over frequency ( pc)
pc)
 = 900 – tan-1 (0.5
  ) – tan-1 (0.05
  )
)
-1800 = -900 – tan-1 (0.5  pc) – tan-1 (0.05
  pc)
pc)
-900 – tan-1 (0.5  pc) – tan-1 (0.05
  pc)
pc)
Taking than on both sides
Tan 900 = tan-1
Let tan-1 0.5  pc = A, tan-1 0.05
  pc = B
 = 00
= 00
 = 0
= 0
1 =0.5  pc 0.05
 pc
pc
 pc = 6.32 rad/sec
The plot is shown in figure 7.
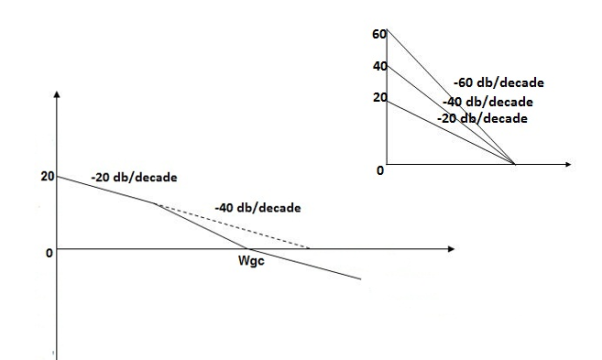
Fig 7. Magnitude Plot for G(S) = 
Q8) For the given transfer function
G(S) = 
Plot the rode plot find PM and GM
A8)
T1 = 0.5  1 =
1 =  = 2 rad/sec
Zero so, slope (20 dB/decade)
T2 = 0.2  2 =
2 =  = 5 rad/sec
Pole, so slope (-20 dB/decade)
T3 = 0.1 = T4 = 0.1
 3 =
3 =  4 = 10 (2 pole ) (-40 db/decade)
1. Initial slope 0 dB/decade till  1 = 2 rad/sec
2. From  1 to
1 to 2 (i.e. 2 rad /sec to 5 rad/sec) slope will be 20 dB/decade
3. From  2 to
2 to  3 the slope will be 0 dB/decade (20 + (-20))
4. From  3 ,
3 , 4 the slope will be -40 dB/decade (0-20-20)
Phase plot
 = tan-1 0.5
 - tan-1 0.2
 - tan-1 0.1
 - tan-1 0.1


500 -177.30
1000 -178.60
1500 -179.10
2000 -179.40
2500 -179.50
3000 -179.530
3500 -179.60
GM = 00
PM = 61.460
The plot is shown in figure 8.
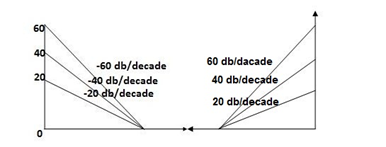
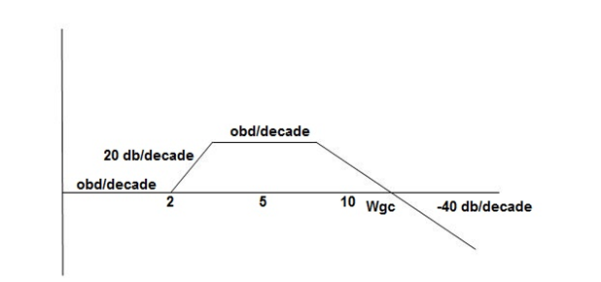
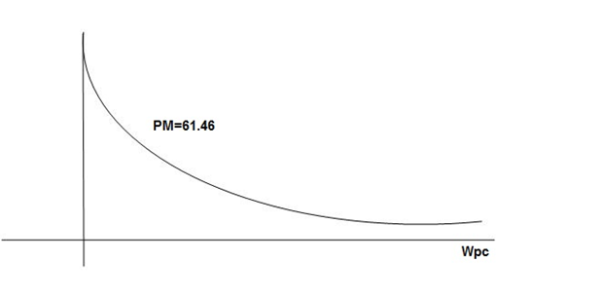
Fig 8. Magnitude and Phase plot for G(S) = 
Q8) For the given transfer function plot the bode plot (magnitude plot)
G(S) = 
A9)
Given transfer function
G(S) = 
Converting above transfer function to standard from
G(S) = 
= 
1. As type 1 system, so initial slope will be -20 dB/decade
2. Final slope will be -60 dB/decade as order of system decides the final slope
3. Corner frequency
T1 =  ,
,  11= 5 (zero)
T2 = 1,  2 = 1 (pole)
4. Initial slope will cut zero dB axis at
(K)1/N = 10
i.e  = 10
= 10
5. Finding  n and
n and 
T(S) = 
T(S)= 
Comparing with standard second order system equation
S2+2 ns +
ns + n2
n2
 n = 11 rad/sec
 n = 5
n = 5
 11 = 5
 =
=  = 0.27
6. Maximum error
M = -20 log 2
= +6.5 dB
7. As K = 10, so whole plot will shift by 20 log 10 10 = 20 Db
The plot is shown in figure 9.
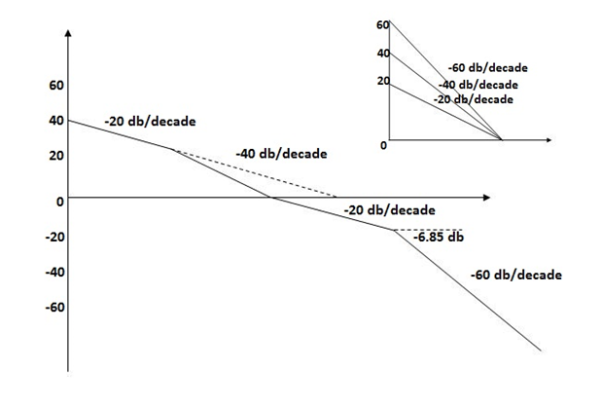
Fig 9. Magnitude plot for G(S) = 
Q10) For the given plot determine the transfer function
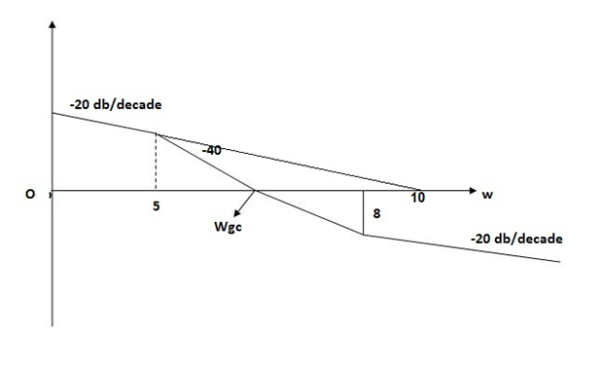
Fig 10 Magnitude plot for Q9
A10)
From figure 10, we can conclude that
1. Initial slope = -20 dB/decade so type -1
2. Initial slope alls 0 dB axis at  = 10 so
K1/N N = 1
(K)1/N = 10.
3. Corner frequency
 1 =
1 =  = 0.2 rad/sec
 2 =
2 =  = 0.125 rad/sec
4. At  = 5 the slope becomes -40 dB/decade, so there is a pole at
  = 5 as slope changes from -20 dB/decade to -40 dB/decade
5. At  = 8 the slope changes from -40 dB/decade to -20 dB/decade hence is a zero at
  = 8 (-40+(+20)=20)
6. Hence transfer function is
T(S) = 
Q9) For T(S) = 1/S plot polar plot?
A11)
(1). S = jw
(2). M = 1/W
(3). Φ = -tan-1(W/O) = -900
W M φ
0 ∞ -900
1 1 -900
2 0.5 -900
∞ 0 -900
The plot is shown in fig. 11
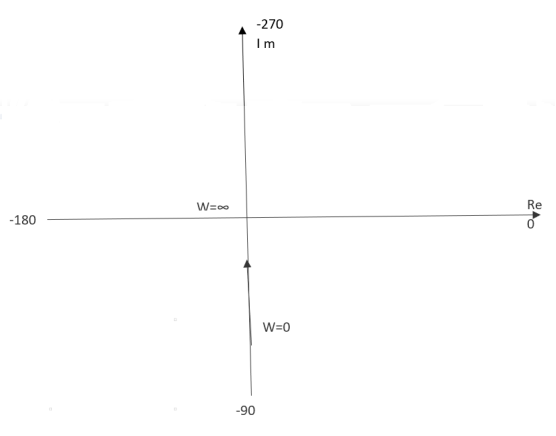
Fig 11 Polar plot for T(S) = 1/S
Q10) For the transfer function below plot the Nyquist plot and also comment on stability?
G(S) = 1/S+1
A12)
N = Z – P (No pole of right half of S plane P = 0)
P = 0, N = Z
NYQUIST PATH:
P1 = W – (0 to - ∞)
P2 = ϴ( - π/2 to 0 to π/2 )
P3 = W(+∞ to 0)
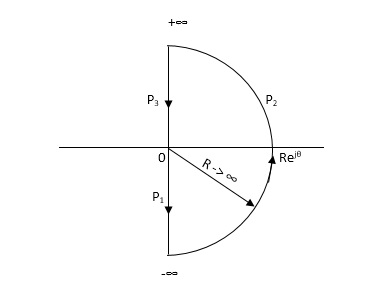
Substituting S = jw
G(jw) = 1/jw + 1
M = 1/√1+W2
Φ = -tan-1(W/I)
For P1: W(0 to -∞)
W M φ
0 1 0
-1 1/√2 +450
-∞ 0 +900
Path P2:
W = Rejϴ R ∞ϴ -π/2 to 0 to π/2
G(jw) = 1/1+jw
= 1/1+j(Rejϴ) (neglecting 1 as R ∞)
M = 1/Rejϴ = 1/R e-jϴ
M = 0 e-jϴ = 0
Path P3:
W = -∞ to 0
M = 1/√1+W2, φ = -tan-1(W/I)
W M φ
∞ 0 -900
1 1/√2 -450
0 1 00
The Nyquist Plot is shown in fig 12.
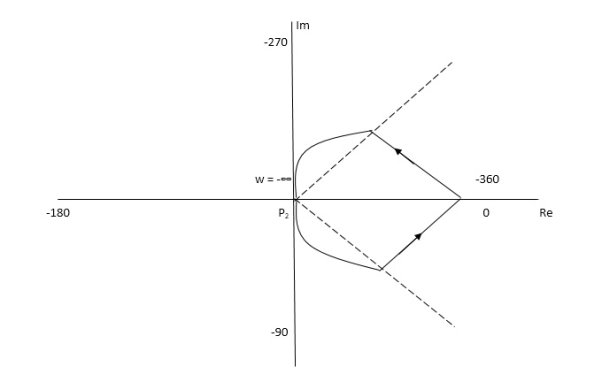
Fig 12. Nyquist plot for G(S) = 1/S+1
From plot we can see that -1 is not encircled so, N = 0
But N = Z, Z = 0
So, system is stable.
Q11) For the transfer function below plot the Nyquist Plot and comment on stability G(S) = 1/(S + 4)(S + 5)
A13)
N = Z – P, P = 0, No pole on right half of S-plane
N = Z
NYQUIST PATH
P1 = W(0 to -∞)
P2 = ϴ(-π/2 to 0 to +π/2)
P3 = W(∞ to 0)
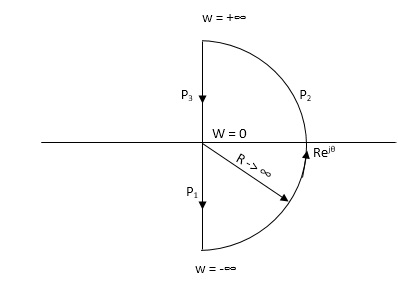
Path P1 W(0 to -∞)
M = 1/√42 + w2 √52 + w2
Φ = -tan-1(W/4) – tan-1(W/5)
W M Φ
0 1/20 00
-1 0.047 25.350
-∞ 0 +1800
Path P3 will be the mirror image across the real axis.
Path P2: ϴ(-π/2 to 0 to +π/2)
S = Rejϴ
G(S) = 1/(Rejϴ + 4)( Rejϴ + 5)
R∞
= 1/ R2e2jϴ = 0.e-j2ϴ = 0
The plot is shown in fig 13. From plot N=0, Z=0, system stable.
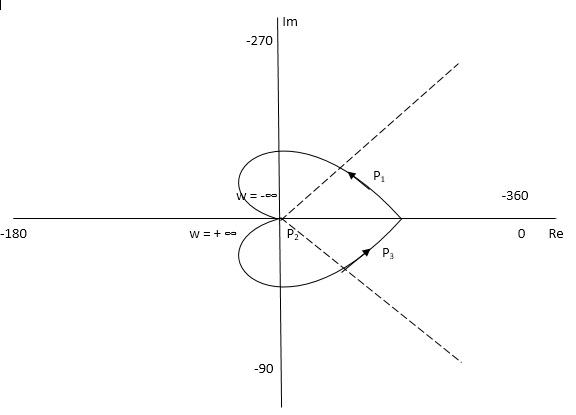
Fig 13. Nyquist plot for G(S) = 1/(S + 4)(S + 5)
Q12) For the given transfer function, plot the Nyquist plot and comment on stability G(S) = k/S2(S + 10)?
A14)
As the poles exists at origin. So, first time we do not include poles in Nyquist plot. Then check the stability for second case we include the poles at origin in Nyquist path. Then again check the stability.
PART – 1: Not including poles at origin in the Nyquist Path.
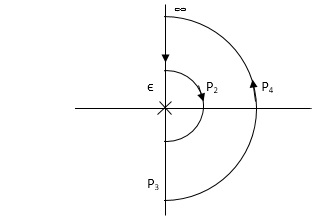
P1 W(∞ Ɛ) where Ɛ 0
P2 S = Ɛejϴ ϴ(+π/2 to 0 to -π/2)
P3 W = -Ɛ to -∞
P4 S = Rejϴ, R ∞, ϴ = -π/2 to 0 to +π/2
For P1
M = 1/w.w√102 + w2 = 1/w2√102 + w2
Φ = -1800 – tan-1(w/10)
W M Φ
∞ 0 -3 π/2
Ɛ ∞ -1800
Path P3 will be mirror image of P1 about Real axis.
G(Ɛ ejϴ) = 1/( Ɛ ejϴ)2(Ɛ ejϴ + 10)
Ɛ 0, ϴ = π/2 to 0 to -π/2
= 1/ Ɛ2 e2jϴ(Ɛ ejϴ + 10)
= ∞. e-j2ϴ [ -2ϴ = -π to 0 to +π ]
Path P2 will be formed by rotating through -π to 0 to +π
Path P4 S = Rejϴ R ∞ ϴ = -π/2 to 0 to +π/2
G(Rejϴ) = 1/ (Rejϴ)2(10 + Rejϴ)
= 0
N = Z – P
No poles on right half of S plane so, P = 0
N = Z – 0
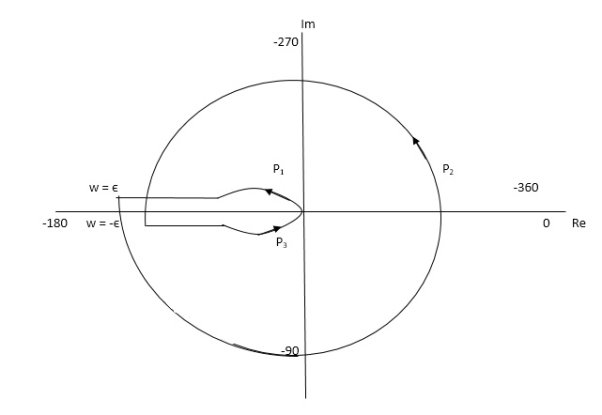
Fig 14. Nyquist plot for G(S) = k/S2(S + 10)
But from plot shown in fig 15. It is clear that number of encirclements in Anticlockwise direction. So,
N = 2
N = Z – P
2 = Z – 0
Z = 2
Hence, system unstable.
PART 2 Including poles at origin in the Nyquist Path.
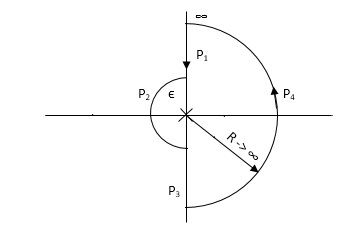
P1 W(∞ to Ɛ) Ɛ 0
P2 S = Ɛejϴ Ɛ 0 ϴ(+π/2 to +π to +3π/2)
P3 W(-Ɛ to -∞) Ɛ 0
P4 S = Rejϴ, R ∞, ϴ(3π/2 to 2π to +5π/2)
M = 1/W2√102 + W2 , φ = - π – tan-1(W/10)
P1 W(∞ to Ɛ)
W M φ
∞ 0 -3 π/2
Ɛ ∞ -1800
P3( mirror image of P1)
P2 S = Ɛejϴ
G(Ɛejϴ) = 1/ Ɛ2e2jϴ(10 + Ɛejϴ)
Ɛ 0
G(Ɛejϴ) = 1/ Ɛ2e2jϴ(10)
= ∞. e-j2ϴϴ(π/2 to π to 3π/2)
-2ϴ = (-π to -2π to -3π)
P4 = 0
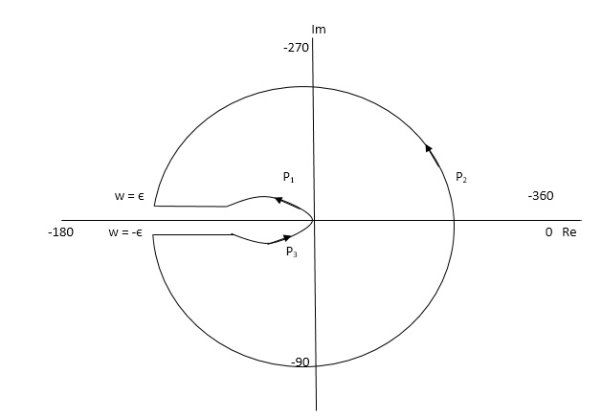
Fig 15. Nyquist Plot for G(S) = k/S2(S + 10)
The plot is shown in fig. From the plot it is clear that there is no encirclement of -1 in Nyquist path. (N = 0). But the two poles at origin lies to the right half of S-plane in Nyquist path.(P = 2)[see path P2]
N = Z – P
0 = Z – 2
Z = 2
Hence, system is unstable.
Path P2 will be formed by rotating through -π to -2π to -3π