Unit - 5
Frequency domain analysis-II
Q1) Sketch the bode plot for transfer function
G(S) = 
A1)
Replace S = j
G(j =
= 
This is type 0 system. So initial slope is 0 dB decade. The starting point is given as
20 log10 K = 20 log10 1000
= 60 dB
Corner frequency  1 =
1 =  = 10 rad/sec
 2 =
2 =  = 1000 rad/sec
Slope after  1 will be -20 dB/decade till second corner frequency i.e
  2 after
  2 the slope will be -40 dB/decade (-20+(-20)) as there are poles
For phase plot
 = tan-1 0.1
 - tan-1 0.001
For phase plot


100 -900
200 -9.450
300 -104.80
400 -110.360
500 -115.420
600 -120.00
700 -124.170
800 -127.940
900 -131.350
1000 -134.420
The plot is shown in figure.
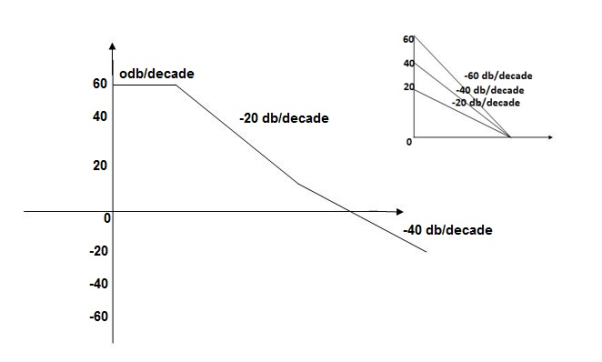
Fig: Magnitude Plot for G(S) = 
Q2) For the given transfer function determine
G(S) = 
Gain cross over frequency phase cross over frequency phase mergence and gain margin
A2)
Initial slope = 1
N = 1, (K)1/N = 2
K = 2
Corner frequency
 1 =
1 =  = 2 (slope -20 dB/decade
 2 =
2 =  = 20 (slope -40 dB/decade

Phase
 = tan-1
 - tan-1 0.5
  - tan-1 0.05
 = 900- tan-1 0.5
  - tan-1 0.05


1 -119.430
5 -172.230
10 -195.250
15 -209.270
20 -219.30
25 -226.760
30 -232.490
35 -236.980
40 -240.570
45 -243.490
50 -245.910
Finding  gc (gain cross over frequency
M = 
4 =  2 (
2 ( (
(
 6 (6.25
 104) + 0.252
 4 +
4 + 2 = 4
2 = 4
Let  2 = x
2 = x
X3 (6.25 104) + 0.252
 2 + x = 4
X1 = 2.46
X2 = -399.9
X3 = -6.50
For x1 = 2.46
 gc = 3.99 rad/sec(from plot )
For phase margin
PM = 1800 - 
 = 900 – tan-1 (0.5×
 gc) – tan-1 (0.05 ×
  gc)
gc)
= -164.50
PM = 1800 - 164.50
= 15.50
For phase cross over frequency ( pc)
pc)
 = 900 – tan-1 (0.5
  ) – tan-1 (0.05
  )
)
-1800 = -900 – tan-1 (0.5  pc) – tan-1 (0.05
  pc)
pc)
-900 – tan-1 (0.5  pc) – tan-1 (0.05
  pc)
pc)
Taking than on both sides
Tan 900 = tan-1
Let tan-1 0.5  pc = A, tan-1 0.05
  pc = B
 = 00
= 00
 = 0
= 0
1 =0.5  pc 0.05
 pc
pc
 pc = 6.32 rad/sec
The plot is shown in figure.
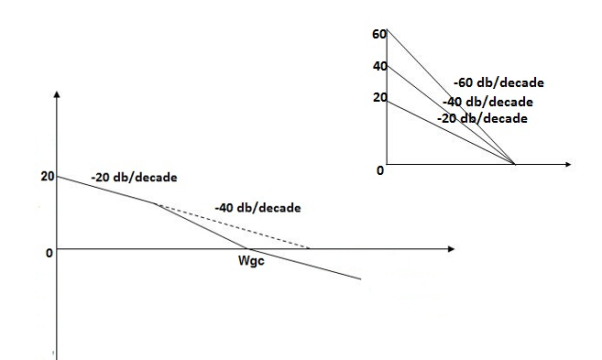
Fig. Magnitude Plot for G(S) = 
Q3) For the given transfer function
G(S) = 
Plot the rode plot find PM and GM
A3)
T1 = 0.5  1 =
1 =  = 2 rad/sec
Zero so, slope (20 dB/decade)
T2 = 0.2  2 =
2 =  = 5 rad/sec
Pole, so slope (-20 dB/decade)
T3 = 0.1 = T4 = 0.1
 3 =
3 =  4 = 10 (2 pole ) (-40 db/decade)
1. Initial slope 0 dB/decade till  1 = 2 rad/sec
2. From  1 to
1 to 2 (i.e. 2 rad /sec to 5 rad/sec) slope will be 20 dB/decade
3. From  2 to
2 to  3 the slope will be 0 dB/decade (20 + (-20))
4. From  3 ,
3 , 4 the slope will be -40 dB/decade (0-20-20)
Phase plot
 = tan-1 0.5
 - tan-1 0.2
 - tan-1 0.1
 - tan-1 0.1


500 -177.30
1000 -178.60
1500 -179.10
2000 -179.40
2500 -179.50
3000 -179.530
3500 -179.60
GM = 00
PM = 61.460
The plot is shown in figure.
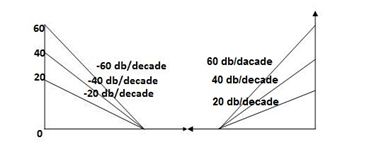
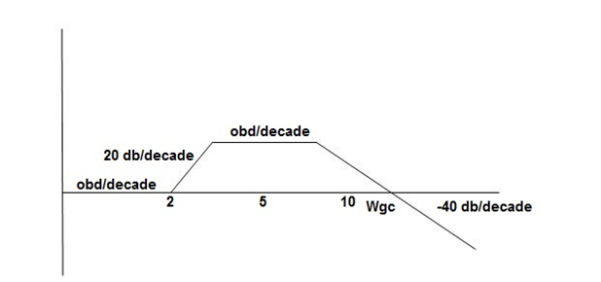
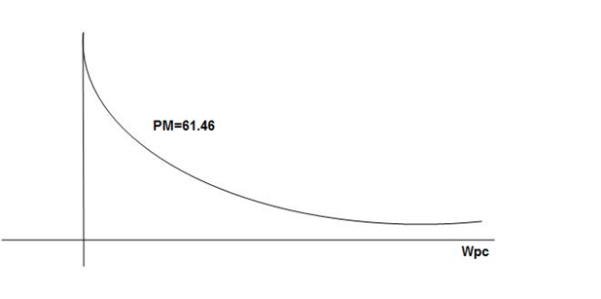
Fig. Magnitude and Phase plot for G(S) = 
Q4) For the given transfer function plot the bode plot (magnitude plot)
G(S) = 
A4)
Given transfer function
G(S) = 
Converting above transfer function to standard from
G(S) = 
= 
1. As type 1 system, so initial slope will be -20 dB/decade
2. Final slope will be -60 dB/decade as order of system decides the final slope
3. Corner frequency
T1 =  ,
,  11= 5 (zero)
T2 = 1,  2 = 1 (pole)
4. Initial slope will cut zero dB axis at
(K)1/N = 10
i.e  = 10
= 10
5. Finding  n and
n and 
T(S) = 
T(S)= 
Comparing with standard second order system equation
S2+2 ns +
ns + n2
n2
 n = 11 rad/sec
 n = 5
n = 5
 11 = 5
 =
=  = 0.27
6. Maximum error
M = -20 log 2
= +6.5 dB
7. As K = 10, so whole plot will shift by 20 log 10 10 = 20 Db
The plot is shown in figure.
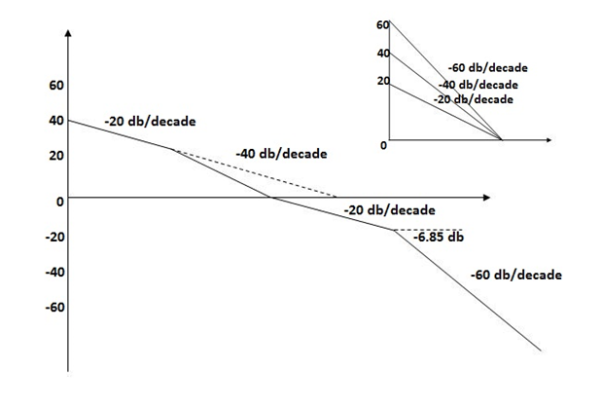
Fig. Magnitude plot for G(S) = 
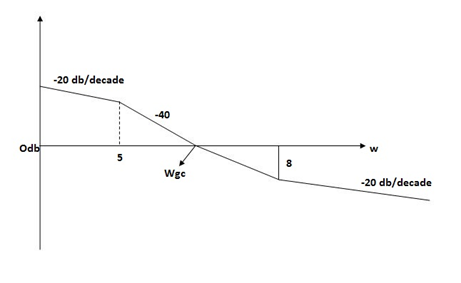
Q5) For the given plot determine the transfer function
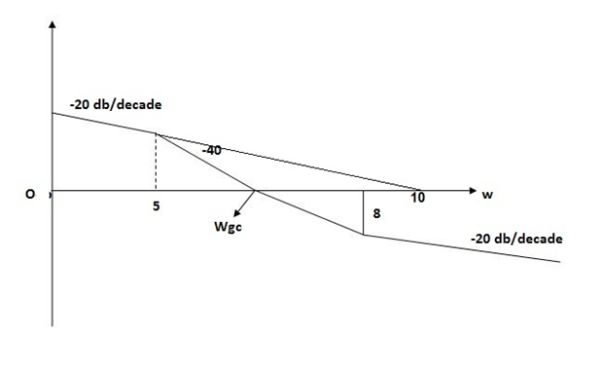
Fig. Magnitude plot
A5)
From figure, we can conclude that
1. Initial slope = -20 dB/decade so type -1
2. Initial slope alls 0 dB axis at  = 10 so
K1/N N = 1
(K)1/N = 10.
3. Corner frequency
 1 =
1 =  = 0.2 rad/sec
 2 =
2 =  = 0.125 rad/sec
4. At  = 5 the slope becomes -40 dB/decade, so there is a pole at
  = 5 as slope changes from -20 dB/decade to -40 dB/decade
5. At  = 8 the slope changes from -40 dB/decade to -20 dB/decade hence is a zero at
  = 8 (-40+(+20)=20)
6. Hence transfer function is
T(S) = 
Q6) For G(s) =  Plot magnitude and phase plot using bode plot?
A6)
TF = 
M = 
MdB = -20 log10 ( at T=2
 MdB
MdB
1 -20 log10
10 -20 log10
100 -20 log10
 MdB
MdB  =
= =
= 
0.1 -20 log10 = 1.73
  10-3
10-3
0.1 -20 log10 = -0.1703
0.5 -20 log10 = -3dB
1 -20 log10 = -6.98
10 -20 log10 = -26.03
100 -20 log10 = -46.02
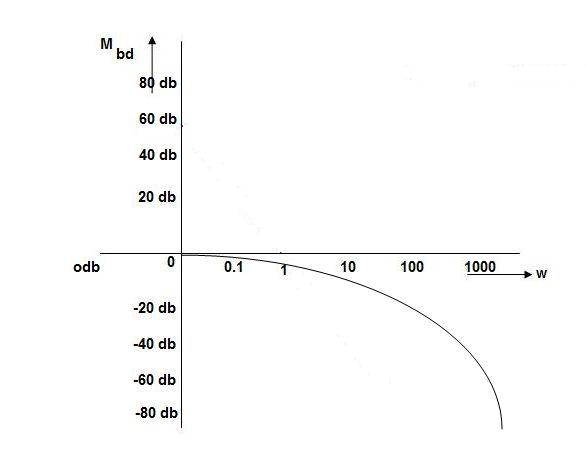
Without approximation
For second order system
TF = 
TF = 
= 
= 
= 
M= 
MdB= 
Case 1  <<
<<
 << 1
<< 1
MdB= 20 log10 = 0 dB
Case 2  >>
>>
 >> 1
>> 1
MdB = -20 log10
= -20 log10
= -20 log10
 < 1
< 1  is very large so neglecting other two terms
MdB = -20 log10
= -40 log10
Case 3 when case 1 is equal to case 2
-40 log10 = 0
= 0
 = 1
= 1

The natural frequency is our corner frequency
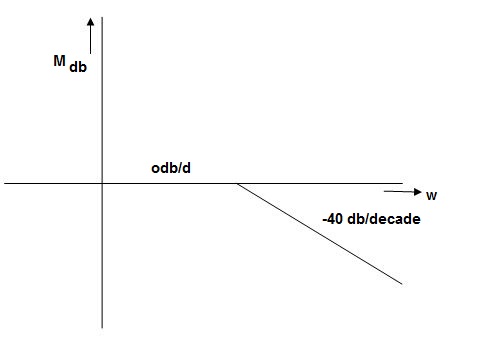
Max error at  i.e at corner frequency
MdB = -20 log10
For 
MdB = -20 log10 
 error for
Completely the error depends upon the value of  (error at corner frequency)
The maximum error will be
MdB = -20 log10 
M = -20 log10 
 = 0
= 0

 is resonant frequency and at this frequency we are getting the maximum error so the magnitude will be
M = - +
+ 
= 
Mr =
MdB = -20 log10
MdB = -20 log10 
 = tan-1

Mr = 
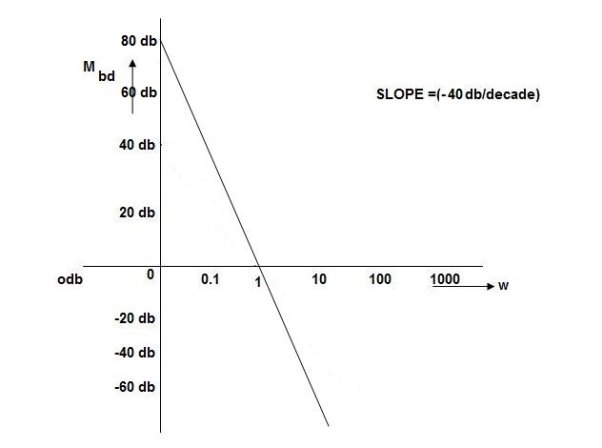
Q7) Plot the magnitude plot for G(S) = 
A7)
G(j ) =
) = 
M =  ;
;  = -1800 (-20tan-1
 )
)
MdB = +20 log  -2
-2
MdB = -40 log10
 MdB
MdB
0.01 80
0.1 40
1 0 (pole at origin)
10 -40
100 -80
Slope = 40dbdecade
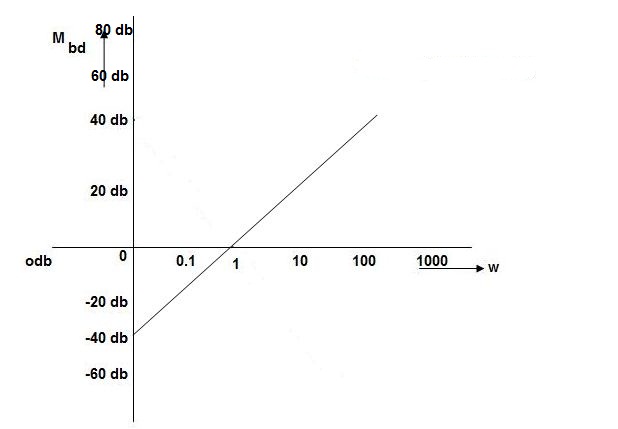
Q8) Plot the bode for G(S) = S2
A8)
M=  2 MdB = 20 log10
 2
2
 = 1800 = 40 log10
W MdB
0.01 -80
0.1 -40
1 0
10 40
100 80
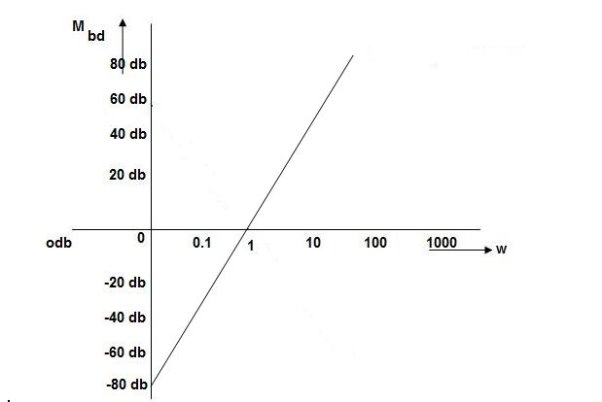
Q9) Plot magnitude plot for G(S) = 
A9)
G(j ) =
) = 
M = 
MdB = 20 log10 K-20 log10
 = tan-1(
 ) –tan-1(
 )
)
 = 0-900 = -900
K=1 K=10  =-20 log10   0.01 40 60 0.1 20 40 1 0 20 10 -20 0 100 -40 -20 |
Q10) Explain gain and phase cross over frequency?
A10)
Gain Cross Over Frequency:
The frequency at which the bode plot culls the 0db axis is called as Gain Cross Over Frequency.
Phase Cross Over Frequency:
The Frequency at which the phase plot culls the -1800 axis.
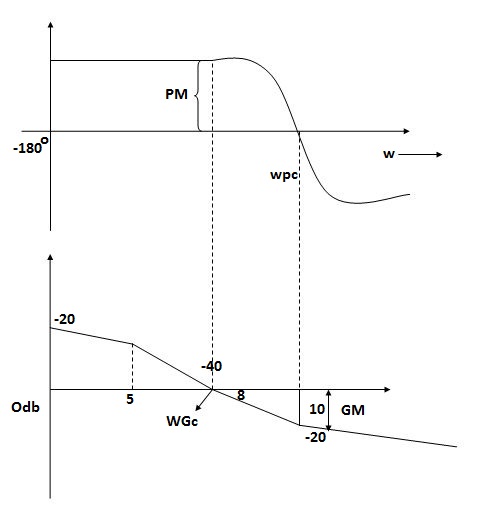
GM=MdB= -20 log [ G (jw)]
 .:
.: 
 .:
.: 
1) When gain cross over frequency is smaller then phase curves over frequency the system is stable and vice versa.
i) More the difference b/WPC and WGC core is the stability of system
Ii) If GM is below 0dB axis than take ilb +ve and stable. If GM above 0dB axis, that is take -ve
GM= ODB - 20 log M
Iii) The IM should also lie above -1800 for making the system (i.e. pm=+ve
Iv) For a stable system GM and PM should be -ve
v) GM and PM both should be +ve more the value of GM and PM more the system is stable.
Vi) If Wpc and Wgc are in same line Wpc= Wgc than system is marginally stable. As we get GM=0dB.