Unit - 5
Activity based cost management
Q1) Explain benchmarking
A1) Benchmarking is the competitive edge that allows organizations to adapt, grow, and thrive through change. Benchmarking is the process of measuring key business metrics and practices and comparing them—within business areas or against a competitor, industry peers, or other companies around the world—to understand how and where the organization needs to change in order to improve performance. There are four main types of benchmarking: internal, external, performance, and practice.
- Performance benchmarking involves gathering and comparing quantitative data (i.e., measures or key performance indicators). Performance benchmarking is usually the first step organizations take to identify performance gaps.
- Practice benchmarking involves gathering and comparing qualitative information about how an activity is conducted through people, processes, and technology.
- Internal benchmarking compares metrics (performance benchmarking) and/or practices (practice benchmarking) from different units, product lines, departments, programs, geographies, etc., within the organization.
- External benchmarking compares metrics and/or practices of one organization to one or many others.
Q2) Explain balanced score card
A2) Balanced score card
A balanced scorecard is a strategic planning framework that companies use to assign priority to their products, projects, and services; communicate about their targets or goals; and plan their routine activities. The scorecard enables companies to monitor and measure the success of their strategies to determine how well they have performed.
Four Perspectives of the Balanced Scorecard
The following are the key areas that a balanced scorecard focuses on:
1. Financial perspective
Under the financial perspective, the goal of a company is to ensure that it earns a return on the investments made and manages key risks involved in running the business. The goals can be achieved by satisfying the needs of all players involved with the business, such as the shareholders Stake holder vs. Shareholder. The terms “stakeholder” and “shareholder” are often used interchangeably in the business environment. Looking closely at the meanings of stakeholder vs shareholder, there are key differences in usage. Generally, a shareholder is a stakeholder of the company while a stakeholder is not necessarily a shareholder., customers, and suppliers.
The shareholders are an integral part of the business since they are the providers of capital; they should be happy when the company achieves financial success. They want to be sure that the company is continually generating revenues and that the organization meets goals such as improving profitability and developing new revenue sources. Steps taken to achieve such goals may include introducing new products and services, improving the company’s value proposition. Value Proposition: Value proposition is a promise of value stated by a company that summarizes the benefit(s) of the company’s product or service and how they are delivered, and cutting down on the costs of doing business.
2. Customer perspective
The customer perspective monitors how the entity is providing value to its customers and determines the level of customer satisfaction with the company’s products or services. Products and Services, A product is a tangible item that is put on the market for acquisition, attention, or consumption while a service is an intangible item, which arises from. Customer satisfaction is an indicator of the company’s success. How well a company treats its customers can obviously affect its profitability.
The balanced scorecard considers the company’s reputation versus its competitors. How do customers see your company vis-à-vis your competitors? It enables the organization to step out of its comfort zone to view itself from the customer’s point of view rather than just from an internal perspective.
Some of the strategies that a company can focus on to improve its reputation among customers include improving product quality, enhancing the customer shopping experience, and adjusting the prices of its main products and services.
3. Internal business processes perspective
A business’ internal processes determine how well the entity runs. A balanced scorecard puts into perspective the measures and objectives that can help the business run more effectively. Also, the scorecard helps evaluate the company’s products or services and determine whether they conform to the standards that customers desire. A key part of this perspective is aiming to answer the question, “What are we good at?”
The answer to that question can help the company formulate marketing strategies and pursue innovations that lead to the creation of new and improved ways of meeting the needs of customers.
4. Organizational capacity perspective
Organizational capacity is important in optimizing goals and objectives with favorable results. The personnel in the organization’s departments are required to demonstrate high performance in terms of leadership, the entity’s culture, application of knowledge, and skill sets.
Proper infrastructure is required for the organization to deliver according to the expectations of management. For example, the organization should use the latest technology to automate activities and ensure a smooth flow of activities.
Q3) Explain value chain analysis
A3) A value chain is a concept describing the full chain of a business's activities in the creation of a product or service -- from the initial reception of materials all the way through its delivery to market, and everything in between.
The value chain framework is made up of five primary activities -- inbound operations, operations, outbound logistics, marketing and sales, service -- and four secondary activities -- procurement and purchasing, human resource management, technological development and company infrastructure.
A value chain analysis is when a business identifies its primary and secondary activities and sub activities, and evaluates the efficiency of each point. A value chain analysis can reveal linkages, dependencies and other patterns in the value chain.
How do value chains work?
The value chain framework helps organizations identify and group their own business functions into primary and secondary activities.
Analyzing these value chain activities, sub activities and the relationships between them helps organizations understand them as a system of interrelated functions. Then, organizations can individually analyze each to assess whether the output of each activity or sub activity can be improved -- relative to the cost, time and effort they require.
When an organization applies the value chain concept to its own activities, it is called a value chain analysis.
Primary activities
Primary activities contribute to a product or service's physical creation, sale, maintenance and support. These activities include the following:
- Inbound operations. The internal handling and management of resources coming from outside sources -- such as external vendors and other supply chain sources. These outside resources flowing in are called "inputs" and may include raw materials.
- Operations. Activities and processes that transform inputs into "outputs" -- the product or service being sold by the business that flow out to customers. These "outputs" are the core products that can be sold for a higher price than the cost of materials and production to create a profit.
- Outbound logistics. The delivery of outputs to customers. Processes involve systems for storage, collection and distribution to customers. This includes managing a company's internal systems and external systems from customer organizations.
- Marketing and sales. Activities such as advertising and brand-building, which seek to increase visibility, reach a marketing audience and communicate why a consumer should purchase a product or service.
- Service. Activities such as customer service and product support, which reinforce a long-term relationship with the customers who have purchased a product or service.
- As management issues and inefficiencies are relatively easy to identify here, well-managed primary activities are often the source of a business's cost advantage. This means the business can produce a product or service at a lower cost than its competitors.
Secondary activities
The following secondary activities support the various primary activities:
- Procurement and purchasing. Finding new external vendors, maintaining vendor relationships, and negotiating prices and other activities related to bringing in the necessary materials and resources used to build a product or service.
- Human resource management. The management of human capital. This includes functions such as hiring, training, building and maintaining an organizational culture; and maintaining positive employee relationships.
- Technology development. Activities such as research and development, IT management and cybersecurity that build and maintain an organization's use of technology.
- Company infrastructure. Necessary company activities such as legal, general management, administrative, accounting, finance, public relations and quality assurance.
Q4) Explain budgetary control
A4) Budgetary Control
BUDGET
CIMA, of England and Wales has defined the terms budget as “A financial / quantitative statement prepared and approved prior to a defined period of time of the policy to be pursued during that period for the purpose of attaining a given objective. It may include, expenditure and employment of capital”.
BUDGETARY CONTROL
CIMA London defines budgetary control as the establishment of the budgets relating to the responsibilities of the budgets relating to the requirement of the policy and the continuous comparison of actual with the budgeted results, either to secure by individual action the objective of that policy or to provide a base for its revision”
Salient features of budgetary control
• Determining the objectives to be achieved over the budget period
• Determining the variety of activities that should be undertaken for the achievement of the objectives.
• Drawing up a plan or a scheme of operation in respect of each class of activity.
• Laying out a system of comparison of actual performance by each person, section or department with the relevant budget.
• Determination of causes for the discrepancies, if any.
• Ensuring the corrective action will be taken.
Objectives
1. PLANNING: Planning is deciding in advance the future course of action, in budgeting, also the same task is performed. It will force management at all levels to plan the activities and policies for future period.
2. DEFINING RESPONSIBILITIES: The main purpose of budgeting is defining the responsibilities of each functional executive, so that there may be no conflict among the executives.
3. COORDINATION: Budgetary control helps in coordinating various activities of the firm like planning policies, directing scheduling, processing etc. so that the common objective of firm may be achieved successfully.
4. PERFORMANCE EVALUATION: Budget can provide the basis for comparison between actual performance with budgeted. It is helpful in controlling he deviation from actuals and take necessary corrective action.
5. COST CONTROL: Budget is a powerful tool for controlling the expenditures.
ADVANTAGES OF BUDGETARY CONTROL
- It establishes the objective of the organization and enables the management to conduct business in the most efficient manner.
- Budget is helpful in allocating scarce resources in most optimal way.
- Budget identifies the areas of inefficiencies within the organization.
- Budget is the most important tool of controlling because it provides a yardstick, against which the performance of organization can be evaluated.
- It is a basis for management by exception as it compares actual and budgeted results.
- It ensures effective utilization of men, machine, material and money.
LIMITATIONS OF BUDGETARY CONTROL SYSTEM
- Budgets may or may not be true, as they are based on estimates.
- Budgets are considered as a rigid document
- Budgets cannot be executed automatically.
- Staff co-operation is usually not available during budgetary control exercise.
- Its implementation is quite expensive
Q5) Write about performance budget
A5) Performance budgeting aims at improving the effectiveness and efficiency of public expenditure, by linking the funding of public sector organization to the result they deliver. Performance based budgeting is the allocation of funds based on programmatic results that contribute to organizational goals. It results in optimum utilization of resources such as finance, skills of the staff, use of the productive time etc.
Performance Budget focuses on the “results”. The final outcome is analyzed. Performance budgeting is a motivating tool for the staff.
Steps of PBB
- The organization should create a list of goals which should be clear to each and every employees of the organization. Clear communication of goals results into successful implementation of performance-based budgeting.
2. The next step is the periodic evaluation of the performance to achieve the desired goals of the organization. The organization shall develop a systematic step by step approach for evaluation.
3. The primary focus of the performance budget is the outcome and not the inputs. The organization is going to be accountable for the result or outcomes.
Advantages
- Performance budget helps to increase the accountability.
- Performance budgeting indicates clearly the objective on which the money is going to be spent.
- On a continuous basis it improves the performance of the programs
- In the budget preparation, performance budget helps in bringing the transparency.
Disadvantages
- The performance budget is subjective in nature, it creates disagreement amongst the management
- Staffs may manipulate the data
- It makes difficult to measure the results of the projects in long-term.
Q6) Write about zero based budget
A6) Zero-based budgets
Zero based budgeting has been defined as a planning and budgeting process required by each manager to:
- Establish objectives for his function
- Define alternative ways of achieving the objectives
- Selecting the best alternative so as to achieve these objectives
- Break the alternatives into incremental level of efforts
- Cost and benefit of each incremental level
- Describe the consequence of disapproval
Zero base budgeting is a method of budgeting in which all expense must be justified for each new period. Zero based budgeting starts from a zero base and every function within an organization is analyzed for its need and costs. Budgets are then built around what is needed for the upcoming period, regardless of whether the budget is higher or lower than the previous one.
ZBB is a management accounting involves preparing the budget from the scratch with a zero base.
Steps involved in ZBB
- Identification of decision units
- Analysis of each decision unit through development of decision packages
- Evaluation and ranking of decision packages to develop the budget
- Preparing the budget including those decision packages which have been approved.
Advantages of zero based budgeting
- Inefficient operation is identified
- Allow manager to quickly respond to changes in external environment
- It promotes questioning and challenging attitudes
- It ensures efficient use of limited resources
- It helps management to design and develop cost effective techniques for improving operations
- The corporate objectives can be achieved successfully
Disadvantages of ZBB
- Increased paper work
- Cost of preparing any packages
- Subjective ranking
- More emphasis on short term benefits and qualitative benefits are ignored
- Small organization cannot afford it
Q7) Write about transfer pricing
A7) Transfer pricing
Definition
Transfer pricing can be defined as the value which is attached to the goods or services transferred between related parties. In other words, transfer pricing is the price which is paid for goods or services transferred from one unit of an organization to its other units situated in different countries
Transfer price is defined as ‘The price at which goods or services are transferred from one process or department to another or from one member of a group to another. The extent to which costs and profits are covered by the price is a matter of policy. A transfer price may, for example, be based upon marginal cost, full cost, market price or negotiation.’ – CIMA Official Terminology.
Transfer pricing guidelines for multinational companies are regulated by Organization for Economic Co-operation and Development (OECD). The guidelines are accepted by all tax authorities as its states the rules and regulations on transfer pricing to ensure accuracy and fairness.
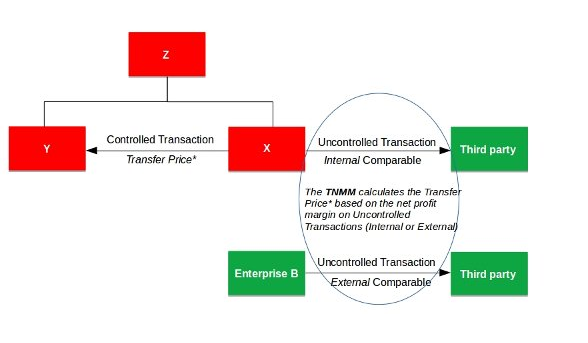
They specify the controlled transaction price made between internally related companies must follow arms length principle. This principle states that a company must charge a similar price for a controlled transaction as an uncontrolled transaction made by a third party. In other words, the transaction amount must be a fair market price.
Transfer pricing methods
The five transfer pricing methods are divided in “traditional transaction methods” and “transactional profit methods.”
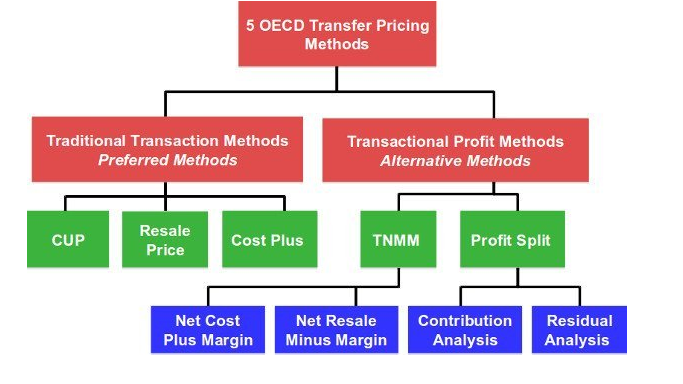
Traditional Transaction Methods
Traditional transaction methods deal with measuring the terms and conditions of actual transactions between independent enterprises and compares the actual transaction with those of a controlled transaction to take corrective actions.
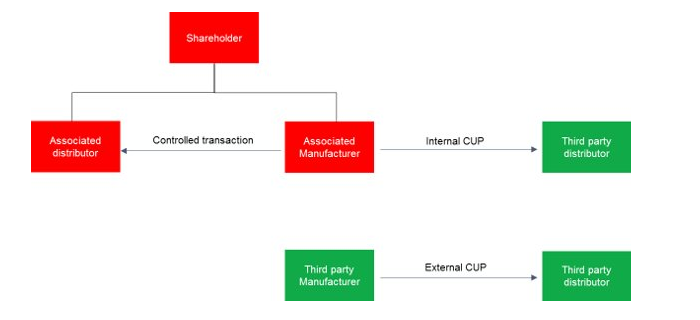
- CUP method - The CUP Method involves comparing the terms and conditions of a controlled transaction to those of a third party transaction. There are two kinds of third party transactions.
- Internal cup - A transaction between the taxpayer and an independent enterprise.
- External cup - A transaction between two independent enterprises.
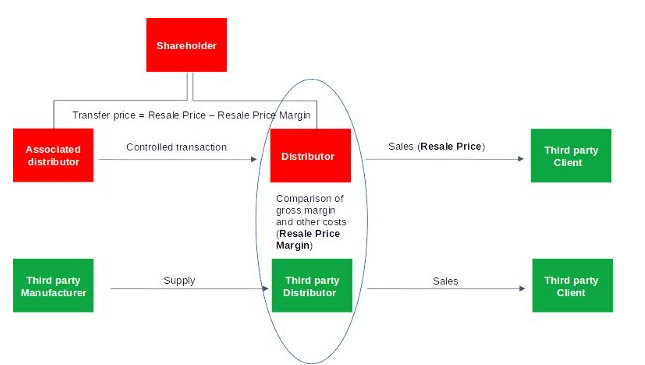
2. Resale price method – it is also known as resale minus method. In this method resale prices refers to the prices at which the associated enterprise sells its product to the third party. The gross margin is calculated by comparing the gross margins in a comparable uncontrolled transaction is then reduced from this resale price. Then the cost like custom duties, etc. associated with the purchase of the product is deducted.
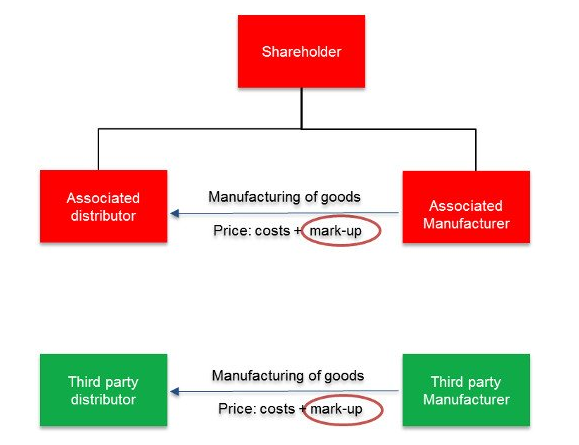
3. The cost plus method – under the cost plus method the gross profits are compared to the cost of sales. It involves the following steps, firstly, evaluate the costs incurred by the supplier in a controlled transaction for products transferred to an associated purchaser. Secondly, to make an appropriate profit in light of the functions performed, an appropriate mark-up has to be added to this cost. The price can be considered at arm’s length after adding markup to these costs. The application of this method requires the identification of a mark-up on costs applied for comparable transactions between independent enterprises.
Transactional profit methods
Transactional profits methods do not measure the terms and conditions of actual transaction. Under this method net operating profits are realized from controlled transactions and profit level are compared with the profit level realized by independent enterprises that are engaged in comparable transactions. The transactional profit method is less precise and more applied than the traditional transactional methods.
- The transactional net margin method – this method determines the net profit of a controlled transaction of an associated enterprise. The net profit determined is compared to the net profit realized by comparable uncontrolled transactions of independent enterprises. It is also called as comparable profit methods. This method is most commonly used and applicable as it requires financial data.
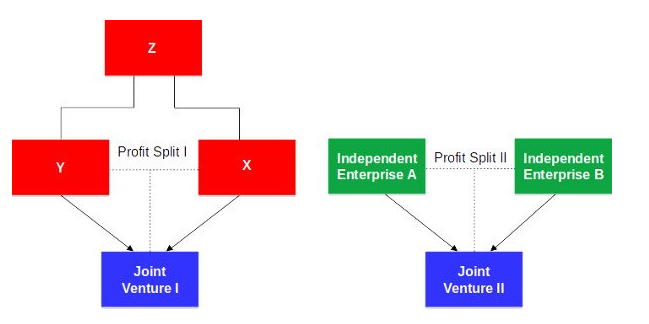
2. Profit split method – the profit split method examines the terms and conditions of interrelated controlled transactions by determining the division of profits those independent enterprises would have realized from engaging in those transactions. It looks the profit in holistic way rather than on a transactional basis. It leads to more accurate assessment of the company’s financial performance.
Q8) Explain the quantitative techniques of cost management
A8) The term Decision Science / Quantitative Techniques (QT) /Operations Research (OR) describes the discipline that is focused on the application of Information Technology (IT) for well-versed decision-making.
Quantitative techniques are those statistical and programming techniques: which support the decision-making process especially related to industry and business. QT takes into consideration the elements of qualities such as use of numbers, symbols and other mathematical expressions.
QT is basically helpful enhancement to judgment and intuition. Quantitative techniques assess planning factors and alternatives as and when they arise rather than suggest courses of action.
Quantitative, techniques may be defined as those techniques which provide the decision maker with a systematic and powerful means of analysis and help, based on quantifiable data, in exploring policies for achieving pre-determined goals. ''Quantitative techniques are mainly appropriate to problems of complex business enterprises".
According to C.R. Kothari:
"Quantitative Techniques may be defined as those technique which provide the decision maker with a systematic and powerful means of analysis and help, based on quantitative in exploring policies for achieving per-determined goals”.
Role of Quantitative Techniques in Decision Making:
The major roles of quantitative technique are as follows:
(i) It provides a tool for scientific analysis.
(ii) It offers solutions for various business problems.
(iii) It enables proper deployment of resources.
(iv) It supports in minimizing waiting and servicing costs.
(v) It helps the management to decide when to buy and what is the procedure of buying.
(vi) It helps in reducing the total processing time necessary for performing a set of jobs.
Characteristics
1) Decision-Making:
Decision-making or problem solving constitutes the major working of operations research: Managerial decision-making is considered to be a general systematic process of operations research (OR).
2) Scientific Approach:
Like any other research, operations research also emphasizes on the overall approach and takes into account all the significant effects of the system. It understands and evaluates them as a whole. It takes a scientific approach towards reasoning. It involves the methods defining the problem, its formulation, testing and analyzing of the results obtained.
3) Objective-Oriented Approach:
Operations Research not only takes the overall view of the problem, but also endeavours to arrive at the best possible (say optimal) solution to the problem in hand. It takes an objective-oriented approach. To achieve this, it is necessary to have a defined measure of effectiveness which is based on the goals of the organization. This measure is then used to make a comparison between alternative solutions to the problem and adopt the best one.
4) Inter-Disciplinary Approach:
No approach can be effective, if taken singly. OR is also inter-disciplinary in nature. Problems are multi-dimensional and approach needs a team work. For example, managerial problems are affected by economic, sociological, biological, psychological, physical and engineering aspect. A team that plans to arrive at a solution, to such a problem, needs people who are specialists in areas such as mathematics, engineering, economics, statistics, management, etc.
Importance of quantitative techniques
1) Better Control:
For large organizations, it is practically impossible to continuously supervise every routine work. A QT approach comes handy and gives an analytical and quantitative basis to identify the problem area. QT approach is most frequently adopted with production scheduling and inventory replenishment.
2) Better Systems:
For example, Problems identifying the best location for factories or decision on whether to open a new warehouse, etc., are often been studied and analyzed by QT approach. This approach helps to improve the existing system such as, selecting economical means of transportation, production scheduling, job sequencing, or replacing old machinery.
3) Better Decisions:
QT models help in improved decision-making and thereby reduce the risk of wrong decisions. QT approach gives the executive an improved insight into the problem and thereby improve decision-making.
4) Better Co-ordination:
QT models help in co-ordination of different or various divisions of an organization.
Application of quantitative techniques
1) Finance, Budgeting and Investment:
- Long range capital requirements, cash flow analysis, investment portfolios and dividend policies.
- Credit policies, credit risks and procedures for delinquent account.
- Procedures to deal with complaints and claim.
2) Marketing:
- Selection of product, its timing and competitive actions.
- Cost and time-based decision for advertising media.
- Rate of calling an account and requirement of number of salesmen, etc.
- Market research effectiveness.
3) Physical Distribution:
- Size of warehouses, distribution centre, retail outlets, etc., and their location.
- Policy for distribution.
4) Purchasing, Procurement and Exploration:
- Buying rules.
- Determining purchase timing and its quantity.
- Policies for bidding and analysis of vendor.
- Replacement policies of equipment.
5) Personnel:
- Manpower requirement forecasting, recruitment policies and assignment of job.
- Suitable personnel selection considering age and skills, etc.
- For each service centre determining the optimum number of persons.
6) Production:
- Proper allocation of machines for scheduling and sequencing the production.
- Optimum product mix calculation.
- Selecting production plant sites along with its location and design.
7) Research and Development:
- Alternative designs evaluation and its reliability.
- Developed projects control.
- Multiple research projects co-ordination.
- Required determination of time and cost.
Q9) Explain Linear programming
A9) Linear programming
Linear programming is a mathematical method that is used to determine the best possible outcome or solution from a given set of parameters or list of requirements, which are represented in the form of linear relationships. It is most often used in computer modeling or simulation in order to find the best solution in allocating finite resources such as money, energy, manpower, machine resources, time, space and many other variables. In most cases, the "best outcome" needed from linear programming is maximum profit or lowest cost.
Linear programming is a mathematical method that is used to determine the best possible outcome or solution from a given set of parameters or list of requirements, which are represented in the form of linear relationships. It is most often used in computer modeling or simulation in order to find the best solution in allocating finite resources such as money, energy, manpower, machine resources, time, space and many other variables. In most cases, the "best outcome" needed from linear programming is maximum profit or lowest cost.
For example, suppose there are 1000 boxes of the same size of 1 cubic meter each; 3 trucks that are able to carry 100 boxes, 70 boxes and 40 boxes respectively; several possible routes; and 48 hours to deliver all the boxes. Linear programming provides the mathematical equations to determine the optimal truck loading and route to be taken in order to meet the requirement of getting all boxes from point A to B with the least amount of going back and forth and, of course, the lowest cost at the fastest time possible
For example, suppose there are 1000 boxes of the same size of 1 cubic meter each; 3 trucks that are able to carry 100 boxes, 70 boxes and 40 boxes respectively; several possible routes; and 48 hours to deliver all the boxes. Linear programming provides the mathematical equations to determine the optimal truck loading and route to be taken in order to meet the requirement of getting all boxes from point A to B with the least amount of going back and forth and, of course, the lowest cost at the fastest time possible
The basic components of linear programming are as follows:
Decision variables - These are the quantities to be determined.
Objective function - This represents how each decision variable would affect the cost, or, simply, the value that needs to be optimized.
Constraints - These represent how each decision variable would use limited amounts of resources.
Data - These quantify the relationships between the objective function and the constraints.
Q10) Explain PERT/CPM
A10) Definition of PERT
PERT is an acronym for Program (Project) Evaluation and Review Technique, in which planning, scheduling, organizing, coordinating and controlling uncertain activities take place. The technique studies and represents the tasks undertaken to complete a project, to identify the least time for completing a task and the minimum time required to complete the whole project. It was developed in the late 1950s. It is aimed to reduce the time and cost of the project.
PERT uses time as a variable which represents the planned resource application along with performance specification. In this technique, first of all, the project is divided into activities and events. After that proper sequence is ascertained, and a network is constructed. After that time needed in each activity is calculated and the critical path (longest path connecting all the events) is determined
Definition of CPM
Developed in the late 1950s, Critical Path Method or CPM is an algorithm used for planning, scheduling, coordination and control of activities in a project. Here, it is assumed that the activity duration is fixed and certain. CPM is used to compute the earliest and latest possible start time for each activity.
The process differentiates the critical and non-critical activities to reduce the time and avoid the queue generation in the process. The reason for the identification of critical activities is that, if any activity is delayed, it will cause the whole process to suffer. That is why it is named as Critical Path Method.
Key Differences Between PERT and CPM
The most important differences between PERT and CPM are provided below:
1. PERT is a project management technique, whereby planning, scheduling, organizing, coordinating and controlling uncertain activities are done. CPM is a statistical technique of project management in which planning, scheduling, organizing, coordination and control of well-defined activities take place.
2. PERT is a technique of planning and control of time. Unlike CPM, which is a method to control costs and time.
3. While PERT is evolved as a research and development project, CPM evolved as a construction project.
4. PERT is set according to events while CPM is aligned towards activities.
5. A deterministic model is used in CPM. Conversely, PERT uses a probabilistic model.
6. There are three times estimates in PERT, i.e., optimistic time (to), most likely time ™, pessimistic time (tp). On the other hand, there is only one estimate in CPM.
7. PERT technique is best suited for a high precision time estimate, whereas CPM is appropriate for a reasonable time estimate.
8. PERT deals with unpredictable activities, but CPM deals with predictable activities.
9. PERT is used where the nature of the job is non-repetitive. In contrast to, CPM involves the job of repetitive nature.
10. There is a demarcation between critical and non-critical activities in CPM, which is not in the case of PERT.
11. PERT is best for research and development projects, but CPM is for non-research projects like construction projects.
12. Crashing is a compression technique applied to CPM, to shorten the project duration, along with the least additional cost. The crashing concept is not applicable to PERT.
Q11) Explain transportation problem
A11) Transportation problem is a special kind of Linear Programming Problem (LPP) in which goods are transported from a set of sources to a set of destinations subject to the supply and demand of the sources and destination respectively such that the total cost of transportation is minimized. It is also sometimes called as Hitchcock problem.
Types of Transportation problems:
Balanced: When both supplies and demands are equal then the problem is said to be a balanced transportation problem.
Unbalanced: When the supply and demand are not equal then it is said to be an unbalanced transportation problem. In this type of problem, either a dummy row or a dummy column is added according to the requirement to make it a balanced problem. Then it can be solved similar to the balanced problem
Q12) Explain assignment problems
A12) The assignment problem deals with allocating various resources (items) to various activities (receivers) on a one to one basis, i.e., the number of operations are to be assigned to an equal number of operators where each operator performs only one operation. For example, suppose an accounts officer has 4 subordinates and 4 tasks. The subordinates differ in efficiency and take different time to perform each task. If one task is to be assigned to one person in such a way that the total person hours are minimized, the problem is called an assignment problem.
An assignment problem may be considered as a special type of transportation problem in which the number of sources and destinations are equal. The capacity of each source as well as the requirement of each destination is taken as 1. In the case of an assignment problem, the given matrix must necessarily be a square matrix which is not the condition for a transportation problem.
Suppose there are n jobs to be performed by n machines/persons, and let the cost if ith person takes jth job be Cij
The problem of assigning jobs to machines/persons on one-on-one basis, so that the total cost of performing all jobs is minimum is called Assignment Problem.
Hungarian Method of Solving an Assignment Problem
The steps for obtaining an optimal solution of an assignment problem are as follows:
1. Check whether the given matrix is square. If not, make it square by adding a suitable number of dummy rows (or columns) with 0 cost/time elements.
2. Locate the smallest cost element in each row of the cost matrix. Subtract the smallest element of each row from every element of that row.
3. In the resulting cost matrix, locate the smallest element in each column and subtract the smallest element of each column from every element of that column.
4. In the resulting matrix, search for an optimum assignment as follows:
i) Examine the rows successively until a row with exactly one zero is found. Draw a rectangle around this zero (as 0) and cross out all other zeroes in the corresponding column. Proceed in this manner until all the rows have been examined. If there is more than one zero in any row, do not touch that row; pass on to the next row.
Ii) Repeat step (i) above for the columns of the resulting cost matrix.
Iii) If a row or column of the reduced matrix contains more than one zeroes, arbitrarily choose a row or column having the minimum number of zeroes. Arbitrarily select any zero in the row or column so chosen. Draw a rectangle around it and cross out all the zeroes in the corresponding row and column. Repeat steps (i), (ii) and (iii) until all the zeroes have either been assigned (by drawing a rectangle around them) or crossed.
Iv) If each row and each column of the resulting matrix has one and only one assigned 0, the optimum assignment is made in the cells corresponding to 0. The optimum solution of the problem is attained and you can stop here. Otherwise, go to the next step.
5. Draw the minimum number of horizontal and/or vertical lines through all the zeroes as follows:
i) Tick mark ( ) the rows in which assignment has not been made.
Ii) Tick mark (  ) columns, which have zeroes in the marked rows.
Iii) Tick mark (  ) rows (not already marked) which have assignments in marked columns.
Then tick mark (  ) columns, which have zeroes in newly marked rows, if any. Tick mark (
  ) rows (not already marked), which have assignments in these newly marked columns.
Iv) Draw straight lines through all unmarked rows and marked columns.
6. Revise the cost matrix as follows:
i) Find the smallest element not covered by any of the lines.
Ii) Subtract this from all the uncovered elements and add it to the elements at the intersection of the two lines.
Iii) Other elements covered by the lines remain unchanged.
7. Repeat the procedure until an optimum solution is attained.
Q13) Explain simulation
A13) The traditional method of crashing Project Evaluation and Review Technique (PERT) networks ignores the stochastic model to a deterministic Critical Path Method (CPM) model and simply using activity time means in calculations. The project is then arbitrarily crashed to some desired completion date, without consideration for what the penalty for late completion of the project is. Additionally, the method ignores the fact that reducing some activity times may reduce the mean project completion time more than others, due to such factors as bottlenecks. The authors use a computer simulation model to determine the order in which activities should be crashed as well as the optimal crashing strategy for a PERT network to minimize the expected value of the total (crash + overrun) cost, given a specified penalty function for late completion of the project. Three extreme network types are examined, each with two different penalty functions.
Formal stochastic simulation study has been recognized as a remedy for the shortcomings inherent to classic critical path method (CPM) project evaluation and review technique (PERT) analysis. An accurate and efficient method of identifying critical activities is essential for conducting PERT simulation. This paper discusses the derivation of a PERT simulation model, which incorporates the discrete event modeling approach and a simplified critical activity identification method. This has been done in an attempt to overcome the limitations and enhance the computing efficiency of classic CPM/PERT analysis. A case study was conducted to validate the developed model and compare it to classic CPM/PERT analysis. The developed model showed marked enhancement in analyzing the risk of project schedule overrun and determination of activity criticality. In addition, the beta distribution and its subjective fitting methods are discussed to complement the PERT simulation model. This new solution to CPM network analysis can provide project management with a convenient tool to assess alternative scenarios based on computer simulation and risk analysis.
Q14) Explain learning curve theory
A14) The learning curve shows an inverse relationship between an average cost of production and the level of output. This means that as firm produces more and more output, its average cost of production declines. Therefore, the learning curve slopes downward from left to right. Following diagram explains the learning curve effect.
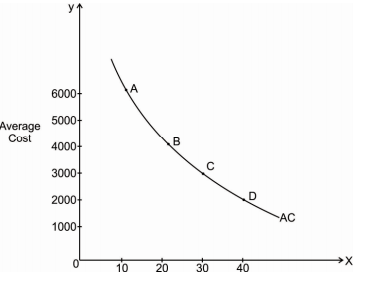
In the above diagram X axis represents total output and Y axis represents the average cost. It shows that average cost is RS.6000 for producing 10 units of output. As output increases to 20, 30 and 40 units, average cost declines to 4000, rs. 3000 and rs. 2000 respectively. Points P, Q, R and S shows different combinations of output and average cost.
Learning curve effect is a result of an experience which the firm gains during the process of production. When the firm is new, it takes time for the firm to produce the output. Thus, the costs are high. As firm becomes older, it learns to use new techniques of production, efficient way of using raw material and skills. Workers also become efficient over a period of time. All this will help to reduce the average cost of production. Firm learn to reduce cost through experience. Therefore, learning curve is also called an Experience curve. The effect of learning curve applies to the manufacturing and service sector.
As shown in the diagram learning curve initially declines faster and then declines at a slower rate. This means that when the production process is new, average cost declines much faster as compared to the old production process