Unit 5
Transmission Lines
Q1) Explain the features of transmission line theory?
A1) Transmission lines are used in power distribution at low frequencies and in communications at high frequencies.
A transmission line consists of two or more parallel conductors used to connect a source to a load., the source can be a generator, a transmitter, or an oscillator and the load may be a factory, an antenna, or an oscilloscope, respectively.
Transmission lines include coaxial cable, two- wire line, parallel plate or planar line, a wire above the conducting plane, and a micro-strip line.
Coaxial cables are used in electrical laboratories and in connecting T.V sets to T.V antennas
Micro-strip lines are important in integrated circuits where metallic strips connecting electronic elements are deposited on dielectric substrates.
Q2) Explain Low loss radio-frequency?
A2) All transmission lines are characterised by conductivity and dielectric losses. When losses are small, some simplifications of transmission line parameters can be made.
The complex propagation is constant is  = √ (R+jwL)(G+jwC) , when the transmission line has low conduction and dielectric losses, we can assume that R<<wL and G<<wC. Using some mathematical simplifications like the Taylor formula, the propagation constant is
  ≈ jw√LC(1-j/2(R/wL + G/wC)
So for y=α + jβ ,α =1/2 (R√C/L + G√L/C), β = w√LC here Zo = √L/C is the characteristic impedance. This approximation is called low-loss high frequency approximation and can be used when losses of the transmission line are low.
Q3) Explain UHF transmission line?
A3) Ultra- High Frequency lines abbreviated as U.H.F lines are one of the types of the transmission lines. Ultra- high frequency lines have operational frequency range from 300 to 3000 MHz or wavelength from 100 cm to 10 cm.
Under normal frequencies the transmission lines are used as wave guides for transferring power and information from one point to another.
At Ultra High Frequencies, the transmission lines can be used as circuit elements like capacitor or inductor. It means they are used in circuits like a capacitor or an inductor.
Q4) Explain quarter wave transformer?
A4) Let us consider TL (with characteristic impedance Zo) where the end is terminated with a resistive that is real load.

Figure . Mismatch
The solution for this is to place a matching network between the line and the load.
 Figure . Matching network
The quarter-wave transformer is simply a transmission line with characteristic impedance Z1 and length l = λ/4 (i.e., a quarter-wave line).

Figure .λ/4 matching network
We know that the input impedance of the quarter wavelength line is:
Zin = (Z1) 2/ ZL = (Z1) 2/ RL
Thus, if we wish for Zin to be numerically equal to Z0 , we find:
Zin = (Z1) 2/ RL = Zo
Solving for Z1 , we find its required value to be:
Z1 = √Zo RL
Therefore, a λ/4 line with characteristic impedance 𝑍1 =  𝑍0𝑅𝐿 will match a transmission line with characteristic impedance Z0 to a resistive load RL
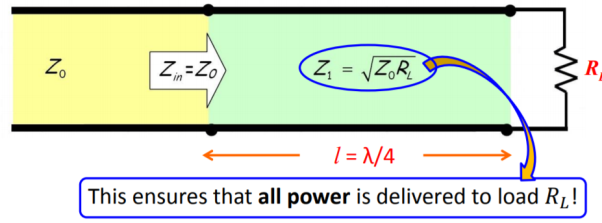
Figure . Power delivered to load.
Q5) What is a smith chart?
A5) The Smith Chart is a tool for visualizing the impedance of a transmission line and antenna system as a function of frequency. Smith Charts can be used to increase understanding of transmission lines and how they behave from an impedance viewpoint.
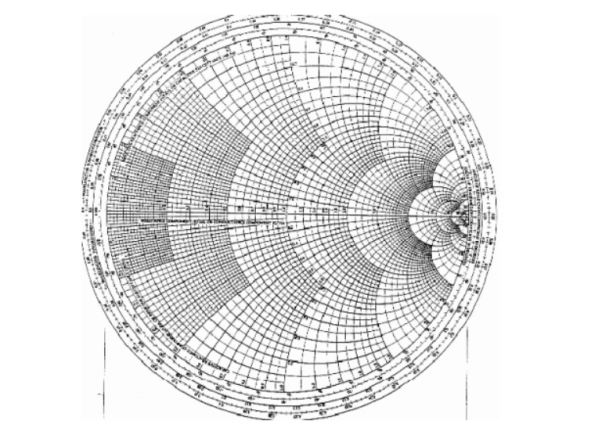
Figure 6. Basic smith chart
The Smith Chart displays the complex reflection coefficient, in polar form, for an arbitrary impedance
Q6) What is complex reflection co-efficient?
A6) The complex reflection coefficient () for an impedance ZL attached to a transmission line with characteristic impedance Z0 is given by
 = ZL – Zo/ ZL +Zo -------------------------------------(1)
Let us assume Z0 is 50 Ohms, which is often. The complex reflection coefficient, or , must have a magnitude between 0 and 1.
As such, the set of all possible values for must lie within the unit circle:
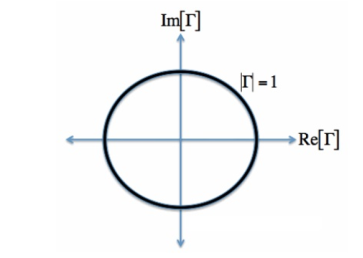
Figure. Complex reflection co-efficient
In Figure, plotting the set of all values for the complex reflection coefficient, along the real and imaginary axis. The center of the Smith Chart is the point where the reflection coefficient is zero. That is, this is the only point on the smith chart where no power is reflected by the load impedance.
The outer ring of the Smith Chart is where the magnitude of is equal to 1. This is the black circle in Figure. Along this curve, all the power is reflected by the load impedance.
Q7) Explain normalized load impedance?
A7) To make the Smith Chart more general and independent of the characteristic impedance Z0 of the transmission line, we will normalize the load impedance ZL by Z0 for all future plots:
ZL = ZL/Zo = 
Equation [1] does not affect the reflection coefficient tow.
Q8) Explain constant resistance circles?
A8) For a given normalized load impedance zL, we can determine and plot it on the Smith Chart. Now, suppose we have the normalized load impedance given by:
z1 = 1 + iY ----------------------------------------------------(2)
In equation [2], Y is any real number.
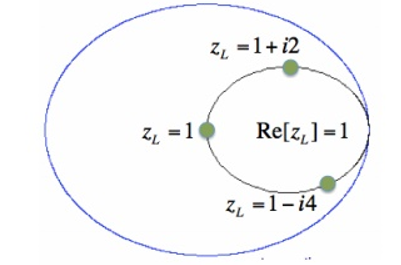
Figure 8. Constant Resistance circle
In Figure , the outer blue ring represents the boundary of the smith chart. The black curve is a constant resistance circle: this is where all values of z1 = 1 + i*Y will lie on.
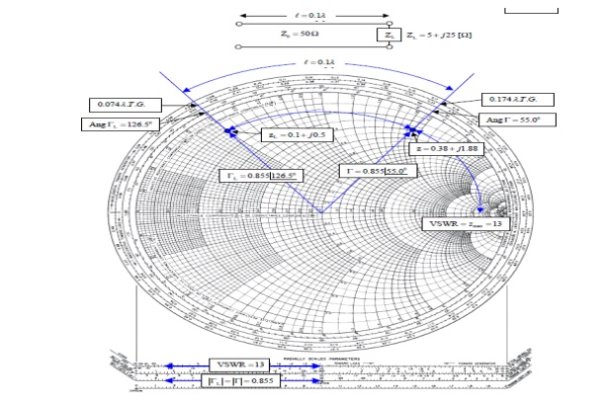
Q9) The 0.1λ length line shown has a characteristic impedance of 50 and is terminated with a load impedance of ZL = 5+j25.
A9) (a) Locate zL = ZL/Z0 = 0.1 + j0.5 on the Smith chart.
(b)What is the impedance at l = 0:1λ?
Since we want to move away from the load i.e., toward the generator, read 0.074 λ on the wavelengths toward generator scale and add l = 0.1 λ to obtain 0.174 λ on the wavelengths toward generator scale.
A radial line from the center of the chart intersects the constant reflection Co-efficient magnitude circle at z = 0.38 + j1.88. Hence Z = zZ0 = 50(0.38 + j1.88) = 19 + 94Ω.
(c) What is the VSWR on the line?
Find VSWR = Zmax = 13 on the horizontal line to the rightof the chart's center. Or use the SWR scale on the chart.
(d) What is ΓL?
From the reflection coefficient scale below the chart,
Find |ΓL| = 0.855. From the angle of reflection coefficient scale on the perimeter of the chart, Find the angle of ΓL=126.5₀.HenceΓL=0.855e j126.5₀.
(e) What is Γ at l = 0.1λ from the load?
Note that |Γ| =|ΓL|=0.855.Read the angle of the reflection coefficient from the angle of reflection coefficient scale as 55.0₀. Hence ΓL=0.855e j126.5₀.
Q10) How are Smith charts useful?
A10) Smith Charts are also extremely helpful for impedance matching. The Smith Chart is used to display a real antenna's impedance when measured on a Vector Network Analyzer (VNA).