Unit-1
Instrumentation and Control
Q1) What is measurement? And state its significance.
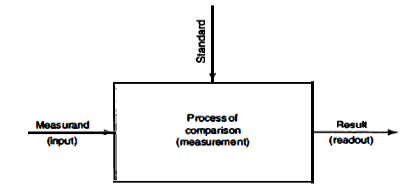
A1) In field of engineering there are several type quantities which need to measured and expressed in day-to-day work. For example physical, chemical, mechanical quantities, etc. Measurement is process of obtaining quantitative comparison between predefined standard and unknown quantity (measurand) (figure 1). Measurand is physical parameter being observed and quantified i.e. input quantity for measuring process. Mechanical measurement means determination measurand related to mechanical measurement. The act of measurement produces result.
|
Significance of measurements
Measurements provide quantitative information of physical variables and processes. Measurement is basis of all research, design and development.
All mechanical design involves three elements: Experience element which depends on engineers experience and common sense. Rational element based on quantitative engineering principles, laws of physics and so on. And experimental element is based on measurements i.e. measurement of performance or operations of device that being design and developed.
Measurement provides comparison between what is desired and what is achieved.
Measurement is fundamental element of any control process. Control process requires measurand between actual and desired performance. Controlling system of control process must know the magnitude and direction of measurand in order to control the process as per desired performance.
Many daily operations require measurement to maintain proper performance. An example is in the central power station. Temperatures, flows, pressures, and vibrational amplitudes must be constantly monitored by measurement to ensure proper performance of the system.
Q2) Explain generalized measuring system .
A2) Generally, most of the measuring system consisting of three stages (Figure 3)
Stage 1: Sensor-transducer stage
Primary function of first stage is to sense the measurand and provide analogues output. At a same time it should be insensitive to every other possible input. For example if it pressure measuring device then it should be insensitive to other inputs like change in temperature or acceleration. If it is linear accelerometer then it should insensitive to angular acceleration and so on. Practically it is impossible to have such selective sensors. Unwanted sensitivity is measuring error known as noise when it varies rapidly and known as drift when it varies slowly.
Stage 2: Signal conditioning stage
The purpose of this stage is to modify the output signal from stage one so it can be suitable for next readout-recording stage. Sometimes output from stage 1 has low magnitude so signal conditioning can also amplify the signal to the level required to drive final terminating device. In addition this stage can also perform filtrations to remove unwanted signal which cause an error in readout-recording stage.
Stage 3: Readout-recording stage
This stage provides indication or recording in form that can be evaluated by human senses or controller. Output can be indicated in two forms
|
Q3) Define.
A3) Range and span:
Range is the region between upper and lower limit within which instrument is design to operate for measuring, indicating, recording a physical quantity. For example, a thermometer has a scale from −40°C to 100°C. Thus the range varies from −40°C to 100°C.
Span is algebraic difference of upper and lower limit. For example, a thermometer, its scale goes from −40°C to 100°C. Thus its span is 140°C.
Linearity:
Normally it is necessary output reading of instrument is linearly proportional to quantity being measured. An instrument is said to be linear if relationship between input and output can be fitted into a line. If it is not linear it should not conclude that instrument is inaccurate.
Loading effect
Change of circuit parameter, characteristic, or behaviour due to instrument operation is known as loading effect.
Resolution
Resolution is defined smallest change in measurand to which instrument will respond. It is also known as discrimination. For example, consider a 500 V voltmeter in which the needle shows a deflection or reading change from zero only when the minimum input is 1 V. This instrument cannot used to measure 50mV because its resolution is 1V. i.e. there will be no effect in instrument for any input less than 1V.
Repeatability
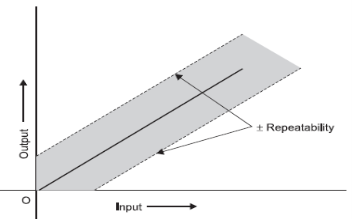
Repeatability provides the closeness with which we can measure a given input value repeatedly. Repeatability is also called as inherent precision of the measurement equipment. If an input of a constant magnitude is applied intermittently, the output reading must be the same, otherwise the instrument is said to have poor repeatability. Figure 2.1 shows the relation between input and output with ± repeatability.
|
Q5) Write a short note on Accuracy.
A5) Accuracy-
Accuracy is closeness with which instrument reading approaches true value of variable under measurement. If the difference between reading and true value is very less then instrument it is said to be having high accuracy i.e. accuracy refers to how closely the measured value is close to its corresponding true value. The manufacturer of the instrument specifies accuracy as the maximum amount of error which will not be exceeded. Therefore, it can be termed as conformity to truth. For example, if accuracy of ±2% is specified for a 100 V voltmeter, the true value of the voltage lies between 98 V and 102 V with maximum error for any observed value or reading not exceeding ± 2V. The accuracy of an instrument can be specified in either of the following ways.
Point accuracy: Point accuracy means accuracy of instrument is only at some particular point on scale. Point accuracy does not give any information regarding general accuracy of an instrument.
Percentage of scale range accuracy: The accuracy of a uniform scale instrument is expressed in terms of scale range. For example, consider a thermometer having a range and accuracy of 500°C and ± 0.5% of scale range, respectively. This implies that for a reading of 500°C, the accuracy is ±0.5%, while for a reading of 40°C, the same accuracy yields a greater error.
|
Percentage of true value accuracy: The accuracy is defined in terms of true value of quantity being measured. Thus errors are proportional to the reading i.e. smaller reading lesser error. This method is best way to specify accuracy of instrument.
Q6) Write a short note on Sensitivity.
A6) Sensitivity-
The ratio of change in output to the change in input of the instrument is known as sensitivity of instrument. For example, consider a voltmeter in which the input voltage  changes by 2 V, then the output reading should also change by 2 V. Therefore, the sensitivity is expressed as
  thus it represent how instrument respond to change in input. The graphical representation of input-output relationship of measurand helps to determine sensitivity of instrument as a slop of calibration curve.
|
Where,


Then
Sensitivity  If calibration curve is straight line then sensitivity is constant over the entire range of instrument as shown in figure 7.
Q7) Write a note on errors in measurement.
A7) Errors can be categorized into different type such as gross errors, systematic errors, absolute and relative errors, random errors.
Gross errors
Gross errors are mainly occurring due to human mistakes like errors reading of measurements or improper handling of instruments or mistake in recording and calculating of measurements. Gross errors cannot completely minimized but they can be control to some extent by implementing following measures,
Systematic errors
These errors occurs due shortcoming in measuring instrument such as defective or worn out part or environmental effect on instrument. These errors are also known as bias. A constant uniform deviation of operation of instrument is known as systematic error. Systematic errors are classified as instrumental error, environmental and observational error.
Instrumental error
Instrumental errors are inherent in measuring instruments, because of their mechanical structure. For example, in the D’Arsonval movement, friction in the bearings of various moving components, irregular spring tensions, stretching of the spring or reduction in tension due to improper handling or overloading of the instrument.
These errors can be avoided by
Environmental error These errors occur due to effect of surrounding environment on instrument such as change in temperature, change in humidity, change pressure, vibrations, and electrostatic or magnetic fields. For example, as surrounding temperature changes elasticity of a moving coil (spring) of an instrument also changes thus, reading results also changes. These errors can be minimized by
Observational error
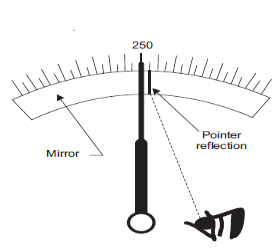
These errors occur due to misleading observations made by observer. The most common observational error is the parallax error occurs while reading a meter scale, and the error of estimation when obtaining a reading from a meter scale. These errors are caused by the habits of individual observers. For example, an observer may always introduce an error by consistently holding his head too far to the left while reading a needle and scale reading as shown in figure 8.
|
When two individual observer reads measurement, they may not be the same due to their different sensing capabilities and therefore, affect the accuracy of the measurement. For example, one observer may note down the reading at a particular time while the other observer may read it too soon causing an error. These errors can be minimized by using digital instrument instead of using deflection type instrument. Also, the parallax errors can be minimized by using instrument having highly accurate meters provided with mirrored scales as the pointer’s image is hidden by the pointer and observer’s eye is directly in line with the pointer.
Absolute and relative errors
Absolute error is defined as amount of physical error in any measurement. It is denoted as  . The unit of physical error is same as unit of quantity being measured. For example a 400 Ω is said to be have possible error of ± 30 Ω. Here ± 30 Ω represent absolute error in terms of same unit ohm (Ω). Mathematically absolute error can be expressed as
Where,
|
Relative error is defined as ratio of absolute error to true value of quantity being measured. It is denoted as . Relative error is also known as fractional error. It is usually expressed in percentage, ratio, parts per thousand, or parts per million relative to the total quantity. Mathematically relative error can expressed as
Percentage relative error (% From equation (1) and (3)
|
Random error
The errors which are occurs due to unknown factors are known as random errors. These type of errors occurs even after gross error or systematic errors are corrected or at least accounted for. For example, suppose a voltage is being observed by a voltmeter and observations are taken after every 20 minutes of intervals. And instrument is being operated under ideal environmental conditions and is accurately calibrated before measurement, it still gives readings that vary slightly over the period of observation. This variation cannot be corrected by any method of calibration or any other known method of control.
Q8) An ammeter reads 6.7 A and the true value of the current is 6.54 A. Determine the absolute error and the correction for this instrument.
A8)
Given that: measured value The absolute error De is given as:
Substituting the given values, we get:
The correction for this ammeter is obtained as: –
|
Q9) The current through a resistor is 2.5 A, but the measurement yields a value of 2.45 A. Calculate the percentage error of measurement.
A9)
Given that: measured value The absolute error De is given as:
Substituting the given values, we get:
Now, the relative error
The percentage error % % = – 0.02 × 100 = – 2%
|
Q10) For the following given data, calculate
(i) Arithmetic mean; (ii) Deviation of each value; (iii) Algebraic sum of the deviations
Given x1 = 49.7; x2 = 50.1; x3 = 50.2; x4 = 49.6; x5 = 49.7
A10) Solution
(i) The arithmetic mean is calculated as follows
(ii) The deviations from each value are given by d1 = x1 – x¯ = 49.7 – 49.86 = – 0.16 d2 = x2 – x¯ = 50.1 – 49.86 = + 0.24 d3 = x3 – x¯ = 50.2 – 49.86 = + 0.34 d4 = x4 – x¯ = 49.6 – 49.86 = – 0.26 d5 = x5 – x¯ = 49.7 – 49.86 = – 0.16 (iii) The algebraic sum of the deviation is
= + 0.58 – 0.58 = 0
|


