Unit-5
System model
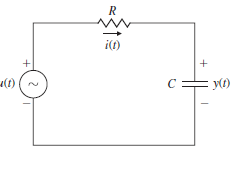
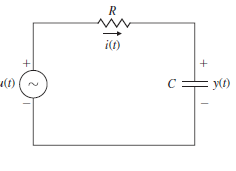
Q1) Compute the transfer function for the RC circuit driven by a voltage source as shown in Figure.
|
A1)
The system equation from Kirchhoff’s voltage law is
If the input voltage is a unit impulse signal
and we take the Laplace transform of both sides of the above equation
then assuming zero initial condition (y(0−) = 0) we find
The output, that is, the inverse Laplace transform of Y(s), is the impulse response
Therefore, the transfer function for this system is
|
Q2) Suppose you have find out .
|
A2) We may write Y(s) in terms of its partial-fraction expansion:
Using the cover-up method, we get
Taking laplace inverse of Y(s)
|
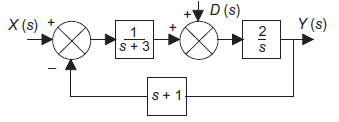
Q3) Determine the output Y(s) of the system shown in Figure when there is an input X(s) to the system as a whole and a disturbance signal D(s) at the point indicated.
|
A3)
If we set D(s) to zero output is given by
If we now set X(s) to zero This is a system with a forward path transfer function of 2/s and a positive feedback of (1/s+3) [-(s+1)]. This gives an output of
The total input is the sum of the outputs due to each of the inputs and so
|
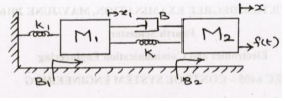
Q4) Write the differential equations governing the mechanical translational system as shown in figure and determine the transfer function
|
A4)
Find equations for M1 and M2
Find Laplace transform equation for above equation
Solve the above equation and find transfer function
|
Q5) The unity feedback system is characterized by an open loop transfer function
G(s)=K/s(s+10)
Determine the gain K, so that the system will have a damping ratio of 0.5. For this value of K, determine settling time, peak overshoot and time to peak overshoot for a unit step input
A5) Given
G(s)=K/s(s+10) H(s)=1 𝜁=0.5 closed loop transfer function
We know
Percentage peak overshoot
Time to peak overshoot
Settling time
|
Q6) A second-order system has a natural angular frequency of 2.0 rad/s and a damped frequency of 1.8 rad/s. What are its
(a) damping factor, (b) 100% rise time, (c) percentage overshoot, (d) 2% settling time and (e) the number of oscillations within the 2% settling time?
A6) we know
The 2% settling time is given by
The number of oscillations occurring within the 2% settling time is given by
|
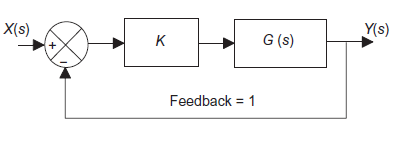
Q7) Determine whether the closed-loop control system described by Figure 10.15 is stable when G(s) = 6/[s(s+2)(s+4)] and K=2.5.
|
A7) For such a system with unit feedback-
|
The poles are thus located at s = -5, s = -0.5+j1.66 and s= -0.5- j1.66. All the poles are in the left half of the s-plane and so the system is stable.
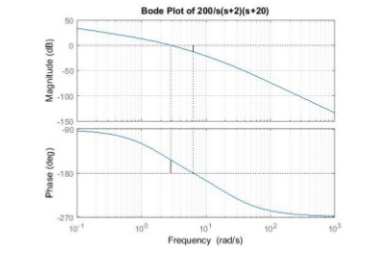
Q8) Sketch the asymptotic Bode plot for system having
G(s) =200/s(s+2)(s+20).
A8)
Step 1: Convert given transfer function into time-constant form
Step 2: Sinusoidal transfer function Replace s with j
Step 3: Identify different parts of bode plot Constant term: K = 5
|
Type of system: I. this means initial slope is -20 dB/dec, and intersection of the Mitial part of the plot with 0 dB axis occurs at Corner frequencies
|
Step 4: Draw reference slopes on top left comer of the semi-log graph paper.
For magnitude plot draw a 0 dB axis line, with positive values above it like 20 dB. 40 dB etc. and negative values below it like -20 dB, 90 dB etc. For phase plot, draw a 180' axis line. Above it the values will be like -150 ,- 120
 , 90
, 90 etc. mid the values below it will be like - 210
 ,-240°, -270
 etc.
etc.
Step 5: Start plotting the magnitude plot by drawing a line with initial slope of - 20 413/dec that intersects the 0 dB axis at 5 rad/s. This slope continues till first corner frequency of 2 rad/s. Since this corner frequency is due to a pole, an additional slope of —20 dB/dec will be added. hence the slope now will be —40 dB/dec. This slope will added till second corner frequency of 20 rad/s. Since the second corner frequency IS also due to a pole, an additional slope of 20 dB/dec will be added, and hence the slope now will be —60 dB/dec. This slope will continue for all the further values of  .
.
Step-6: Phase calculation: Only denominator terms will contribute to phase angle. The expression for phase angle is given by
|
| 0.1 | 1 | 2 | 10 | 20 | 40 |
|
| -93.15 | -119.42 | -140.7 | -195.29 | -219.28 | -240.58 | -270 |
|
Q9) Sketch the Nyquist plot for.
A9)
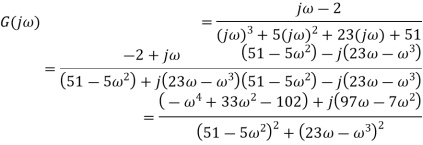
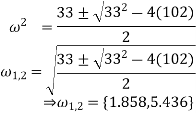
Find intersections with
Therefore the intersections occur at: (−0.04, 0), (0.109, 0) Find intersection(s) with Im − axis (Re{P(j
Therefore the intersections occur at: (0,−0.0562), (0, 0.0551)
|
The Nyquist diagram is:
|
