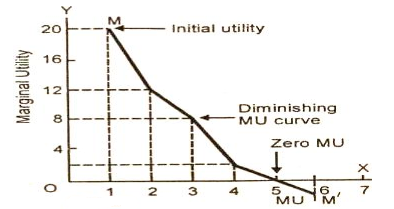
Units | Total utility | Marginal utility |
1st glass | 20 | 20 |
2nd glass | 32 | 12 |
3rd glass | 40 | 8 |
4th glass | 42 | 2 |
5th glass | 42 | 0 |
6th glass | 39 | -3 |
|

|
|
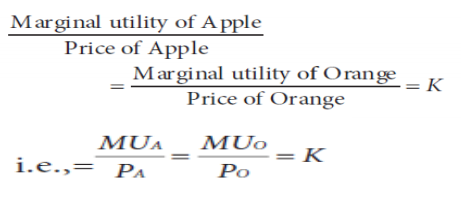
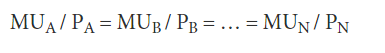
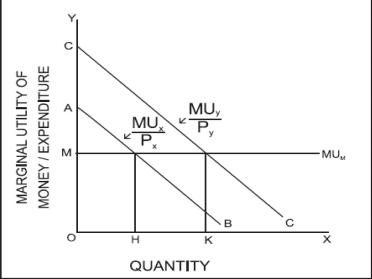
Units | Marginal utility of apple | Marginal utility of orange |
1 | 10 | 8 |
2 | 9 | 7 |
3 | 8 | 6 |
4 | 7 | 5 |
5 | 6 | 4 |
6 | 5 | 3 |
7 | 4 | 2 |
8 | 3 | 1 |
|
|

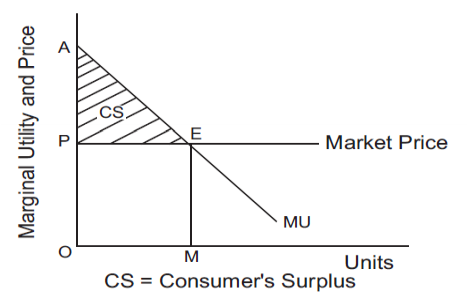
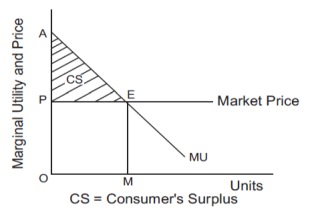
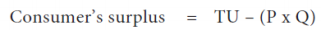
Units of commodity (apple) | Potential price | Actual Price | Consumer surplus |
1 | 6 | 2 | 4 |
2 | 5 | 2 | 3 |
3 | 4 | 2 | 2 |
4 | 3 | 2 | 1 |
5 | 2 | 2 | 0 |
Total | 20 | 10 | 10 |
|

|
|
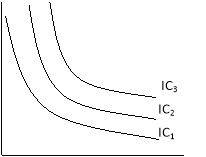
(a) Horizontal Fig.2.4 (b) Vertical Fig.2.4(c) Upward Sloping Indifference Curve Indifference Curve Indifference Curve
|


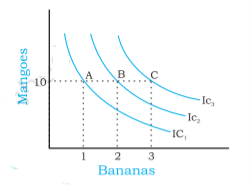
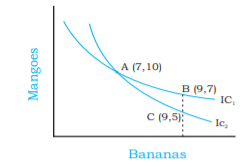
Combination | Quantity of bananas | Quantity mangoes |
A | 1 | 10 |
B | 2 | 10 |
C | 3 | 10 |
|
|

|
|
Units | Total utility | Marginal utility |
1st glass | 20 | 20 |
2nd glass | 32 | 12 |
3rd glass | 40 | 8 |
4th glass | 42 | 2 |
5th glass | 42 | 0 |
6th glass | 39 | -3 |
|
|

|

Units | Marginal utility of apple | Marginal utility of orange |
1 | 10 | 8 |
2 | 9 | 7 |
3 | 8 | 6 |
4 | 7 | 5 |
5 | 6 | 4 |
6 | 5 | 3 |
7 | 4 | 2 |
8 | 3 | 1 |
|


|
|
(a) Horizontal Fig.2.4 (b) Vertical Fig.2.4(c) Upward Sloping Indifference Curve Indifference Curve Indifference Curve
|


Combination | Quantity of bananas | Quantity mangoes |
A | 1 | 10 |
B | 2 | 10 |
C | 3 | 10 |
|

|
|
|

|
Units of commodity (apple) | Potential price | Actual Price | Consumer surplus |
1 | 6 | 2 | 4 |
2 | 5 | 2 | 3 |
3 | 4 | 2 | 2 |
4 | 3 | 2 | 1 |
5 | 2 | 2 | 0 |
Total | 20 | 10 | 10 |
|