Question Bank
Unit 7
- What is use of CAD software in Engineering Drawing?
Answer:
Manufacturing of a product is the main activity in engineering profession. The design of a product may start with trial designs in the form of sketches on paper. As the design improves and undergoes changes, the final form of design must be the scaled manufacturing drawings with finer details included. These drawings are two-dimensional representations of three dimensional objects designed.
During the process of design, the designer may have to carry out a large amount of computations so that an optimum design is obtained. A computer with good graphic capabilities helps the designer to,
(i) realize his ideas.
(ii) carry out complex computations.
(iii) present the results of computations in a useful form for decision making and possible improvement.
(iv) present the improved model for evaluation. Interactive Computer Graphics (ICG) is the tool of the designer.
2. What is Computer aided drawing?
Ans:
A part to be manufactured is defined first in terms of its geometry which also includes dimensions, tolerances, surface finish, and in some cases the type of fit between two mating parts. The two-dimensional representation of a part, called an engineering drawing or a blueprint, shows three orthogonal views of the part. Sometimes, when three views are not enough to define the part, additional sectional views, auxiliary views may have to be added for conveying the right information.
Any design is finally represented in the form of orthographic views and auxiliary views so that production can be carried out. Hence, the computer aided drafting is an important tool for Computer Aided Design. The Computer Aided Drafting (CAD) system is the computerization of technical, production, electronics and architectural drawings.
CAD is the product of computer era. Its development originated from early computer graphics systems. CAD can find its roots to the development of Interactive Computer Graphics (ICG). A system called Sketchpad was developed at Massachusetts Institute of Technology, U.S.A., in 1963 by Ivan Sutherland.
In the beginning, CAD systems were no more than graphics editors with some built-in design symbols. The geometry available to the user was limited to lines, circular arcs, and a combination of the two. The development of free-form curves and surfaces such as Coon's patch, Ferguson's patch, Bezier's curve, and 8-splines enabled a CAD system to be used for more sophisticated work. A 30 CAD system allows a user to do very sophisticated design and analysis work.
Computer aided drawing and drafting system uses the computer to assist in generation of blueprint data. CAD systems are essential in design and many computers-based systems are commercially available. 20 drawing systems correspond directly to traditional engineering drawings, and they are developed to substitute manual drafting.
3. What are the various ways of drawing circles?
Answer: Drawing Circles
The tools in the Circle drop-down on the Draw panel can be used to draw circles. You can also type-in the CIRCLE command in the command line and create circles. There are various methods to create circles. These methods are explained in the following examples.
Example 1(Center, Radius)
In this example, you will create a circle by specifying its center and radius value.
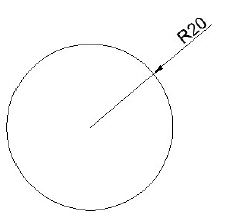
Click Home > Draw > Circle > Center, Radius  on the ribbon.
Select an arbitrary point in the graphics window to specify the center point.
Type 20 as the radius and press ENTER.
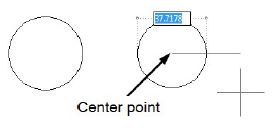
Example 2(Center, Diameter)
In this example, you will create a circle by specifying its center and diameter value.
Click Home > Draw > Circle > Center, Diameter  on the ribbon. The message, “Specify center point for circle or [3P/2P/Ttr (tan tan radius)]:” appears in the command line.
Pick a point in the graphics window, which is approximately horizontal to the previous circle.
Type 40 as the diameter and press ENTER; the circle will be created.
Example 3(2-Point)
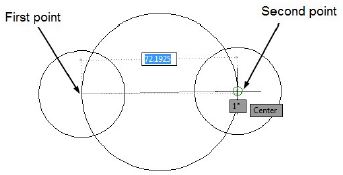
In this example, you will create a circle by specifying two points. The first point is to specify the location of the circle and the second defines the diameter.
Click the down arrow next to the Object Snap  icon on the status bar. A flyout appears. The options in this flyout are called Object Snaps. You will learn about these Object Snaps later in Chapter 3.
Activate the Center option if it is not already active.
Now, you will create a circle by selecting the center points of the previous circles.
Click Home > Draw > Circle > 2-Point on the ribbon. The message, “Specify first end point of circle's diameter:” appears in the command line.
Select the center point of the left side circle; the message, “Specify second end point of circle's diameter:” appears in the command line.
Select the center point of the right-side circle; the circle will be created a shown below.
Example 4(3-Point)
In this example, you will create a circle by specifying three points. The circle will pass through these three points.
Open a new file.
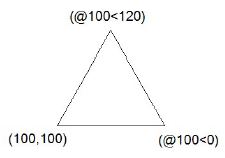
Use the Line tool and create the drawing shown in figure below. The coordinate points are also given in the figure.
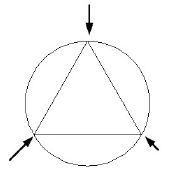
Click Home > Draw > Circle > 3-Point  on the ribbon.
Select the three vertices of the triangle; a circle will be created passing through the selected points.
4. How to Produce drawings by using various coordinate input entry
Methods to draw straight lines.
Answer: Drawing Lines
You can draw a line by specifying its start point and end point using the Line tool. However, there are various methods to specify start and end of a line. These methods are explained in the following examples.
Example 1 (using the Absolute Coordinate System)
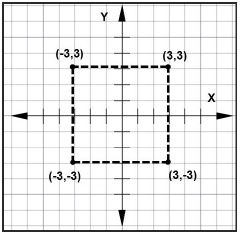
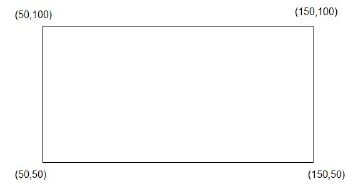
In this example, you will create lines by specifying points in the absolute coordinate system. In this system, you specify the points with respect to the origin (0, 0). A point will be specified by entering its X and Y coordinates separated by a comma, as shown in figure below.
Start AutoCAD 2018 by clicking the AutoCAD 2018 icon on your desktop.
On the Welcome screen, click Start Drawing > Templates > acadISO-Named Plot Styles.dwt. This starts a new drawing using the ISO template.
Click Zoom > Zoom All on the Navigation Bar; the entire area in the graphics window will be displayed.
Turn OFF the Grid Display by pressing the F7 key.
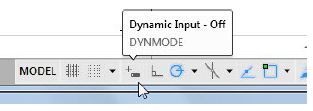
Click the Customization button on the status bar, and then select Dynamic Input from the flyout. This displays the Dynamic Input icon on the status bar.
To draw a line, click Home > Draw > Line on the ribbon, or enter LINE or L in the command line.
Type 50, 50 and press ENTER.
Type 150, 50 and press ENTER.
Type 150,100 and press ENTER.
Type 50,100 and press ENTER.
Select the Close option from the command line. This creates a rectangle, as shown below.
Example 2 (using Relative Coordinate system)
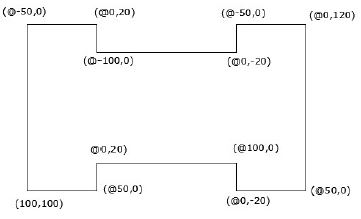
In this example, you will draw lines by defining its end points in the relative coordinate system. In the relative coordinate system, you define the location of a point with respect to the previous point. For this purpose, the symbol, ‘@’ is used before the point coordinates. This symbol means that the coordinate values are defined in relation with the previous point.
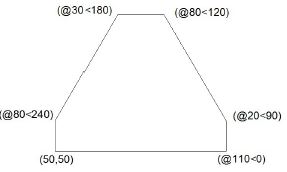
Example 3 (using Polar Coordinate system)
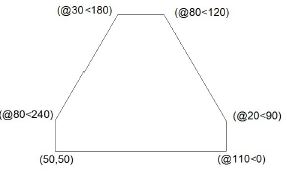
In the polar coordinate system, you define the location of a point by entering two values: distance from the previous point and angle from the zero degrees. You enter the distance value along with the @ symbol and angle value with the < symbol. You must make a note that AutoCAD measures the angle in anti-clockwise direction.
5. Write steps for Customization & CAD Drawing consisting of set up of the
drawing page and the printer.
Answer: Plotting/Printing the drawing
Click the New button.
Select ISOA3. A new drawing will be started with the selected template.
Open the Layer Properties Manager; you will notice that the layers saved in the template file are loaded automatically.
Close the Layer Properties Manager.
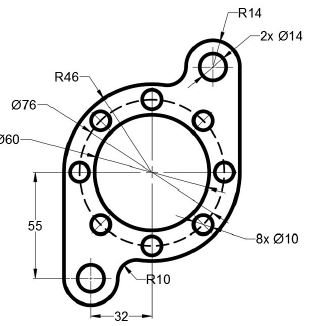
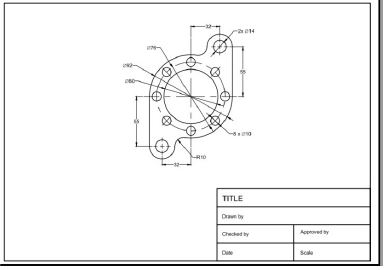
Create a drawing, as shown below. You can also download the drawing from the companion website.
Click the Layout 1 tab to activate the paper space.
Double-click inside the viewport to activate the model space.
Set the Viewport Scale to 1:1 on the status bar.
Use the Pan tool and position the drawing in the center of the view port.
Double-click outside the viewport to activate the paper space.
Hide the viewport frame by freezing the Viewport layer.

Click the Plot button on the Quick Access Toolbar; the Plot dialog appears.

Make sure that the options in this dialog are same as that you specified while creating the template.
Click the Preview button located at the bottom left corner; the preview window appears.
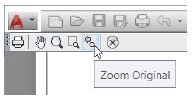
Click the Zoom Original button to fit the drawing to the window.
Examine print preview for the desired output and click the Plot button; the drawing will be plotted.

Save and close the drawing file.
6. Give Method to include scale settings, Setting up of units and drawing limits.
Answer: A scale-drawing must always be prepared from freehand sketches initially prepared from a pictorial view or a real object. In the initial stages of a drawing, always use a soft pencil viz. HB,and work with a light hand, so that lines are thin, faint and easy to erase, if necessary.
1. Determine overall dimensions of the required views. Select a suitable scales that the views are conveniently accommodated in the drawing sheet.
2. Draw rectangles for the views, keeping sufficient space between them and from the borders of the sheet.
3. Draw centre lines in all the views. When a cylindrical part or a hole is a rectangle, draw only one centre line for its axis. When it is a circle draw two centre lines intersecting each other at right angles at its centre.
4. Draw details simultaneously in all the views in the following order:
(i) Circles and arcs of circles.
(ii) Straight lines for the general shape of the subject.
(iii) Straight lines, small curves etc. for minor details.
5. After the views have been completed in all the details, erase all unnecessary lines completely. Make the outlines so faint that only their impressions exist.
6. Fair the views with 2H or 3H pencil, making the outlines uniform and intensely black (but not too thick). For doing this, adopt the same working order as stated in step 4 above.
7. Dimension the views completely. Keep all centre lines.
8. Draw section lines in the view or views which are shown in section.
9. Fill up the title block and furnish all other necessary.
10. Check the drawing carefully and see that it is complete in all respects.
7. Explain ISO and ANSI standards for coordinate dimensioning and Tolerancing.
Answer: There are some fundamental rules that need to be applied (these can be found on page 7 of the 2009 edition of the standard):
- All dimensions must have a tolerance. Every feature on every manufactured part is subject to variation, therefore, the limits of allowable variation must be specified. Plus and minus tolerances may be applied directly to dimensions or applied from a general tolerance block or general note. For basic dimensions, geometric tolerances are indirectly applied in a related Feature Control Frame. The only exceptions are for dimensions marked as minimum, maximum, stock or reference.
- Dimensions define the nominal geometry and allowable variation. Measurement and scaling of the drawing is not allowed except in certain cases.
- Engineering drawings define the requirements of finished (complete) parts. Every dimension and tolerance required to define the finished part shall be shown on the drawing. If additional dimensions would be helpful, but are not required, they may be marked as reference.
- Dimensions should be applied to features and arranged in such a way as to represent the function of the features. Additionally, dimensions should not be subject to more than one interpretation.
- Descriptions of manufacturing methods should be avoided. The geometry should be described without explicitly defining the method of manufacture.
- If certain sizes are required during manufacturing but are not required in the final geometry (due to shrinkage or other causes) they should be marked as non-mandatory.
- All dimension and tolerance should be arranged for maximum readability and should be applied to visible lines in true profiles.
- When geometry is normally controlled by gage sizes or by code (e.g. Stock materials), the dimension(s) shall be included with the Gage or code number in parentheses following or below the dimension.
- Angles of 90° are assumed when lines (including center lines) are shown at right angles, but no angular dimension is explicitly shown. (This also applies to other orthogonal angles of 0°, 180°, 270°, etc.)
- Dimensions and tolerances are valid at 20 °C (68 °F) and 101.3 kPa (14.69 psi) unless stated otherwise.
- Unless explicitly stated, all dimensions and tolerances are only valid when the item is in a free state.
- Dimensions and tolerances apply to the length, width, and depth of a feature including form variation.
- Dimensions and tolerances only apply at the level of the drawing where they are specified. It is not mandatory that they apply at other drawing levels, unless the specifications are repeated on the higher level drawing(s).
8. Write Orthographic constraints,Snap to objects manually and Automatically.
Answer: Using Object Snaps
Object Snaps are important settings that improve your performance and accuracy while creating a drawing. They allow you to select key points of objects while creating a drawing. You can activate the required Object Snap by using the Object snap shortcut menu. Press and hold the SHIFT key and right-click to display this shortcut menu. Note that the object snaps can be used only when a drawing command is active.
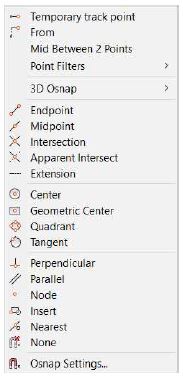
The functions of various Object Snaps are explained next.
Endpoint: Snaps to the endpoints of lines and arcs.
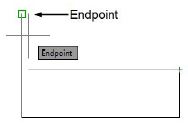
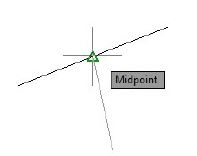
Midpoint: Snaps to the midpoint of a line.
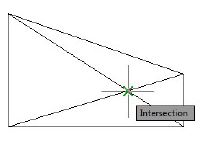
Intersection: Snaps to the intersections of objects.
Extension: Creates a temporary extension line when the pointer passes through the endpoints of a line or an arc. You can pick points along the temporary extension lines.

9. How to Produce drawings by using various coordinate input entry
Methods to draw straight lines?
Drawing Lines
You can draw a line by specifying its start point and end point using the Line tool. However, there are various methods to specify start and end of a line. These methods are explained in the following examples.
Example 1 (using the Absolute Coordinate System)
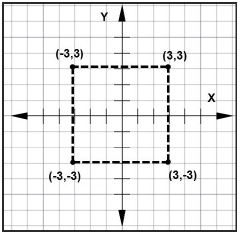
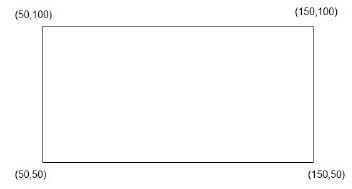
In this example, you will create lines by specifying points in the absolute coordinate system. In this system, you specify the points with respect to the origin (0, 0). A point will be specified by entering its X and Y coordinates separated by a comma, as shown in figure below.
Start AutoCAD 2018 by clicking the AutoCAD 2018 icon on your desktop.
On the Welcome screen, click Start Drawing > Templates > acadISO-Named Plot Styles.dwt. This starts a new drawing using the ISO template.
Click Zoom > Zoom All on the Navigation Bar; the entire area in the graphics window will be displayed.
Turn OFF the Grid Display by pressing the F7 key.
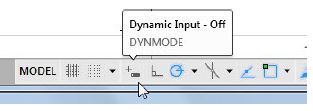
Click the Customization button on the status bar, and then select Dynamic Input from the flyout. This displays the Dynamic Input icon on the status bar.
To draw a line, click Home > Draw > Line on the ribbon, or enter LINE or L in the command line.
Type 50, 50 and press ENTER.
Type 150, 50 and press ENTER.
Type 150,100 and press ENTER.
Type 50,100 and press ENTER.
Select the Close option from the command line. This creates a rectangle, as shown below.
Example 2 (using Relative Coordinate system)
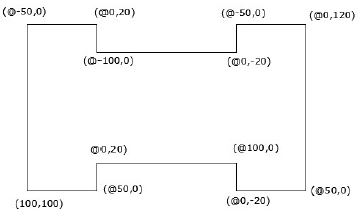
In this example, you will draw lines by defining its end points in the relative coordinate system. In the relative coordinate system, you define the location of a point with respect to the previous point. For this purpose, the symbol, ‘@’ is used before the point coordinates. This symbol means that the coordinate values are defined in relation with the previous point.
Example 3 (using Polar Coordinate system)
In the polar coordinate system, you define the location of a point by entering two values: distance from the previous point and angle from the zero degrees. You enter the distance value along with the @ symbol and angle value with the < symbol. You must make a note that AutoCAD measures the angle in anti-clockwise direction.
