UNIT 1
Introduction
Q1) Explain determinants of demand?
A1) Demand
- Demand refers to desire of a consumer to purchase goods and services and ability to pay a price for the goods and services purchased. No business will produce anything, without consumers demand
- Demand is an important factor for expansion and economic growth.
- For instance, if the price of goods or services increases will lead to decrease in the demand of goods and services by the consumer, and vice versa
Ordinarily, DEMAND means a desire or want for something. In economics, however, demand means much more than that. Economics attach a special meaning to the concept of demand i.e. ‘Demand is the desire or want backed up by money.’ It means effective desire or want for a commodity, which is backed up the purchasing power and willingness to pay for it.
Demand, in economics, means effective demand for a commodity. It requires three conditions on the part of consumer.
Desire for a commodity
Capacity to buy or purchased
Willingness to pay its price.
 In short,
Demand = Desire + Ability to pay + Willingness to spend
Demand is always related to Price & Time. Demand is not the absolute term. It is a relative concept. Demand for a commodity should always have a reference to Price & Time.
 For e.g. – Price Grapes for house hold at a price of Rs. 20/- per Kg., Rs. 10/- per Kg
 Time per day, per month, per year
Definition:
The Demand for a commodity refers to the quantity of a commodity that a person is willing to buy at different prices during period of time.
Key takeaways - Demand describes the way that changes in the quantity of a good or service demanded by consumers affects its price in the market.
Determinants of Demand
They are as follows:
Price of the product:
- Price plays an important factor to make decision if all other factor remains constant.
- Increase in demand follows reduction in price and similarly, decrease in cost of goods and services will increase the demand
Income of consumer
- Income and demand is directly proportional
- When the income rises, the demand for the good and services increases. When the income fall, the demand will decrease simultaneously
Price of related goods and services
- Complementary products – complementary goods are goods that are used together. When the price of a particular item changes, it changes the demand of that item as well as the complement. Example: Increase in the price of car will reduce the demand for petrol.
- Substitute Product –Substitute products are those products which are used for same purpose. Example: Price of tea increases then the demand for coffee increases and the demand for tea decreases.
Consumer Expectations
- When consumer expect value of something will increase , they demand more of it
- For ex, if the vehicle price is expected to increase, people buy more
Number of Buyers in the Market
- The number of buyers plays a major effect on the total demand
As the number of buyer increases, the demand rises and vice versa
Q2) Explain movement in demand curve?
A2) Movement along the demand curve
A change in price causes a movement along the demand curve. It can either be contraction (less demand) or expansion/extension (more demand).
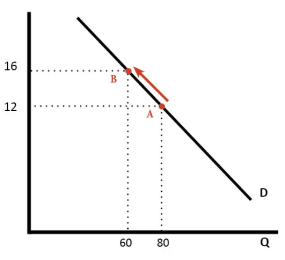
Contraction in demand. An increase in price from rs12 to rs16 causes a movement along the demand curve, and quantity demand falls from 80 to 60. We say this is a contraction in demand
Expansion in demand. A fall in price from rs16 to rs12 leads to an expansion (increase) in demand. As price falls, there is a movement along the demand curve and more is bought.

A change in price doesn’t shift the demand curve – we merely move from one point of the demand curve to another.
Q3) Explain shift in demand curve?
A3) Shift in the demand curve
The shift in demand curve is when, the price of the commodity remains constant, but there is a change in quantity demanded due to some other factors, causing the curve to shift to a particular side.
Change in demand refers to increase or decrease in demand for a product due to various determinants of demand other than price.
- It is measured by shifts in the demand curve.
- The terms, change in demand means to increase or decrease in demand.
Increase and decrease in demand takes place due to changes in other factors, such as change in income, distribution of income, change in consumer’s tastes and preferences, change in the price of related goods. In this case, the price factor remains unchanged.
Increase in demand
Increase in demand refers to the rise in demand for a product at a specific price,
Decrease in demand
Decrease in demand is the fall in demand for a product at a given price.
When other factors change, the demand curve changes its position which is referred to as a shift along the demand curve, which is shown in Figure.

Demand Curve Shift
Demand curve D2 is the original demand curve of commodity X. At price OP2, the demand is OQ2 units of commodity X.
When the consumer’s income decreases owing to high income tax, he is able to purchase only OQ1 unit of commodity X at the same price OP2. Therefore, the demand curve, D2 shifts downwards to D1.
Similarly, when the consumer’s disposable income increases due to a reduction in taxes, they are able to purchase OQ3 units of commodity X at the price OP2. Therefore, the demand curve, D2 shifts upwards to D3. Such changes in the position of the demand curve from its original position are referred to as a shift in the demand curve.
Q4) Explain movements vs, shift in demand curve?
A4) Movement vs shift in demand curve
Movement along the demand curve
A change in price causes a movement along the demand curve. It can either be contraction (less demand) or expansion/extension (more demand).
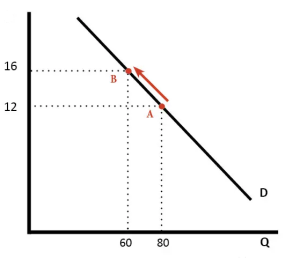
Contraction in demand. An increase in price from rs12 to rs16 causes a movement along the demand curve, and quantity demand falls from 80 to 60. We say this is a contraction in demand
Expansion in demand. A fall in price from rs16 to rs12 leads to an expansion (increase) in demand. As price falls, there is a movement along the demand curve and more is bought.
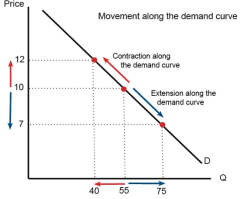
A change in price doesn’t shift the demand curve – we merely move from one point of the demand curve to another.
Shift in the demand curve
The shift in demand curve is when, the price of the commodity remains constant, but there is a change in quantity demanded due to some other factors, causing the curve to shift to a particular side.
Change in demand refers to increase or decrease in demand for a product due to various determinants of demand other than price.
- It is measured by shifts in the demand curve.
- The terms, change in demand means to increase or decrease in demand.
Increase and decrease in demand takes place due to changes in other factors, such as change in income, distribution of income, change in consumer’s tastes and preferences, change in the price of related goods. In this case, the price factor remains unchanged.
Increase in demand
Increase in demand refers to the rise in demand for a product at a specific price,
Decrease in demand
Decrease in demand is the fall in demand for a product at a given price.
When other factors change, the demand curve changes its position which is referred to as a shift along the demand curve, which is shown in Figure.

Demand Curve Shift
Demand curve D2 is the original demand curve of commodity X. At price OP2, the demand is OQ2 units of commodity X.
When the consumer’s income decreases owing to high income tax, he is able to purchase only OQ1 unit of commodity X at the same price OP2. Therefore, the demand curve, D2 shifts downwards to D1.
Similarly, when the consumer’s disposable income increases due to a reduction in taxes, they are able to purchase OQ3 units of commodity X at the price OP2. Therefore, the demand curve, D2 shifts upwards to D3. Such changes in the position of the demand curve from its original position are referred to as a shift in the demand curve.
Key Differences Between Movement and Shift in Demand Curve
- When the commodity experience change in both the quantity demanded and price, causing the curve to move in a specific direction, it is known as movement in demand curve. On the other hand, When, the price of the commodity remains constant but there is a change in quantity demanded due to some other factors, causing the curve to shift in a particular side, it is known as shift in demand curve.
- Movement in demand curve, occurs along the curve, whereas, the shift in demand curve changes its position due to the change in the original demand relationship.
- Movement along a demand curve takes place when the changes in quantity demanded are associated with the changes in the price of the commodity. On the contrary, a shift in demand curve occurs due to the changes in the determinants other than price i.e. things that determine buyer’s demand for a good rather than good’s price such as Income, Taste, Expectation, Population, Price of related goods, etc.
- Movement along demand curve is an indicator of overall change in the quantity demanded. As against this, a shift in the demand curve represents a change in the demand for the commodity.
- Movement of the demand curve can either be upward or downward, wherein the upward movement shows a contraction in demand, while downward movement shows expansion in demand. Unlike, shift in the demand curve, can either be rightward or leftward. A rightward shift in the demand curve shows an increase in the demand, whereas a leftward shift indicates a decrease in demand.
Q5) Explain determinants of supply?
A5) Supply is the willingness and ability of producers to produce goods and services and make it available to the consumers. The total amount of goods and services available for purchases at any specific price.
Definition: Supply is an economic term that refers to the amount of a given product or service that suppliers are willing to offer to consumers at a given price level at a given period.
Determinants
- Price of the product - The major determinants of the supply of a product is its price. Other factors remains the same, an increase in the price of a product increases its supply and vice versa. Producer expects increase profits so they increase the supply of product at higher price.
2. Cost of production - Cost of production and supply are inversely proportional to each other. This implies that suppliers do not supply products in the market when the cost of manufacturing is more than their market price.
3. Natural conditions – certain products supply is directly influenced by climatic conditions. For example, the supply of agricultural products increases when the monsoon comes well on time.
4. Transportation conditions - Better transport facilities result in an increase in the supply of goods. Transport is always a constraint to the supply of goods. This is because due to poor transport facilities goods are not available on time.
5. Taxation policies - Government’s tax policies also act as a regulating force in supply. The supply will decrease if the rates of taxes levied on goods are high. This is because overall productions costs are increased by high tax rate, which will make it difficult for suppliers to offer products in the market.
6. Production technique - The supply of goods also depends on the type of techniques used for production. Obsolete techniques result in low production, which further decreases the supply of goods.
7. Price of related goods - The prices of substitutes and complementary goods also determines the supply of a product to a large extent.
For example, if the price of tea increases, farmers would tend to grow more tea than coffee. This would decrease the supply of tea in the market.
Q6) Explain determinants of demand and supply?
A6) Demand
- Demand refers to desire of a consumer to purchase goods and services and ability to pay a price for the goods and services purchased. No business will produce anything, without consumers demand
- Demand is an important factor for expansion and economic growth.
- For instance, if the price of goods or services increases will lead to decrease in the demand of goods and services by the consumer, and vice versa
Ordinarily, DEMAND means a desire or want for something. In economics, however, demand means much more than that. Economics attach a special meaning to the concept of demand i.e. ‘Demand is the desire or want backed up by money.’ It means effective desire or want for a commodity, which is backed up the purchasing power and willingness to pay for it.
Demand, in economics, means effective demand for a commodity. It requires three conditions on the part of consumer.
Desire for a commodity
Capacity to buy or purchased
Willingness to pay its price.
 In short,
Demand = Desire + Ability to pay + Willingness to spend
Demand is always related to Price & Time. Demand is not the absolute term. It is a relative concept. Demand for a commodity should always have a reference to Price & Time.
 For e.g. – Price Grapes for house hold at a price of Rs. 20/- per Kg., Rs. 10/- per Kg
 Time per day, per month, per year
Definition:
The Demand for a commodity refers to the quantity of a commodity that a person is willing to buy at different prices during period of time.
Key takeaways - Demand describes the way that changes in the quantity of a good or service demanded by consumers affects its price in the market.
Determinants of Demand
They are as follows:
Price of the product:
- Price plays an important factor to make decision if all other factor remains constant.
- Increase in demand follows reduction in price and similarly, decrease in cost of goods and services will increase the demand
Income of consumer
- Income and demand is directly proportional
- When the income rises, the demand for the good and services increases. When the income fall, the demand will decrease simultaneously
Price of related goods and services
- Complementary products – complementary goods are goods that are used together. When the price of a particular item changes, it changes the demand of that item as well as the complement. Example: Increase in the price of car will reduce the demand for petrol.
- Substitute Product –Substitute products are those products which are used for same purpose. Example: Price of tea increases then the demand for coffee increases and the demand for tea decreases.
Consumer Expectations
- When consumer expect value of something will increase , they demand more of it
- For ex, if the vehicle price is expected to increase, people buy more
Number of Buyers in the Market
- The number of buyers plays a major effect on the total demand
- As the number of buyer increases, the demand rises and vice versa
Supply is the willingness and ability of producers to produce goods and services and make it available to the consumers. The total amount of goods and services available for purchases at any specific price.
Definition: Supply is an economic term that refers to the amount of a given product or service that suppliers are willing to offer to consumers at a given price level at a given period.
Determinants
- Price of the product - The major determinants of the supply of a product is its price. Other factors remains the same, an increase in the price of a product increases its supply and vice versa. Producer expects increase profits so they increase the supply of product at higher price.
2. Cost of production - Cost of production and supply are inversely proportional to each other. This implies that suppliers do not supply products in the market when the cost of manufacturing is more than their market price.
3. Natural conditions – certain products supply is directly influenced by climatic conditions. For example, the supply of agricultural products increases when the monsoon comes well on time.
4. Transportation conditions - Better transport facilities result in an increase in the supply of goods. Transport is always a constraint to the supply of goods. This is because due to poor transport facilities goods are not available on time.
5. Taxation policies - Government’s tax policies also act as a regulating force in supply. The supply will decrease if the rates of taxes levied on goods are high. This is because overall productions costs are increased by high tax rate, which will make it difficult for suppliers to offer products in the market.
6. Production technique - The supply of goods also depends on the type of techniques used for production. Obsolete techniques result in low production, which further decreases the supply of goods.
7. Price of related goods - The prices of substitutes and complementary goods also determines the supply of a product to a large extent.
For example, if the price of tea increases, farmers would tend to grow more tea than coffee. This would decrease the supply of tea in the market.
Q7) Explain elasticity of demand?
A7) Elasticity of demand
Under law of demand, price falls and demand rises, vice versa. But how much the quantity rise or fall for a given change in price is not determined in law of demand. So the concept of elasticity of demand is derived to know how much quantity demanded changes for a change in the price of goods or services.
“The elasticity (or responsiveness) of demand in a market is great or small according as the amount demanded increases much or little for a given fall in price, and diminishes much or little for a given rise in price”. – Dr. Marshall.
Elasticity means sensitivity of demand to the change in price.
The formula for calculating elasticity of demand is:
EP = proportional changes in quantity demanded/proportional changes in price
Types of elasticity of demand
Elasticity of demand is of following types

Price of elasticity of demand –
- The price of elasticity demand is the change in the quantity demanded to the change in the price of the commodity
- Formula –
- Ep = percentage change in quantity demanded/percentage change in price
There are 5 types of price elasticity of demand given below
- Perfectly elastic demand
- A small change in price results to major change in demand is said to be perfectly elastic demand
- The demand curve in perfectly elastic demand represent horizontal straight line
- Ep = infinity
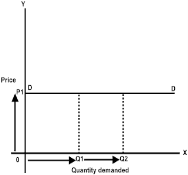
From the above figure, we can see at price P1 consumers are ready to buy as much quantity as they want. A slight increase in price may result to fall in demand to zero.
2. Perfectly inelastic demand
- When there is no change in the demand of the commodity with the change in price is said to be perfectly inelastic demand
- The demand curve in perfectly elastic demand represent Vertical straight line
- Ep = zero


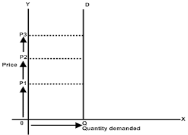
From the above fig, we can see that price is rising from P1 to P2 to P3, but there is no change in the demand. This cannot happen in practical situation. But, in essential goods such as salt, with the change in price the demand does not change.
3. Relatively elastic demand
- When the proportionate change in demand is greater than the proportionate change in price of a product
- The value ranges between one to infinity (ep>1)
- Ex – a smaller change in flight price result in more demand for booking the flight tickets
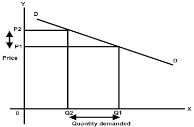

- From the above figure, it is observed that the percentage change in demand from Q2 to Q1 is larger than the percentage change in price from P2 to P1. Thus the demand curve is gradually sloping downwards
4. Relatively inelastic demand
- When the percentage change in demand is less than the percentage change in price
- The value ranges between zero to one (ep<1)
- Ex – cloths, drinks, food, oil , as the change in price does not affect the quantity demanded.

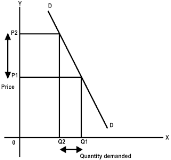
- From the above figure, it is interpreted that the proportionate change in demand from Q2 to Q1 is less than the proportionate change in price from P2 to P1. Thus the demand cure rapidly sloping down.
5. Unitary elastic demand
- When the percentage change in quantity demanded in equal to the percentage change in price of the commodity
- The value is equal to one (ep=1)
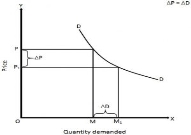
In the above figure we can observe that proportionate change in price from P to P1 cause the same proportionate change in price from M to M1
Income elasticity demand
The income elasticity is measures the sensitivity of quantity demanded for a goods or services to a change in consumer’s income
 Formula - Percentage change in the quantity demanded
Percentage change in the consumer’s income
Cross elasticity
“The cross elasticity of demand is the proportional change in the quantity of X good demanded resulting from a given relative change in the price of a related good Y” Ferguson
It measures the percentage change in the quantity demanded of commodity X to the percentage change in the price of its substitute/complement Y
 Formula – proportionate change in quantity demanded of X
Proportionate change in the price of Y
Q8) Explain price elasticity of demand.
A8) Price of elasticity of demand –
- The price of elasticity demand is the change in the quantity demanded to the change in the price of the commodity
- Formula –
- Ep = percentage change in quantity demanded/percentage change in price
There are 5 types of price elasticity of demand given below
1. Perfectly elastic demand
- A small change in price results to major change in demand is said to be perfectly elastic demand
- The demand curve in perfectly elastic demand represent horizontal straight line
- Ep = infinity
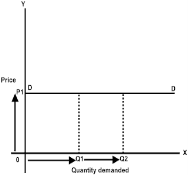
From the above figure, we can see at price P1 consumers are ready to buy as much quantity as they want. A slight increase in price may result to fall in demand to zero.
2. Perfectly inelastic demand
- When there is no change in the demand of the commodity with the change in price is said to be perfectly inelastic demand
- The demand curve in perfectly elastic demand represent Vertical straight line
- Ep = zero


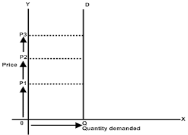
From the above fig, we can see that price is rising from P1 to P2 to P3, but there is no change in the demand. This cannot happen in practical situation. But, in essential goods such as salt, with the change in price the demand does not change.
3. Relatively elastic demand
- When the proportionate change in demand is greater than the proportionate change in price of a product
- The value ranges between one to infinity (ep>1)
- Ex – a smaller change in flight price result in more demand for booking the flight tickets
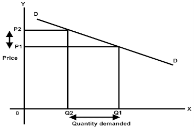

- From the above figure, it is observed that the percentage change in demand from Q2 to Q1 is larger than the percentage change in price from P2 to P1. Thus the demand curve is gradually sloping downwards
4. Relatively inelastic demand
- When the percentage change in demand is less than the percentage change in price
- The value ranges between zero to one (ep<1)
- Ex – cloths, drinks, food, oil , as the change in price does not affect the quantity demanded.

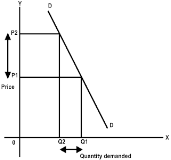
d. From the above figure, it is interpreted that the proportionate change in demand from Q2 to Q1 is less than the proportionate change in price from P2 to P1. Thus the demand cure rapidly sloping down.
5. Unitary elastic demand
- When the percentage change in quantity demanded in equal to the percentage change in price of the commodity
- The value is equal to one (ep=1)
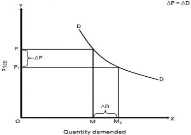
In the above figure we can observe that proportionate change in price from P to P1 cause the same proportionate change in price from M to M1
Q9) Explain elasticity of supply?
A9) The law of supply indicates the direction of change—if price goes up, supply will increase. But how much supply will rise in response to an increase in price cannot be known from the law of supply. To quantify such change we require the concept of elasticity of supply that measures the extent of quantities supplied in response to a change in price.
Elasticity of supply measures the degree of responsiveness of quantity supplied to a change in own price of the commodity. It is also defined as the percentage change in quantity supplied divided by percentage change in price.
It can be calculated by using the following formula:
ES = % change in quantity supplied/% change in price
Types of Elasticity of Supply:
(a) Elastic Supply (ES>1):
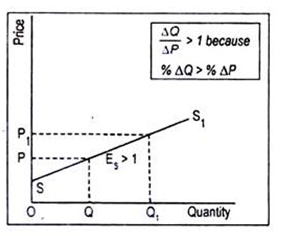
Supply is said to be elastic when a given percentage change in price leads to a larger change in quantity supplied. Under this situation, the numerical value of Es will be greater than one but less than infinity. SS1 curve of Fig. Exhibits elastic supply. Here quantity supplied changes by a larger magnitude than does price.
(b) Inelastic Supply (ES< 1):
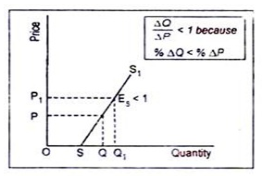
Supply is said to be inelastic when a given percentage change in price causes a smaller change in quantity supplied. Here the numerical value of elasticity of supply is greater than zero but less than one. Fig. Depicts inelastic supply curve where quantity supplied changes by a smaller percentage than does price.
(c) Unit Elasticity of Supply (ES = 1):
If price and quantity supplied change by the same magnitude, then we have unit elasticity of supply. Any straight line supply Curve passing through the origin, such as the one shown in Fig., has an elasticity of supply equal to 1. This can be verified in this way.
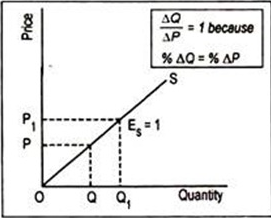
(d) Perfectly Elastic Supply (ES = ∞):
The numerical value of elasticity of supply, in exceptional cases, may reach up to infinity. The supply curve PS1 drawn in Fig. Has an elasticity of supply equal to infinity. Here the supply curve has been drawn parallel to the horizontal axis. The economic interpretation of this supply curve is that an unlimited quantity will be offered for sale at the price OS. If price slightly drops down below OS, nothing will be supplied.

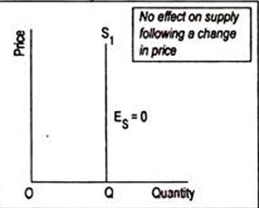
(e) Perfectly Inelastic Supply (ES = 0):
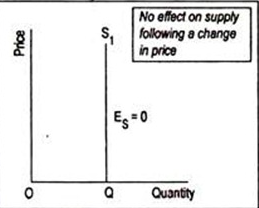
Another extreme is the completely or perfectly inelastic supply or zero elasticity. SS1 curve drawn in Figillustrates the case of zero elasticity. This curve describes that whatever the price of the commodity, it may even be zero, quantity supplied remains unchanged at OQ. This sort of supply curve is conceived when we consider the supply curve of land from the viewpoint of a country, or the world as a whole.
Q10) Explain application of demand and supply?
A10) Practical application of elasticity of demand
- Taxation –
- Price elasticity of demand is used by the government while planning taxes
- High rate of tax is imposed on products for which demand is inelastic.
- Government to earn more revenue imposes taxes on necessities of life.
- Whereas under elastic demand, government will earn less revenue as increase in price will lead to decrease in demand.
2. Monopoly prices
- Monopolist consider the demand of consumer to fix the price
- Business man will fix the price at low when the demand is elastic
- Whereas the price will be high when the demand is inelastic
3. Price discrimination
- It means different consumers are charged different prices for the same product
- For instance, electricity for domestic consumer is charged more than industrial purpose. As electricity for industrial purpose can be replaced from other fuel. Thus the demand for electricity for domestic user is inelastic
4. Wages
- Wages are influenced by elasticity of demand
- In case of inelastic demand, the trade union succeed in raising the wages for the service of labor, but not in case of elastic demand
5. Joint products
- Prices are not determined separately for joint product
- Eg – cotton fiber and cotton seeds
- Elasticity of demand is applied to determine their individual prices
6. Economic policies
- Elasticity of demand helps in formation of economic policies
- It helps in devaluing the currency to increase revenue
- Under elastic demand, there will be increase in volume sold after devaluation. On the contrary, if the demand is inelastic there will be no change in volume sold after devaluation
7. Effects in revenue
- The concept helps in determining equilibrium of a firm
- A firm reaches equilibrium when the revenue is equal to cost price
- Elasticity of demand helps in determing the price to earn more revenue
Application of supply
Supply Analysis is a research and analysis done to understand the supply trends and responses to changing market and production variables. Supply Analysis takes into account the production costs, raw material costs, technology, labour wages etc. The analysis helps the manufacturers and companies to understand the impact of these variables on supply and eventually demand.
The goal of demand-supply chain is to make sure that the supply and demand work properly. The demand should be met and supply should not be more than what expected. There are lot of variables which are considered in demand analysis and supply analysis.
Supply Analysis helps manufacturers to analyse the impact of production changes, policies on increase or decrease in supply of finished goods. e.g. Newer upcoming technology can help produce more goods in same amount of time. The analysis can help determine if this new technology should be adopted or not. Also if this technology can help produce more, is the demand there for more products. What impact will it have on the current labour and how would be it impact supply in the market.
Another example can be impact of increase in wages in the market on supply. The labour cost would go up and it will drive the costs of product along with it. If the supply has to be kept constant, the costs would go up and if costs have to be kept constant the supply would go down hence driving the prices up if the demand is unchanged. These are some questions which the supply analysis tries to answer.
Q11) Explain application of price elasticity of demand?
A11) Practical application of elasticity of demand
- Taxation –
- Price elasticity of demand is used by the government while planning taxes
- High rate of tax is imposed on products for which demand is inelastic.
- Government to earn more revenue imposes taxes on necessities of life.
- Whereas under elastic demand, government will earn less revenue as increase in price will lead to decrease in demand.
2. Monopoly prices
- Monopolist consider the demand of consumer to fix the price
- Business man will fix the price at low when the demand is elastic
- Whereas the price will be high when the demand is inelastic
3. Price discrimination
- It means different consumers are charged different prices for the same product
- For instance, electricity for domestic consumer is charged more than industrial purpose. As electricity for industrial purpose can be replaced from other fuel. Thus the demand for electricity for domestic user is inelastic
4. Wages
- Wages are influenced by elasticity of demand
- In case of inelastic demand, the trade union succeed in raising the wages for the service of labor, but not in case of elastic demand
5. Joint products
- Prices are not determined separately for joint product
- Eg – cotton fiber and cotton seeds
- Elasticity of demand is applied to determine their individual prices
6. Economic policies
- Elasticity of demand helps in formation of economic policies
- It helps in devaluing the currency to increase revenue
- Under elastic demand, there will be increase in volume sold after devaluation. On the contrary, if the demand is inelastic there will be no change in volume sold after devaluation
7. Effects in revenue
- The concept helps in determining equilibrium of a firm
- A firm reaches equilibrium when the revenue is equal to cost price
- Elasticity of demand helps in determing the price to earn more revenue
Q12) Explain demand with determinants of demand?
A12) Demand
- Demand refers to desire of a consumer to purchase goods and services and ability to pay a price for the goods and services purchased. No business will produce anything, without consumers demand
- Demand is an important factor for expansion and economic growth.
- For instance, if the price of goods or services increases will lead to decrease in the demand of goods and services by the consumer, and vice versa
Ordinarily, DEMAND means a desire or want for something. In economics, however, demand means much more than that. Economics attach a special meaning to the concept of demand i.e. ‘Demand is the desire or want backed up by money.’ It means effective desire or want for a commodity, which is backed up the purchasing power and willingness to pay for it.
Demand, in economics, means effective demand for a commodity. It requires three conditions on the part of consumer.
Desire for a commodity
Capacity to buy or purchased
Willingness to pay its price.
 In short,
Demand = Desire + Ability to pay + Willingness to spend
Demand is always related to Price & Time. Demand is not the absolute term. It is a relative concept. Demand for a commodity should always have a reference to Price & Time.
 For e.g. – Price Grapes for house hold at a price of Rs. 20/- per Kg., Rs. 10/- per Kg
 Time per day, per month, per year
Definition:
The Demand for a commodity refers to the quantity of a commodity that a person is willing to buy at different prices during period of time.
Key takeaways - Demand describes the way that changes in the quantity of a good or service demanded by consumers affects its price in the market.
Determinants of Demand
They are as follows:
Price of the product:
- Price plays an important factor to make decision if all other factor remains constant.
- Increase in demand follows reduction in price and similarly, decrease in cost of goods and services will increase the demand
Income of consumer
- Income and demand is directly proportional
- When the income rises, the demand for the good and services increases. When the income fall, the demand will decrease simultaneously
Price of related goods and services
- Complementary products – complementary goods are goods that are used together. When the price of a particular item changes, it changes the demand of that item as well as the complement. Example: Increase in the price of car will reduce the demand for petrol.
- Substitute Product –Substitute products are those products which are used for same purpose. Example: Price of tea increases then the demand for coffee increases and the demand for tea decreases.
Consumer Expectations
- When consumer expect value of something will increase , they demand more of it
- For ex, if the vehicle price is expected to increase, people buy more
Number of Buyers in the Market
- The number of buyers plays a major effect on the total demand
- As the number of buyer increases, the demand rises and vice versa
Key takeaways - The determinants of demand are factors that cause fluctuations in the economic demand for a product or a service.
Q13) Explain types of price elasticity of demand?
A13) Price of elasticity of demand –
- The price of elasticity demand is the change in the quantity demanded to the change in the price of the commodity
- Formula –
- Ep = percentage change in quantity demanded/percentage change in price
There are 5 types of price elasticity of demand given below
- Perfectly elastic demand
- A small change in price results to major change in demand is said to be perfectly elastic demand
- The demand curve in perfectly elastic demand represent horizontal straight line
- Ep = infinity
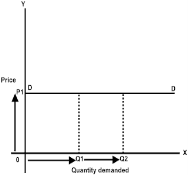
From the above figure, we can see at price P1 consumers are ready to buy as much quantity as they want. A slight increase in price may result to fall in demand to zero.
2. Perfectly inelastic demand
- When there is no change in the demand of the commodity with the change in price is said to be perfectly inelastic demand
- The demand curve in perfectly elastic demand represent Vertical straight line
- Ep = zero


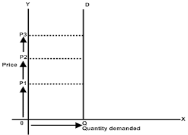
From the above fig, we can see that price is rising from P1 to P2 to P3, but there is no change in the demand. This cannot happen in practical situation. But, in essential goods such as salt, with the change in price the demand does not change.
3. Relatively elastic demand
d. When the proportionate change in demand is greater than the proportionate change in price of a product
e. The value ranges between one to infinity (ep>1)
f. Ex – a smaller change in flight price result in more demand for booking the flight tickets
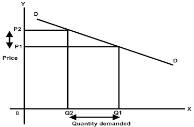

- From the above figure, it is observed that the percentage change in demand from Q2 to Q1 is larger than the percentage change in price from P2 to P1. Thus the demand curve is gradually sloping downwards
4. Relatively inelastic demand
g. When the percentage change in demand is less than the percentage change in price
h. The value ranges between zero to one (ep<1)
i. Ex – cloths, drinks, food, oil , as the change in price does not affect the quantity demanded.

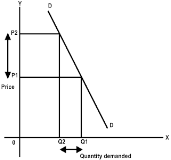
j. From the above figure, it is interpreted that the proportionate change in demand from Q2 to Q1 is less than the proportionate change in price from P2 to P1. Thus the demand cure rapidly sloping down.
5. Unitary elastic demand
k. When the percentage change in quantity demanded in equal to the percentage change in price of the commodity
l. The value is equal to one (ep=1)
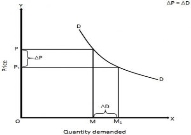
In the above figure we can observe that proportionate change in price from P to P1 cause the same proportionate change in price from M to M1
Q14) Explain types of elasticity of supply?
A14) The law of supply indicates the direction of change—if price goes up, supply will increase. But how much supply will rise in response to an increase in price cannot be known from the law of supply. To quantify such change we require the concept of elasticity of supply that measures the extent of quantities supplied in response to a change in price.
Elasticity of supply measures the degree of responsiveness of quantity supplied to a change in own price of the commodity. It is also defined as the percentage change in quantity supplied divided by percentage change in price.
It can be calculated by using the following formula:
ES = % change in quantity supplied/% change in price
Types of Elasticity of Supply:
(a) Elastic Supply (ES>1):
Supply is said to be elastic when a given percentage change in price leads to a larger change in quantity supplied. Under this situation, the numerical value of Es will be greater than one but less than infinity. SS1 curve of Fig. Exhibits elastic supply. Here quantity supplied changes by a larger magnitude than does price.

(b) Inelastic Supply (ES< 1):
Supply is said to be inelastic when a given percentage change in price causes a smaller change in quantity supplied. Here the numerical value of elasticity of supply is greater than zero but less than one. Fig. Depicts inelastic supply curve where quantity supplied changes by a smaller percentage than does price.

(c) Unit Elasticity of Supply (ES = 1):
If price and quantity supplied change by the same magnitude, then we have unit elasticity of supply. Any straight line supply Curve passing through the origin, such as the one shown in Fig., has an elasticity of supply equal to 1. This can be verified in this way.

(d) Perfectly Elastic Supply (ES = ∞):
The numerical value of elasticity of supply, in exceptional cases, may reach up to infinity. The supply curve PS1 drawn in Fig. Has an elasticity of supply equal to infinity. Here the supply curve has been drawn parallel to the horizontal axis. The economic interpretation of this supply curve is that an unlimited quantity will be offered for sale at the price OS. If price slightly drops down below OS, nothing will be supplied.

(e) Perfectly Inelastic Supply (ES = 0):
Another extreme is the completely or perfectly inelastic supply or zero elasticity. SS1 curve drawn in Figillustrates the case of zero elasticity. This curve describes that whatever the price of the commodity, it may even be zero, quantity supplied remains unchanged at OQ. This sort of supply curve is conceived when we consider the supply curve of land from the viewpoint of a country, or the world as a whole.
