Unit - 5
Load Flow Studies
Q1) The network shown in Figure has impedance in pu as indicated, the shunt admittance is –j20 at each bus. The diagonal element of Y22
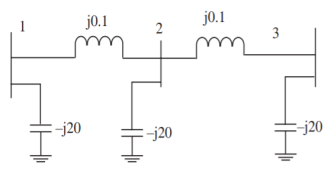
A1)

Q2) The z matrix of a two-port network is given by  The element Y22 of the corresponding Y matrix will be?
A2)
The determinant of z is


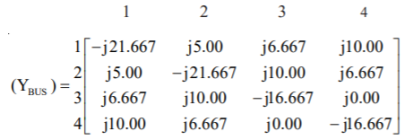
Q3) The line data of a 4-bus system is given below, obtain the YBUS.
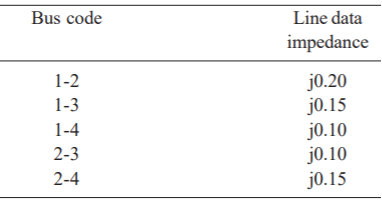
A3)
By inspection the YBUS is calculated. The values of the system are

The value of

Q4) The single line-diagram of a network is shown below. The line reactance is 0.001 pu/km and shunt capacitance is 0.0016 pu km. Assemble the bus admittance matrix neglecting the line resistance.
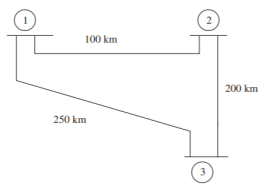
A4)
The calculate line parameters are

The pu series admittance is

Shunt admittances at the nodes are
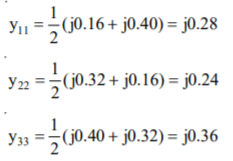
The elements of bus admittance matrix are calculated as


Then the bus admittance matrix is denoted by

Q5) Form the YBus for the given network
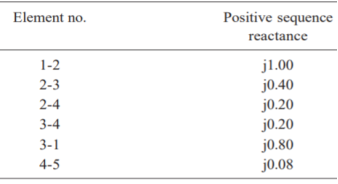
A5)
The primitive admittances are

The diagonal elements are given by
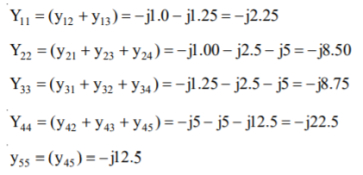
The off-diagonal elements are given by
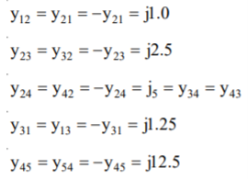
The YBUS matrix is
Q6) Find the bus admittance matrix of the following power system
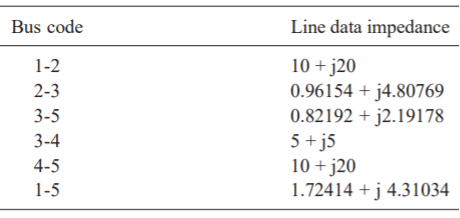
A6)
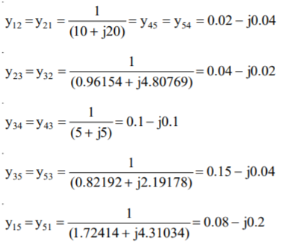
The primitive line admittances are obtained as
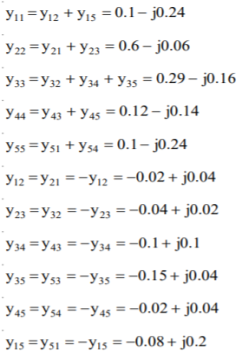
The diagonal elements are given by
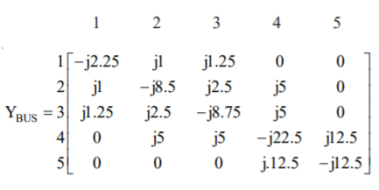
By direct inspection, the YBus is

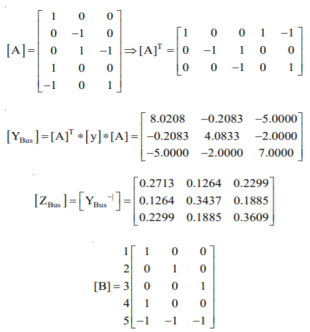
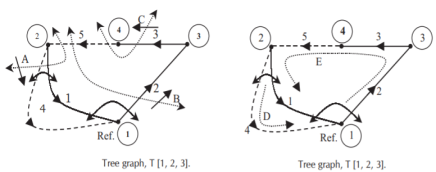
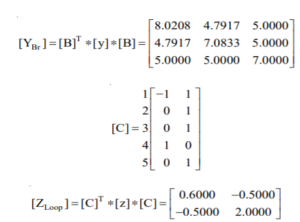
Q7) Form YBus, YBr and ZLoop by singular transformation for the network connections given below:
A7)
The power network is shown in Fig
Q8) Fig shows a 3–bus power system network. The line impedances are given below:
Line (bus to bus): 1 – 2 1 – 3 2 – 3(1) 2 – 3(2)
Impedance in pu: 0.02 + j0.1 0.02 + j0.1 0.05 + j0.25 0.05 + j0.3
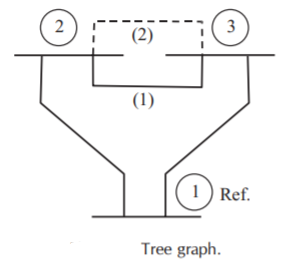
Formulate YBus for the following cases:
1. Assume that the line shown dotted between bus 2 and bus 3 i.e., line 2–3(2) is not present.
2. A new line 2–3(2) is connected and no mutual coupling with other lines.
3. When line 2–3(2) which has mutual impedance of (0.00 + j0.01) pu with line 2 – 3(1) is connected.
A8)
Case (1): By direct inspection:
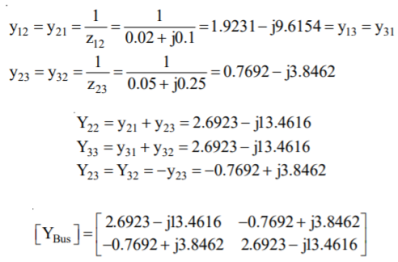
By singular transformation:
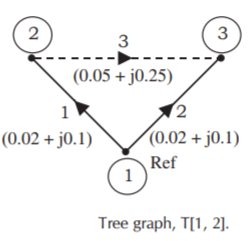
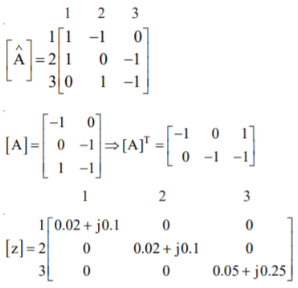
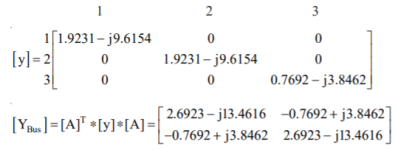
Case (2): By direct inspection:
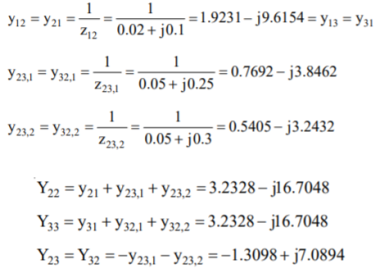

By singular transformation:
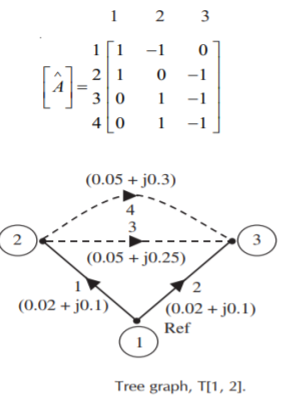

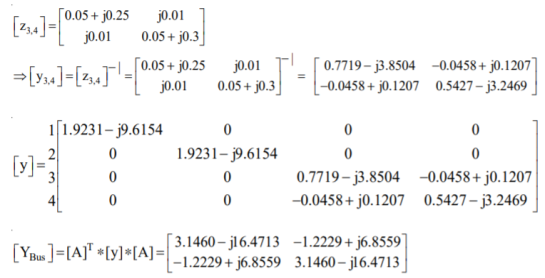
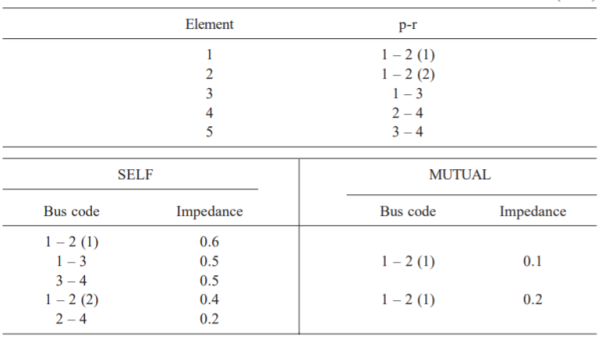
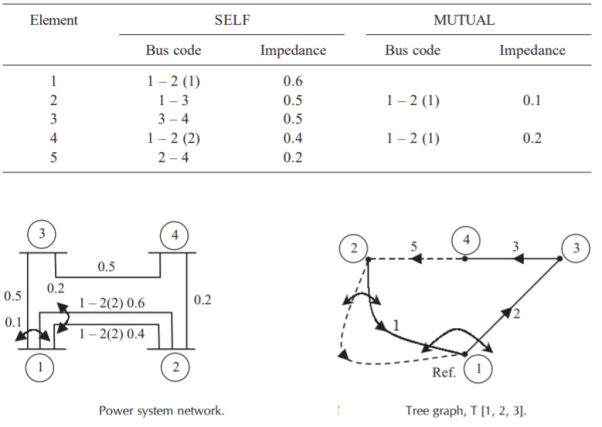
Q9) For the power system network shown in Figure, formulate YBus by singular transformation method. The self and mutual reactance in pu is indicated. Take bus (1) as reference.
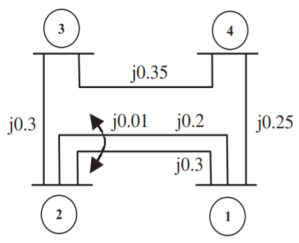
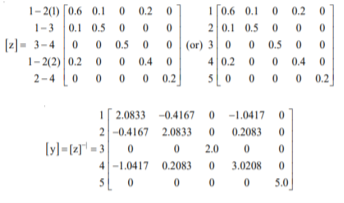
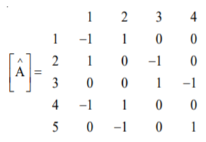
A9)
The oriented network is shown below and tree graph.
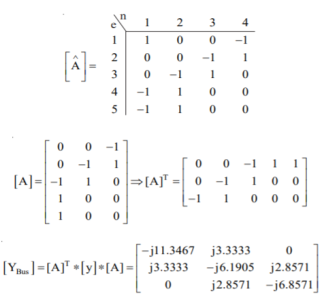
Q10) Form the YBus for the given network.
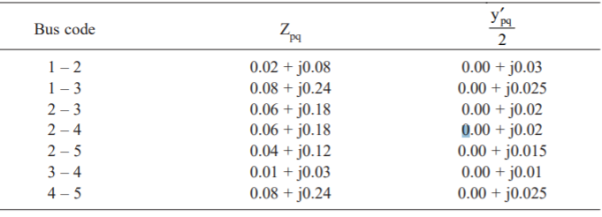
A10)
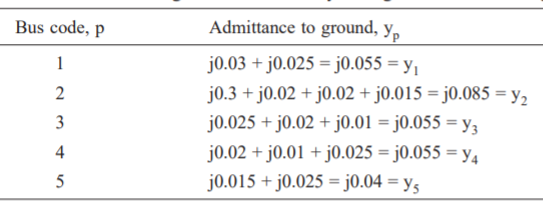
The admittance to ground is obtained by adding the admittances to ground at that bus

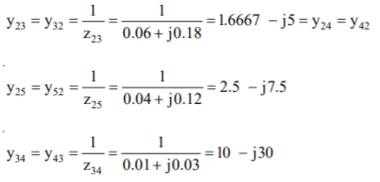
The diagonal elements are:
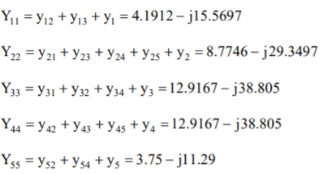
The off-diagonal elements are:
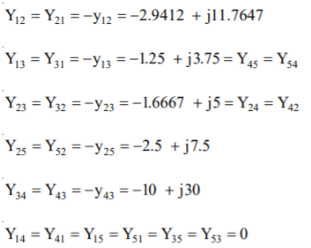
Therefore, the YBus is

Q11) Determine Y bus for the 3 bus system. The line series impedances are as follows:
Line (bus to bus) Impedance (pu)
1-2 0.06+i0.18
1-3 0.09+i0.09
2-3 0.08+i0.24
A11)
Neglect the shunt capacitances of the lines.


Y11 = Y12+Y13= 5-i15 Y22=Y12+Y23= 2.91-i8.75 Y33= Y13+Y23 = 4.58-i13.75
Y12= -Y12 = -1.66+i5 = Y21 Y23=Y32=-Y23= -1.25+i3.75
Y31=Y13=-Y31= 3.33+i10

Q12) Each line has a total shunt admittance of -i5. 0 pu. Determine the modified bus admittance matrix.
A12)
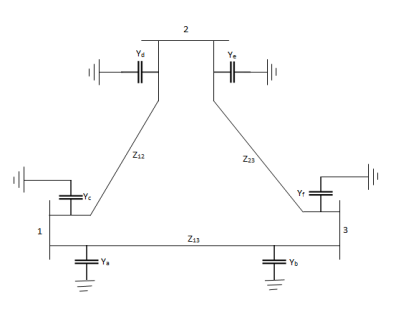
Yc+Yd=-I5.0 andYc=Yd
Ya+Yb=-i5.0 and Ya=Yb
Ye+Yf=-i5.0 and Ye=Yf
Ya = Yb = Yc = Yd = Ye = Yf = -i2.5
When we consider the effect of shunt admittances, only the diagonal elements in Ybus are modified.
Y11(new) = Y11(old) + Ya +Yc = 5-i15-i5 = 5-i20
Y22(new) = Y22(old) + Yd +Ye = 2.91- i8.75 -i5 = 2.91 -i13.5
Y33(new) = Y33(old) + Yf+Yb= 4.58 – i13.75 – i5 = 4.58 – i18.75

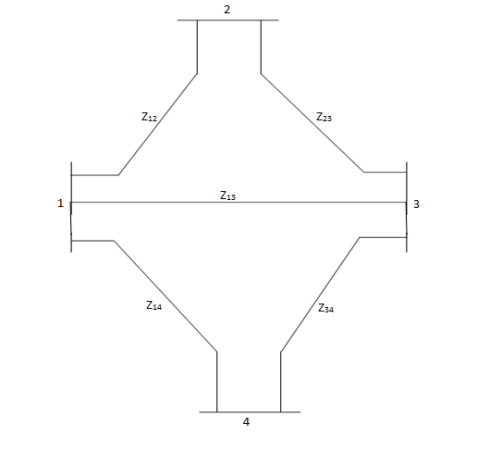
Q13) Determine Ybus for the 4-bus system shown. The line series impedances are as follows:
Line (bus to bus) Impedance (pu)
1-2 0.25+i1.0
1-3 0.20+i0.8
1-4 0.08+i1.2
2-3 0.20+i0.8
3-4 0.15+i0.6
Neglect shunt capacitances of the line.
A13)


Q14) Write short notes on load flow study?
A14)
Load flow studies are important in planning and designing future expansion of power systems. The study gives steady state solutions of the voltages at all the buses, for a particular load condition. Different steady state solutions can be obtained, for different operating conditions, to help in planning, design and operation of the power system. Generally, load flow studies are limited to the transmission system, which involves bulk power transmission. The load at the buses is assumed to be known. Load flow studies throw light on some of the important aspects of the system operation, such as: violation of voltage magnitudes at the buses, overloading of lines, overloading of generators, stability margin reduction, indicated by power angle differences between buses linked by a line, effect of contingencies like line voltages, emergency shutdown of generators, etc. Load flow studies are required for deciding the economic operation of the power system.
They are also required in transient stability studies. Hence, load-flow studies play a vital role in power system studies. Thus, the load flow problem consists of finding the power flows (real and reactive) and voltages of a network for given bus conditions. At each bus, there are four quantities of interest to be known for further analysis: the real and reactive power, the voltage magnitude and its phase angle. Because of the nonlinearity of the algebraic equations, describing the given power system, their solutions are obviously, based on the iterative methods only. The constraints placed on the load flow solutions could be: The Kirchhoff’s relations holding good, Capability limits of reactive power sources, Tap-setting range of tap-changing transformers, Specified power interchange between interconnected systems, Selection of initial values, acceleration factor, convergence limit, etc.
Q15) Explain Gauss Seidel Method for solution?
A15)
The Gauss-Seidel method is based on substituting nodal equations into each other. It is the slower of the two but is the more stable technique. Its convergence is said to be Monotonic. The iteration process can be visualized for two equations
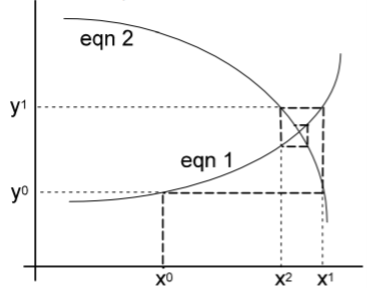
Although not the best load-flow method, Gauss-Seidel is the easiest to understand and was the most widely used technique until the early 1970s. Gauss-Seidel method is used to solve a set of algebraic equations. Consider
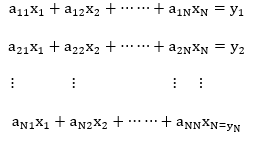

Thus,


k = 1,2,….,N
In Gauss-Seidel method, initially, values of x1, x2 x3……xN are assumed. Updated values are calculated using the above equation. In any iteration h1, up to m k1, values of xm calculated in h1 iteration are used and for m k1 to N, values of xm calculated in h iteration are used. Thus,

In this method, first an initial estimate of bus voltages is assumed. By substituting this estimate in the given set of equations, a second estimate, better than the first one, is obtained. This process is repeated and better and better estimates of the solution are obtained until the difference between two successive estimates becomes lesser than a prescribed tolerance. First let us consider a power system without any P-V bus. Later, the modification required to include the P-V busses will be discussed. This means that given the net power injection at all the load bus, it is required to find the bus voltages at all the load busses. The expression for net power injection being Vk Ik * , the equations to be solved are


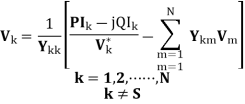


A significant reduction in computing time for a solution can be achieved by performing as many arithmetic operations as possible before initiating the iterative calculation. Let us define


Having defined Ak and Bkm equation

When Gauss-Seidel iterative procedure is used, the voltage at the th k bus during th h 1 iteration, can be computed as

Q16) Explain Newton-Raphson method for solution?
A16)
Load flow solution is an unavoidable tool for power system planning and operation. NR and its derivatives are the most popular and widely used ones among the various methods of load flow solution techniques. In NR method one of the generator buses is treated as slack bus which is kept out of calculation during iterations. This is because of the fact that the slack bus is to carry entire loss of the system and total loss cannot be calculated before the end of iterations [8]. The exclusion of slack bus from the load flow iteration restricts many analyses to make. Consideration of distributed slack bus, load flow for Micro grids, study on minimization of system losses etc. cannot be performed when the slack bus is excluded from the iterations.
The results obtained from this analysis comprises the real and reactive power flow on transmission lines, reactive powers on generator buses, magnitudes and phase angles of load bus voltages. NR method of load flow analysis is an iterative method which approximates the set of nonlinear simultaneous equations to a set of linear simultaneous equations using Taylor’s series expansion and the terms are limited to first order approximation. The non-linear equations governing the power system network are:

Where, Si is the complex power in bus i
Vi is the bus voltage at bus i given as

And

Where, i = is the bus angle at node i
e is the Euler’s constant
 is the complex voltage at node i
Also

Where Vk is the voltage at bus k
k is the bus angle at node k
Ii is the current injected into bus i, given by


Where Yik is the admittance at bus I & k
Qik is the admittance angle at nodes i & k
Pi & Qi is the real & reactive power respectively at bus i

Separate the conjugate complex power in to real & imaginary power & we will get


The above equations constitute the polar form of the power flow equations that provide the calculated values for the net real power Pi & reactive power Qi entering the bus i. Denoting the calculated values of Pi by Pi cal and Qi by Qi cal leads to definition of mismatches ΔPi & ΔQi
Hence,


Mismatches occur when Pi cal & Qi cal do not coincide with scheduled values.
The set of linear equations formed expressing the relationship between changes in real and reactive power components of the bus voltages can be written in compact form as

The Jacobian Matrix J11 J12 is set up as a partitioned matrix by conventional form

The off diagonal and diagonal term in the sub-matrices are real numbers calculated by partial differentiation of above equations 𝜎𝑖 and |𝑉𝑖 |. The Newton-Raphson method solves the polar form of the power flow equations until the mismatches at all buses fall within specified tolerances.
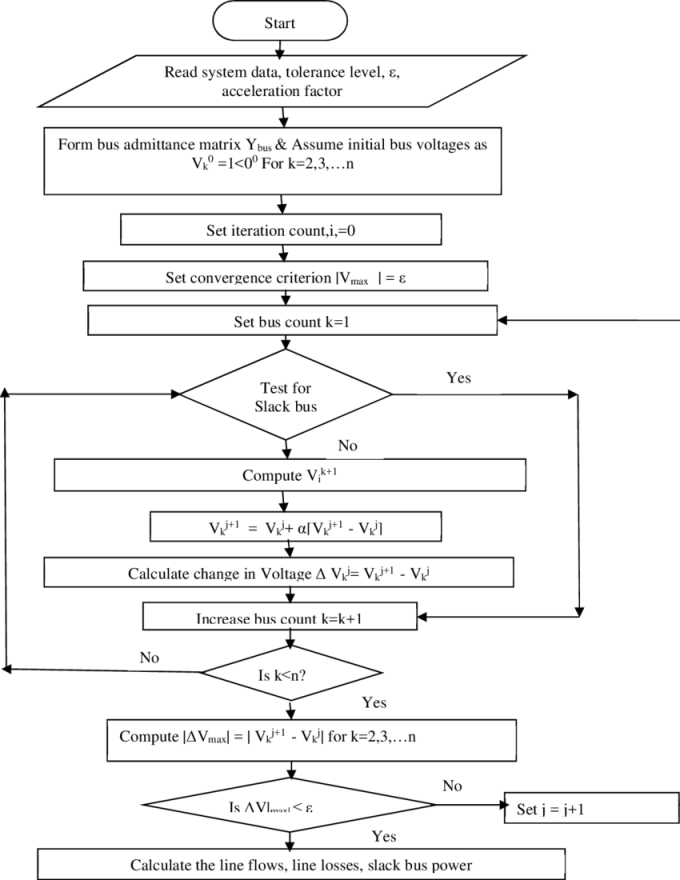
Flowchart of Newton Raphson Method
Q17) Explain concept of voltage stability?
A17)
Voltage stability refers to the ability of a power system to maintain steady voltages at all buses in the system after being subjected to a disturbance. It depends on the ability of the system to maintain equilibrium between load demand and load supply. Instability results in a progressive fall or rise of voltages of some buses, which could lead to loss of load in an area or tripping of transmission lines, leading to cascading outages. This may eventually lead to loss of synchronism of some generators.
The cause of voltage instability is usually the loads. A run-down situation causing voltage instability occurs when load dynamics attempt to restore power consumption beyond the capability of the transmission network. Voltage stability is also threatened when a disturbance increases the reactive power demand beyond the sustainable capacity of the available reactive power resources. Voltage stability is categorized into the following sub-categories:
Small – disturbance voltage stability: It refers to the system’s ability to maintain steady voltages when subjected to small perturbations such as incremental changes in load. This is primarily influenced by the load characteristics and the controls at a given point of time.
Large disturbance voltage stability: It refers to the systems ability to maintain steady voltages following large disturbances; It requires computation of the non-linear response of the power system to include interaction between various devices like motors, transformer tap changers and field current limiters. Short term voltage stability involves dynamics of fast acting load components and period of interest is in the order of several seconds. Long term voltage stability involves slower acting equipment like tap-changing transformers and generator current limiters. Instability is due to loss of long-term equilibrium.
Voltage stability of a simple 2-bus system.
The basic concept of voltage stability can be explained with a simple 2-bus system shown in Figure. The load is of constant power type. Real power transfer from bus 1 to 2 is given by

Reactive power transfer from bus 1 to 2 is given by

Where, E = E ∠δ is the voltage at bus 1, V = V ∠0 is the voltage at bus 2, X= impedance of the line (neglecting resistance), δ = power angle.

Normalizing the terms in above equations with v = V/E, p = P.X/E2 and q = Q.X/E2, one obtains


Squaring the two equations above and rearranging,
v2 (sin2 δ + cos2 δ) = p2 +(q + v2)2
v4 + v2 (2q - 1) + (p2 +q2) = 0

A plot of v on the p-q-v plane corresponding to each point (p,q), there are two solutions for voltage, one is the high voltage or stable solution, which is the actual voltage at the bus, and the other one is the low voltage or unstable solution. The equator, along which the two solutions of v are equal, represents maximum power points. Starting from any operating point on the upper part of the surface, an increase in p or q or both brings the system closer to the maximum power point. An increase in p or q beyond the maximum power point makes the voltage unstable. The preceding discussion illustrates voltage instability caused by an increase in system loading. In a real power system, voltage instability is caused by a combination of many additional factors which includes the transmission capability of the network, generator reactive power and voltage control limits, voltage sensitivity of the load, characteristics of reactive compensation devices, action of voltage control devices such as transformer under load tap changers (ULTCs) etc.
Q18) Explain PV and VQ curves?
A18)
PV Curves
This is one of the widely used methods of voltage stability analysis. This gives the available amount of active power margin before the point of voltage instability. For radial systems, the voltage of the critical bus is monitored against the changes in real power consumption. For large meshed networks, P can be the total active load in the load area and V can be the voltage of the critical or representative bus. Real power transfer through a transmission interface or interconnection also can be studied by this method. For a simple two-bus system as shown in Figure above, equation above gives real solutions of v2, provided (1 – 4q – 4p2) ≥ 0.
Assuming a constant power factor load such that q/p = k (constant), the inequality can be expressed as

For values of ‘p’ satisfying above equation, there are two solutions of v as follows:


For real values of v1 and v2, the terms under the square roots should be positive.


In practice, it is possible to find the Thevenin equivalent of any system with respect to the bus under consideration. It is to be noted that the generations are rescheduled at each step of change of the load. Some of the generators may hit the reactive power limit. The network topology may keep changing with respect to the critical bus, with change in the loading, thereby reducing the accuracy of the method. This method works well in the case of an infinite bus and isolated load scenario.
V-Q curve method
The V-Q curve method is one of the most popular ways to investigate voltage instability problems in power systems during the post transient period. Unlike the P-V curve method, it doesn’t require the system to be represented as two-bus equivalent. Voltage at a test bus or critical bus is plotted against reactive power at that bus. A fictitious synchronous generator with zero active power and no reactive power limit is connected to the test bus. The power-flow program is run for a range of specified voltages with the test bus treated as the generator bus. Reactive power at the bus is noted from the power flow solutions and plotted against the specified voltage. The operating point corresponding to zero reactive power represents the condition when the fictitious reactive power source is removed from the test bus. Voltage security of a bus is closely related to the available reactive power reserve, which can be easily found from the V-Q curve of the bus under consideration. The reactive power margin is the MVAR distance between the operating point and either the nose point of the V-Q curve or the point where capacitor characteristics at the bus are tangent to the V-Q curve. Stiffness of the bus can be qualitatively evaluated from the slope of the right portion of the V-Q curve. The greater the slope is, the less stiff is the bus, and therefore the more vulnerable to voltage collapse it is. Weak busses in the system can be determined from the slope of V-Q curve. For the simple two-bus system equations of V-Q curves for constant power loads can be derived as follows. From the power angle δ is computed for specified active power.
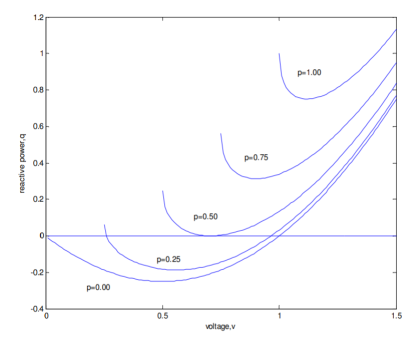
For a range of values of voltage and different active power levels, normalized V-Q curves are shown in Figure below. The critical point or nose point of the characteristics corresponds to the voltage where dQ/dV becomes zero. If the minimum point of the V-Q curve is above the horizontal axis, then the system is reactive power deficient. Additional reactive power sources are needed to prevent a voltage collapse. In Figure, curves for p=1.00 and p=0.75 signify reactive power deficient busses. Busses having V-Q curves below the horizontal axis have a positive reactive power margin. The system may still be called reactive power deficient, depending on the desired margin.
Q19) Explain the methods to improve voltage stability?
A19)
The various methods to improve voltage stability are
- Planning of generation system- The reliability aspect of supply can be improved by sitting generating plants in the load areas
- Maintenance of generation system: Over excitation and under excitation limiters, alarm settings, tap changer settings need to be verified and maintained
- Operation of generation system: During peak load power import over the transmission network should be reduced
- Reactive power compensation: Extra high voltage transmission lines require shunt reactors for energization and under lightly loaded condition. These shunt reactors should be switched off during voltage emergencies
- Capacitor bank: Shunt capacitor banks acts as constant reactive power sources.
- Tap changing: The tap changing transformers change the transformation ratio and thus the voltage in the secondary circuit is varied and voltage control is obtained.