Unit - 3
Digital Modulation Techniques
Q1) Compare MSK and QPSK techniques of modulation?
A1)
MSK | QPSK |
The MSK baseband waveforms are smoother than that of QPSK. | The QPSK baseband waveforms are not smoother comparatively. |
MSK signal has continuous phase in all the cases | The QPSK has abrupt phase shift of π/2 or π. |
MSK waveform doesnot support any amplitude variations | QPSK signals have abrupt amplitude variations |
The main lobe of MSK is wider than that of QPSK | The main lobe of MSK is wider than that of QPSK |
Side sections of MSK are smaller compared to that of QPSK | Side sections of QPSK are bigger compared to that MSK |
Bpf is not required in MSK | To avoid inter channel interference, QPSK needs band pass filtering |
Not exist in MSK | Band pass filtering changes the amplitude wavelength of QPSK |
The bandwidth requirement of MSK is 1.5fb
| The bandwidth is fb in case of QPSK
|
The generation & detection of MSK is slightly more complicated. Because of incorrect synchronization phase jitter can be present in MSK causing degradation of the performance of MSK.
| Comparatively simple in case of QPSK
|
Q2) Draw and explain the signal space diagram of MSK?
A2) We see that there are two orthonormal basis functions 1(t) and 2(t) characterizing the generation of MSK; they are defined by the following pair of sinusoidally modulated quadrature carriers:
1(t) = 2/Tb cos (πt/2Tb) cos (2πfct) 0≤ t ≤ Tb
2(t) = 2/Tb sin (πt/2Tb) sin (2πfct) 0≤ t ≤ Tb
s(t) = s11(t) + s11(t) 0≤ t ≤ Tb
Where the coefficients s1 and s2 are related to the phase states (0) and (Tb), respectively. To evaluate s1, we integrate the product s(t)1(t) with respect to time t between the limits –Tb and Tb, obtaining
s1 = 
= Eb cos [θ(0)] -Tb ≤ t ≤ Tb
Similarly, to evaluate s2 we integrate the product s(t)2(t) with respect to time t between the limits 0 and 2Tb, obtaining
s2 = 
From above two equations we conclude that
1. Both integrals are evaluated for a time interval equal to twice the bit duration.
2. The lower and upper limits of the integral used to evaluate s1 are shifted by the bit duration Tb with respect to those used to evaluate s2.
3. The time interval 0 t Tb, for which the phase states (0) and (Tb) are defined, is common to both integrals.
It follows, therefore, that the signal constellation for an MSK signal is two-dimensional (i.e., N = 2), with four possible message points (i.e., M = 4), as illustrated in the signal space diagram of Figure below.
( + Eb , + Eb), ( - Eb , + Eb), ( - Eb , - Eb) and ( + Eb , - Eb)
The possible values of (0) and (Tb), corresponding to these four message points, are also included in Figure below. The signal-space diagram of MSK is thus similar to that of QPSK in that both of them have four message points in a two-dimensional space. However, they differ in a subtle way that should be carefully noted:
- QPSK, moving from one message point to an adjacent one, is produced by sending a two-bit symbol (i.e., dibit).
- MSK, on the other hand, moving from one message point to an adjacent one, is produced by sending a binary symbol, 0 or 1. However, each symbol shows up in two opposite quadrants, depending on the value of the phase-pair: (0) and (Tb).
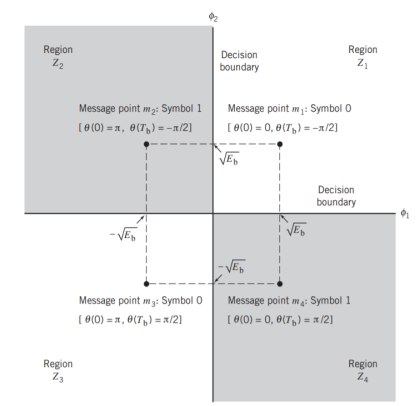
Fig 1. Signal-space diagram for MSK system
Q3) Derive the expression of probability of error of MSK?
A3) Error Probability of MSK
In the case of an AWGN channel, the received signal is given by
x(t) = s(t) + w(t)
Where s(t) is the transmitted MSK signal and w(t) is the sample function of a white Gaussian noise process of zero mean and power spectral density N0/2. To decide whether symbol 1 or symbol 0 was sent in the interval 0 t Tb, say, we have to establish a procedure for the use of x(t) to detect the phase states (0) and (Tb). For the optimum detection of (0), we project the received signal x(t) onto the reference signal over the interval –Tb t Tb, obtaining
x1 = 
w1 is the sample value of a Gaussian random variable of zero mean and variance N0/2. From the signal-space diagram, we see that if x1 > 0, the receiver chooses the estimate. On the other hand, if x1 0, it chooses the estimate. Similarly, for the optimum detection of (Tb), we project the received signal x(t) onto the second reference signal 2(t) over the interval 0 t 2Tb, obtaining
x2 =  0 ≤ t ≤ 2Tb
w2 is the sample value of another independent Gaussian random variable of zero mean and variance N02. Referring again to the signal space diagram, we see that if x2 0, the receiver chooses the estimate Tb= – 2. If, however, x2 0, the receiver chooses the estimate ˆ Tb = 2
It follows, therefore, that the BER for the coherent detection of MSK signals is given by
Pc = Q (2Eb/N0)
Q4) With the help of block diagram explain the generation and detection of MSK Signals?
A4) Generation and Coherent Detection of MSK Signals
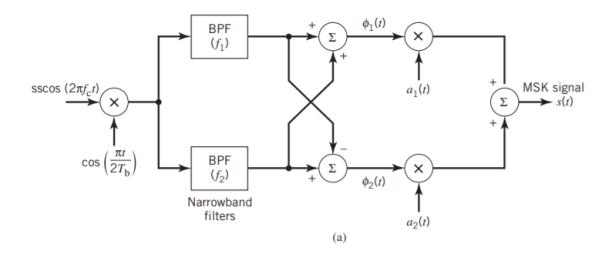
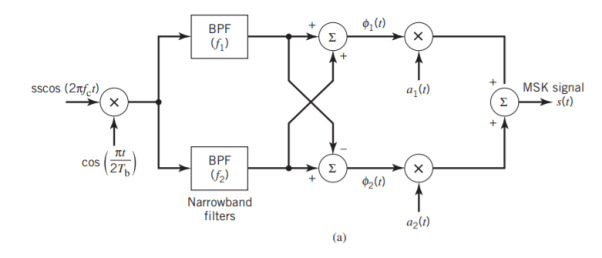
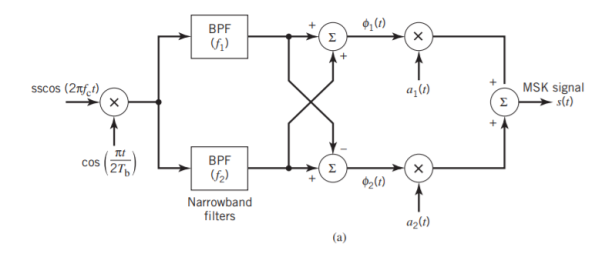
With h = 1/2, we may use the block diagram of Figure(a) below to generate the MSK signal. The advantage of this method of generating MSK signals is that the signal coherence and deviation ratio are largely unaffected by variations in the input data rate. Two input sinusoidal waves, one of frequency fc = nc4Tb for some fixed integer nc and the other of frequency 14Tb, are first applied to a product modulator. This modulator produces two phase-coherent sinusoidal waves at frequencies f1 and f2, which are related to the carrier frequency fc and the bit rate 1/Tb in accordance with above equations for deviation ratio h = 12. These two sinusoidal waves are separated from each other by two narrowband filters, one centered at f1 and the other at f2. The resulting filter outputs are next linearly combined to produce the pair of quadrature carriers or orthonormal basis functions 1(t) and 2(t). Finally, 1(t) and 2(t) is multiplied with two binary waves a1(t) and a2(t), both of which have a bit rate equal to 1/(2Tb)
(b)
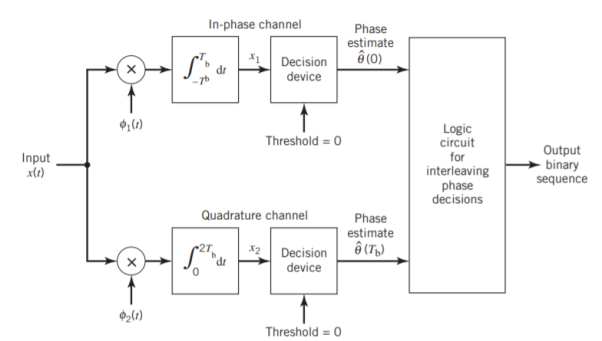
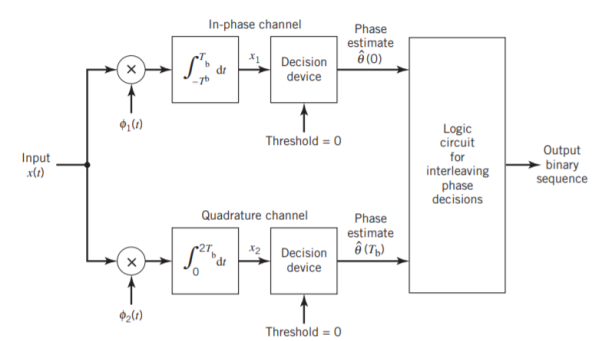
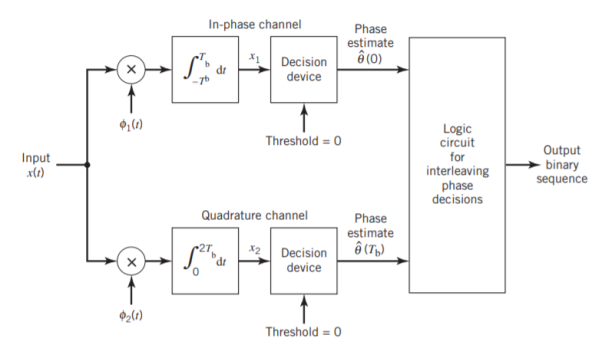
Fig 2. Block diagrams for (a) MSK transmitter and (b) coherent MSK receiver
Figure (b) above shows the block diagram of the coherent MSK receiver. The received signal x(t) is correlated with 1(t) and 2(t). In both cases, the integration interval is 2Tb seconds, and the integration in the quadrature channel is delayed by Tb seconds with respect to that in the in-phase channel. The resulting in-phase and quadrature channel correlator outputs, x1 and x2, are each compared with a threshold of zero
Q5) What is continuous phase frequency shift keying?
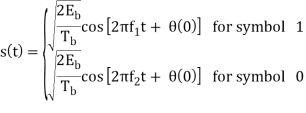
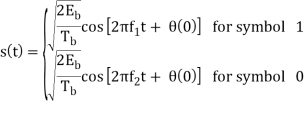
A5) In the coherent detection of binary FSK signal, the phase information contained in the received signal is not fully exploited, other than to provide for synchronization of the receiver to the transmitter. We now show that by proper use of the continuous-phase property when performing detection, it is possible to improve the noise performance of the receiver significantly. Here again, this improvement is achieved at the expense of increased system complexity. Consider a continuous-phase frequency-shift keying (CPFSK) signal, which is defined for the signaling interval 0 t Tb as follows:
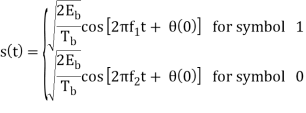
Where Eb is the transmitted signal energy per bit and Tb is the bit duration.
Another useful way of representing the CPFSK signal s(t) is to express it as a conventional angle-modulated signal:
s(t) =  cos [ 2πfct + θ(t)]
Where (t) is the phase of s(t) at time t. When the phase (t) is a continuous function of time, we find that the modulated signal s(t) is itself also continuous at all times, including the inter-bit switching times. The phase (t) of a CPFSK signal increases or decreases linearly with time during each bit duration of Tb seconds, as shown by
θ(t) = θ(0) ± (πh/Tb)t, 0 ≤ t ≤ Tb
Here the plus sign corresponds to sending symbol 1 and the minus sign corresponds to sending symbol 0; the dimensionless parameter h is to be defined. We deduce the following pair of relations:
fc + h/2TB = f1
fc – h/2TB = f2
Solving this pair of equations for fc and h, we get
fc = ½ (f1 + f2)
h – Tb (f1 – f2)
Q6) What is inter symbol interference and what are its causes?
A6) This is a form of distortion of a signal, in which one or more symbols interfere with subsequent signals, causing noise or delivering a poor output.
Causes of ISI
The main causes of ISI are −
- Multi-path Propagation
- Non-linear frequency in channels
The ISI is unwanted and should be completely eliminated to get a clean output. The causes of ISI should also be resolved in order to lessen its effect.
To view ISI in a mathematical form present in the receiver output, we can consider the receiver output.
The receiving filter output y(t)y(t) is sampled at time ti=iTb (with i taking on integer values), yielding –
y(ti)= μ∑akp(iTb−kTb)
= μai+μ∑akp(iTb−kTb)
In the above equation, the first term μai is produced by the ith transmitted bit.
The second term represents the residual effect of all other transmitted bits on the decoding of the ith bit. This residual effect is called as Inter Symbol Interference.
In the absence of ISI, the output will be −
y(ti)=μai
This equation shows that the ith bit transmitted is correctly reproduced. However, the presence of ISI introduces bit errors and distortions in the output.
While designing the transmitter or a receiver, it is important that you minimize the effects of ISI, so as to receive the output with the least possible error rate.
Q7) What is eye diagram explain with waveform representation?
A7) An eye diagram or eye pattern is simply a graphical display of a serial data signal with respect to time that shows a pattern that resembles an eye.
The signal at the receiving end of the serial link is connected to an oscilloscope and the sweep rate is set so that one- or two-bit time periods (unit intervals or UI) are displayed. This causes bit periods to overlap and the eye pattern to form around the upper and lower signal levels and the rise and fall times. The eye pattern readily shows the rise and fall time lengthening and rounding as well as the horizontal jitter variation.
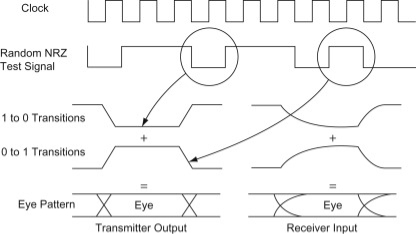
Fig. 3: Eye diagram
Q8) What is equalization?
A8) For reliable communication, we need to have a quality output. The transmission losses of the channel and other factors affecting the quality of the signal. The most occurring loss, as we have discussed, is the ISI.
To make the signal free from ISI, and to ensure a maximum signal to noise ratio, we need to implement a method called Equalization.

Fig. 4: Equalization
The noise and interferences which are denoted in the figure, are likely to occur, during transmission. The regenerative repeater has an equalizer circuit, which compensates the transmission losses by shaping the circuit. The Equalizer is feasible to get implemented.
Q9) Explain with the help of block diagram the OFDM system?
A9) The Orthogonal Frequency Division Multiplexing (OFDM) transmission scheme is the optimum version of the multicarrier transmission scheme. In the past, as well as in the present, the OFDM is referred in the literature Multi-carrier, Multi-tone and Fourier Transform.
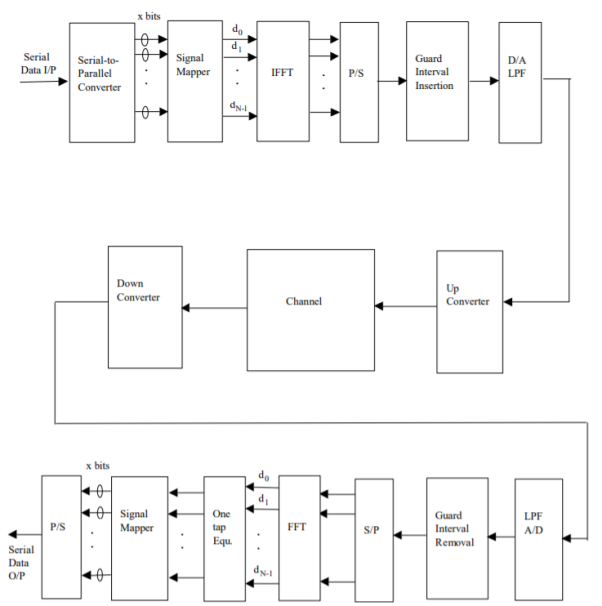
Fig 5. General OFDM System
The incoming signal is converted to parallel form by serial to parallel converter. After that it is grouped in x bits to form a complex number. These numbers are then modulated in a baseband manner by IFFT. Then through parallel to serial converted they are converted to serial data and transmitted. In order to avoid inter symbol interference a guard interval is inserted between the symbols. The discrete symbols are converted to analog and lowpass filtered for RF up-conversion. The receiver performs the inverse process of the transmitter. One tap equalizer is used to correct channel distortion. The tap coefficients of the filter are calculated based on channel information.
Q10) Write short note on OFDM?
A10)
- The Orthogonal Frequency Division Multiplexing (OFDM) transmission scheme is the optimum version of the multicarrier transmission scheme. In the past, as well as in the present, the OFDM is referred in the literature Multi-carrier, Multi-tone and Fourier Transform.
- In mid-1960 parallel data transmission and frequency multiplexing came. In high speed digital communication OFMD is employed. OFMD has a drawback of massive complex computation and high-speed memory which are no more problems now due to introduction of DSP and VLSI.
- The implementation of this technology is cost effective as FFT eliminates array of sinusoidal generators and coherent demodulation required in parallel data systems·The data to be transmitted is spread overlarge number of carriers. Each of them is then modulated at low rates. By choosing proper frequency between them the carriers are made orthogonal to each other.
- In OFDM the spectral overlapping among the sun carrier is allowed, at the receiver due to orthogonality the subcarriers can be separated. This provides better spectral efficiency and use to steep BPF is eliminated.
- The problems arising in single carrier scheme are eliminated in OFDM transmission system. It has the advantage of spreading out a frequency selective fade over many symbols. This effectively randomizes burst errors caused by fading or impulse interference so that instead of several adjacent symbols being completely destroyed, many symbols are only slightly distorted.
- Because of this reconstruction of majority of them even without forward error correction is possible. As the entire bandwidth is divided into many narrow bandwidths, the suband become smaller then the coherent bandwidth of the channel which makes the frequency response over individual subbands is relatively flat.Hence, equalization becomes much easier than in single carrier system and it can be avoided altogether if differential encoding is employed.
- The orthoganality of subchannles in OFDM can be maintained and individual subchannels can be completely separated by the FFT at the receiver when there are no intersymbol interference (ISI) and intercarrier interference (ICI) introduced by the transmission channel distortion.
- Since the spectra of an OFDM signal is not strictly band limited, linear distortions such as multipath propagation causes each subchannel to spread energy into the adjacent channels and consequently cause ISI.
- One way to prevent ISI is to create a cyclically extended guard interval, where each OFDM symbol is preceded by a periodic extension of the signal itself. When the guard interval is longer than the channel impulse response or multipath delay, the ISI can be eliminated.
- By using time and frequency diversity, OFDM provides a means to transmit data in a frequency selective channel. However, it does not suppress fading itself. Depending on their position in the frequency domain, individual subchannels could be affected by fading.
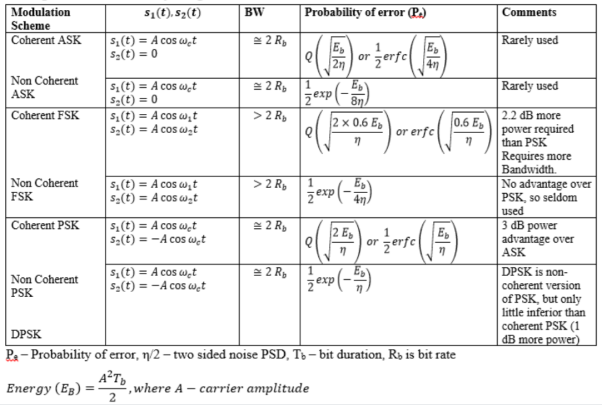
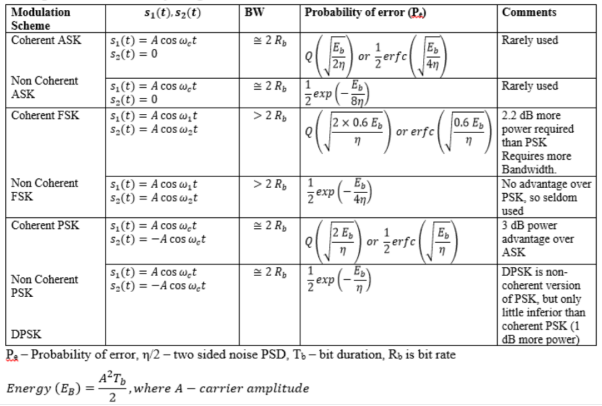
Q11) Compare the digital modulation systems?
A11)
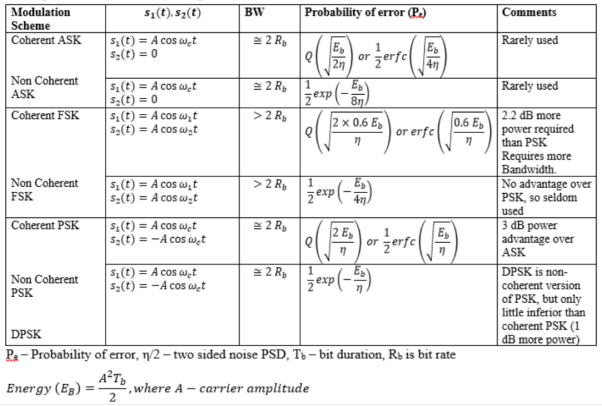
Q12) What is pulse shaping explain with waveform?
A12) Pulse shaping is the process of changing the waveform of transmitted pulses. Its purpose is to make the transmitted signal better suited to its purpose or the communication channel, typically by limiting the effective bandwidth of the transmission.
In communications systems, two important requirements of a wireless communications channel demand the use of a pulse shaping filter. These requirements are:
1) generating bandlimited channels, and
2) reducing inter symbol interference (ISI) from multi-path signal reflections. Both requirements can be accomplished by a pulse shaping filter which is applied to each symbol.
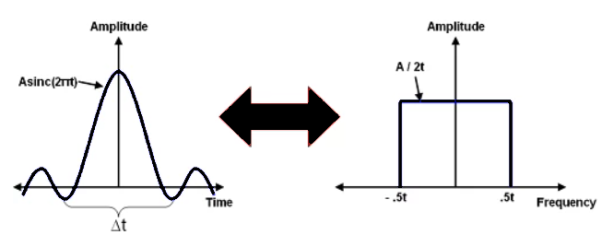
Fig 6. Time v/s Frequency Domain of Sinc Pulse
In fact, the sinc pulse, shown below, meets both of these requirements because it efficiently utilizes the frequency domain to utilize a smaller portion of the frequency domain, and because of the windowing affect that it has on each symbol period of a modulated signal. A sinc pulse is shown below along with an FFT spectrum of the given signal.
Q13) Derive expression for bandwidth of M-ary FSK?
A13) When the orthogonal signals of an M-ary FSK signal are detected coherently, the adjacent signals need only be separated from each other by a frequency difference 12T so as to maintain orthogonality. Hence, we may define the channel bandwidth required to transmit M-ary FSK signals as
B=M/2T
For multilevels with frequency assignments that make the frequency spacing uniform and equal to 1/2T, the bandwidth B contains a large fraction of the signal power.
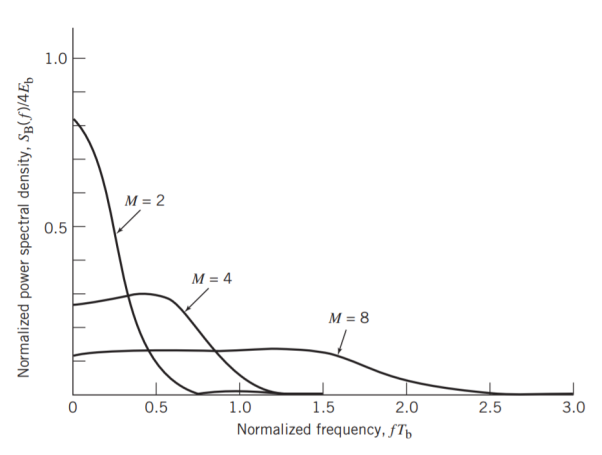
Fig 7. Power spectra of M-ary PSK signals for M = 2, 4, 8.
Hence, using Rb=1/Tb, we may redefine the channel bandwidth B for M-ary FSK signals as
B = RbM/2log2M
The bandwidth efficiency of M-ary signals is therefore
= Rb/B
= 2 log2M/M
Q14) Write short notes on M-ark FSK?
A14) Consider next the M-ary version of FSK, for which the transmitted signals are defined by
si(t) = 2E/T cos[ π/T (nc+i)t] 0≤t≤T
Where i = 1, 2, , M, and the carrier frequency fc = nc/(2T) for some fixed integer nc. The transmitted symbols are of equal duration T and have equal energy E. Since the individual signal frequencies are separated by 1/(2T) Hz, the M-ary FSK signals constitute an orthogonal set; that is,
 si(t)sj(t)dt = 0, i≠j
Hence, we may use the transmitted signals si (t) themselves, except for energy normalization, as a complete orthonormal set of basis functions, as shown by
i(t) = 1/E si(t), for 0 ≤ t ≤ T and i= 1, 2, ......, M
Accordingly, the M-ary FSK is described by an M-dimensional signal-space diagram. For the coherent detection of M-ary FSK signals, the optimum receiver consists of a bank of M correlators or matched filters, with i (t) providing the basis functions. At the sampling times t = kT, the receiver makes decisions based on the largest matched filter output in accordance with the maximum likelihood decoding rule. An exact formula for the probability of symbol error is, however, difficult to derive for a coherent M-ary FSK system. Nevertheless, we may use the union bound to place an upper bound on the average probability of symbol error for M-ary FSK. Specifically, since the minimum distance dmin in M-ary FSK is √2E, we have
Pe ≤ (M-)Q(E/N0)
For fixed M, this bound becomes increasingly tight as the ratio EN0 is increased. Indeed, it becomes a good approximation to Pe for values of Pe 10–3.
Power Spectra of M-ary FSK Signals
The spectral analysis of M-ary FSK signals is much more complicated than that of M-ary PSK signals. A case of particular interest occurs when the frequencies assigned to the multilevels make the frequency spacing uniform and the frequency deviation h = 12. That is, the M signal frequencies are separated by 1/2T, where T is the symbol duration. For h = 12, the baseband power spectral density of M-ary FSK signals is plotted in Figure below for M = 2, 4, 8.
Q15) Explain QAM modulator and demodulation?
A15) Basic QAM I-Q modulator circuit
The two resultant signals are summed and then processed as required in the RF signal chain, typically converting them in frequency to the required final frequency and amplifying them as required.
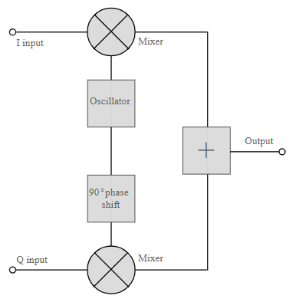
Fig. 8: Basic QAM
It is worth noting that as the amplitude of the signal varies any RF amplifiers must be linear to preserve the integrity of the signal. Any non-linearities will alter the relative levels of the signals and alter the phase difference, thereby distorting he signal and introducing the possibility of data errors.
Basic QAM I-Q demodulator circuit
The basic modulator assumes that the two quadrature signals remain exactly in quadrature.
A further requirement is to derive a local oscillator signal for the demodulation that is exactly on the required frequency for the signal. Any frequency offset will be a change in the phase of the local oscillator signal with respect to the two double sideband suppressed carrier constituents of the overall signal.
Systems include circuitry for carrier recovery that often utilises a phase locked loop - some even have an inner and outer loop. Recovering the phase of the carrier is important otherwise the bit error rate for the data will be compromised.

Fig. 9: Basic QAM demodulator
The circuits shown above show the generic IQ QAM modulator and demodulator circuits that are used in a vast number of different areas. Not only are these circuits made from discrete components, but more commonly they are used within integrated circuits that are able to provide a large number of functions.
Q16) Derive expression for error probability and explain the signal space representation of QAM?
A16) Error Probability
BER for QAM constellation
The SER for a rectangular M-QAM (16-QAM, 64-QAM, 256-QAM etc) with size L = M2 can be calculated by considering two M-PAM on in-phase and quadrature components. The error probability of QAM symbol is obtained by the error probability of each branch (M-PAM) and is given by

Signal Space Representation
For the case when M = 2k , k even, the resulting signal space diagram has a “square constellation.” In this case the QAM signal can be thought of as 2 PAM signals in quadrature. For M = 2k, k odd, the constellation takes on a “cross” form. For example, 16-QAM constellation is
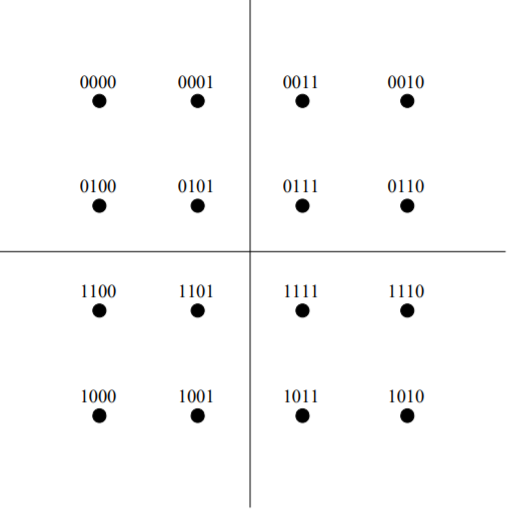
Fig 10:16-QAM constellation
Unit - 3
Unit - 3
Digital Modulation Techniques
Q1) Compare MSK and QPSK techniques of modulation?
A1)
MSK | QPSK |
The MSK baseband waveforms are smoother than that of QPSK. | The QPSK baseband waveforms are not smoother comparatively. |
MSK signal has continuous phase in all the cases | The QPSK has abrupt phase shift of π/2 or π. |
MSK waveform doesnot support any amplitude variations | QPSK signals have abrupt amplitude variations |
The main lobe of MSK is wider than that of QPSK | The main lobe of MSK is wider than that of QPSK |
Side sections of MSK are smaller compared to that of QPSK | Side sections of QPSK are bigger compared to that MSK |
Bpf is not required in MSK | To avoid inter channel interference, QPSK needs band pass filtering |
Not exist in MSK | Band pass filtering changes the amplitude wavelength of QPSK |
The bandwidth requirement of MSK is 1.5fb
| The bandwidth is fb in case of QPSK
|
The generation & detection of MSK is slightly more complicated. Because of incorrect synchronization phase jitter can be present in MSK causing degradation of the performance of MSK.
| Comparatively simple in case of QPSK
|
Q2) Draw and explain the signal space diagram of MSK?
A2) We see that there are two orthonormal basis functions 1(t) and 2(t) characterizing the generation of MSK; they are defined by the following pair of sinusoidally modulated quadrature carriers:
1(t) = 2/Tb cos (πt/2Tb) cos (2πfct) 0≤ t ≤ Tb
2(t) = 2/Tb sin (πt/2Tb) sin (2πfct) 0≤ t ≤ Tb
s(t) = s11(t) + s11(t) 0≤ t ≤ Tb
Where the coefficients s1 and s2 are related to the phase states (0) and (Tb), respectively. To evaluate s1, we integrate the product s(t)1(t) with respect to time t between the limits –Tb and Tb, obtaining
s1 = 
= Eb cos [θ(0)] -Tb ≤ t ≤ Tb
Similarly, to evaluate s2 we integrate the product s(t)2(t) with respect to time t between the limits 0 and 2Tb, obtaining
s2 = 
From above two equations we conclude that
1. Both integrals are evaluated for a time interval equal to twice the bit duration.
2. The lower and upper limits of the integral used to evaluate s1 are shifted by the bit duration Tb with respect to those used to evaluate s2.
3. The time interval 0 t Tb, for which the phase states (0) and (Tb) are defined, is common to both integrals.
It follows, therefore, that the signal constellation for an MSK signal is two-dimensional (i.e., N = 2), with four possible message points (i.e., M = 4), as illustrated in the signal space diagram of Figure below.
( + Eb , + Eb), ( - Eb , + Eb), ( - Eb , - Eb) and ( + Eb , - Eb)
The possible values of (0) and (Tb), corresponding to these four message points, are also included in Figure below. The signal-space diagram of MSK is thus similar to that of QPSK in that both of them have four message points in a two-dimensional space. However, they differ in a subtle way that should be carefully noted:
- QPSK, moving from one message point to an adjacent one, is produced by sending a two-bit symbol (i.e., dibit).
- MSK, on the other hand, moving from one message point to an adjacent one, is produced by sending a binary symbol, 0 or 1. However, each symbol shows up in two opposite quadrants, depending on the value of the phase-pair: (0) and (Tb).
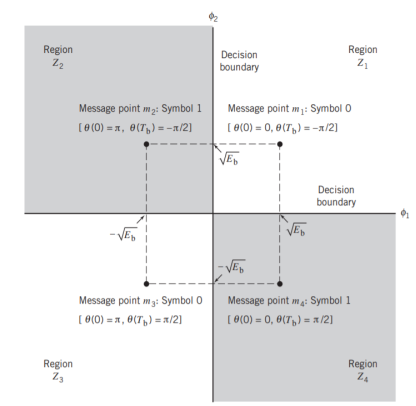
Fig 1. Signal-space diagram for MSK system
Q3) Derive the expression of probability of error of MSK?
A3) Error Probability of MSK
In the case of an AWGN channel, the received signal is given by
x(t) = s(t) + w(t)
Where s(t) is the transmitted MSK signal and w(t) is the sample function of a white Gaussian noise process of zero mean and power spectral density N0/2. To decide whether symbol 1 or symbol 0 was sent in the interval 0 t Tb, say, we have to establish a procedure for the use of x(t) to detect the phase states (0) and (Tb). For the optimum detection of (0), we project the received signal x(t) onto the reference signal over the interval –Tb t Tb, obtaining
x1 = 
w1 is the sample value of a Gaussian random variable of zero mean and variance N0/2. From the signal-space diagram, we see that if x1 > 0, the receiver chooses the estimate. On the other hand, if x1 0, it chooses the estimate. Similarly, for the optimum detection of (Tb), we project the received signal x(t) onto the second reference signal 2(t) over the interval 0 t 2Tb, obtaining
x2 =  0 ≤ t ≤ 2Tb
w2 is the sample value of another independent Gaussian random variable of zero mean and variance N02. Referring again to the signal space diagram, we see that if x2 0, the receiver chooses the estimate Tb= – 2. If, however, x2 0, the receiver chooses the estimate ˆ Tb = 2
It follows, therefore, that the BER for the coherent detection of MSK signals is given by
Pc = Q (2Eb/N0)
Q4) With the help of block diagram explain the generation and detection of MSK Signals?
A4) Generation and Coherent Detection of MSK Signals
With h = 1/2, we may use the block diagram of Figure(a) below to generate the MSK signal. The advantage of this method of generating MSK signals is that the signal coherence and deviation ratio are largely unaffected by variations in the input data rate. Two input sinusoidal waves, one of frequency fc = nc4Tb for some fixed integer nc and the other of frequency 14Tb, are first applied to a product modulator. This modulator produces two phase-coherent sinusoidal waves at frequencies f1 and f2, which are related to the carrier frequency fc and the bit rate 1/Tb in accordance with above equations for deviation ratio h = 12. These two sinusoidal waves are separated from each other by two narrowband filters, one centered at f1 and the other at f2. The resulting filter outputs are next linearly combined to produce the pair of quadrature carriers or orthonormal basis functions 1(t) and 2(t). Finally, 1(t) and 2(t) is multiplied with two binary waves a1(t) and a2(t), both of which have a bit rate equal to 1/(2Tb)
(b)
Fig 2. Block diagrams for (a) MSK transmitter and (b) coherent MSK receiver
Figure (b) above shows the block diagram of the coherent MSK receiver. The received signal x(t) is correlated with 1(t) and 2(t). In both cases, the integration interval is 2Tb seconds, and the integration in the quadrature channel is delayed by Tb seconds with respect to that in the in-phase channel. The resulting in-phase and quadrature channel correlator outputs, x1 and x2, are each compared with a threshold of zero
Q5) What is continuous phase frequency shift keying?
A5) In the coherent detection of binary FSK signal, the phase information contained in the received signal is not fully exploited, other than to provide for synchronization of the receiver to the transmitter. We now show that by proper use of the continuous-phase property when performing detection, it is possible to improve the noise performance of the receiver significantly. Here again, this improvement is achieved at the expense of increased system complexity. Consider a continuous-phase frequency-shift keying (CPFSK) signal, which is defined for the signaling interval 0 t Tb as follows:
Where Eb is the transmitted signal energy per bit and Tb is the bit duration.
Another useful way of representing the CPFSK signal s(t) is to express it as a conventional angle-modulated signal:
s(t) =  cos [ 2πfct + θ(t)]
Where (t) is the phase of s(t) at time t. When the phase (t) is a continuous function of time, we find that the modulated signal s(t) is itself also continuous at all times, including the inter-bit switching times. The phase (t) of a CPFSK signal increases or decreases linearly with time during each bit duration of Tb seconds, as shown by
θ(t) = θ(0) ± (πh/Tb)t, 0 ≤ t ≤ Tb
Here the plus sign corresponds to sending symbol 1 and the minus sign corresponds to sending symbol 0; the dimensionless parameter h is to be defined. We deduce the following pair of relations:
fc + h/2TB = f1
fc – h/2TB = f2
Solving this pair of equations for fc and h, we get
fc = ½ (f1 + f2)
h – Tb (f1 – f2)
Q6) What is inter symbol interference and what are its causes?
A6) This is a form of distortion of a signal, in which one or more symbols interfere with subsequent signals, causing noise or delivering a poor output.
Causes of ISI
The main causes of ISI are −
- Multi-path Propagation
- Non-linear frequency in channels
The ISI is unwanted and should be completely eliminated to get a clean output. The causes of ISI should also be resolved in order to lessen its effect.
To view ISI in a mathematical form present in the receiver output, we can consider the receiver output.
The receiving filter output y(t)y(t) is sampled at time ti=iTb (with i taking on integer values), yielding –
y(ti)= μ∑akp(iTb−kTb)
= μai+μ∑akp(iTb−kTb)
In the above equation, the first term μai is produced by the ith transmitted bit.
The second term represents the residual effect of all other transmitted bits on the decoding of the ith bit. This residual effect is called as Inter Symbol Interference.
In the absence of ISI, the output will be −
y(ti)=μai
This equation shows that the ith bit transmitted is correctly reproduced. However, the presence of ISI introduces bit errors and distortions in the output.
While designing the transmitter or a receiver, it is important that you minimize the effects of ISI, so as to receive the output with the least possible error rate.
Q7) What is eye diagram explain with waveform representation?
A7) An eye diagram or eye pattern is simply a graphical display of a serial data signal with respect to time that shows a pattern that resembles an eye.
The signal at the receiving end of the serial link is connected to an oscilloscope and the sweep rate is set so that one- or two-bit time periods (unit intervals or UI) are displayed. This causes bit periods to overlap and the eye pattern to form around the upper and lower signal levels and the rise and fall times. The eye pattern readily shows the rise and fall time lengthening and rounding as well as the horizontal jitter variation.
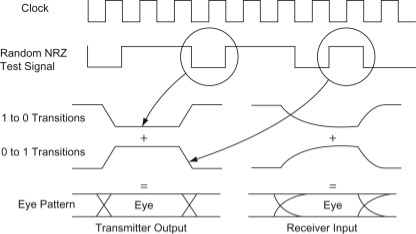
Fig. 3: Eye diagram
Q8) What is equalization?
A8) For reliable communication, we need to have a quality output. The transmission losses of the channel and other factors affecting the quality of the signal. The most occurring loss, as we have discussed, is the ISI.
To make the signal free from ISI, and to ensure a maximum signal to noise ratio, we need to implement a method called Equalization.

Fig. 4: Equalization
The noise and interferences which are denoted in the figure, are likely to occur, during transmission. The regenerative repeater has an equalizer circuit, which compensates the transmission losses by shaping the circuit. The Equalizer is feasible to get implemented.
Q9) Explain with the help of block diagram the OFDM system?
A9) The Orthogonal Frequency Division Multiplexing (OFDM) transmission scheme is the optimum version of the multicarrier transmission scheme. In the past, as well as in the present, the OFDM is referred in the literature Multi-carrier, Multi-tone and Fourier Transform.
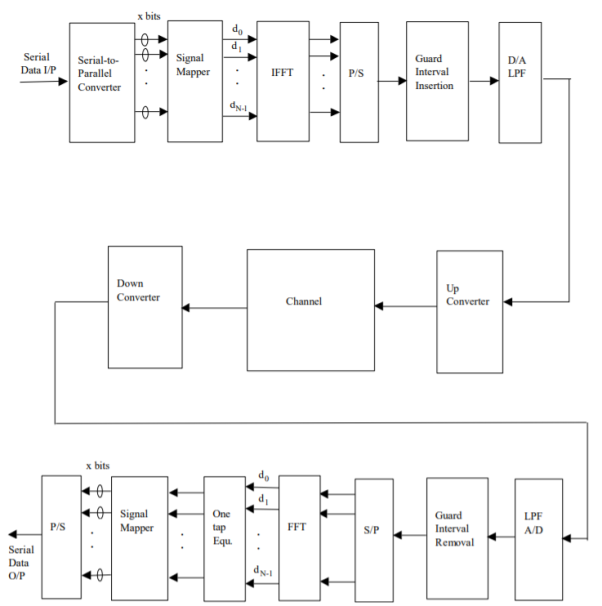
Fig 5. General OFDM System
The incoming signal is converted to parallel form by serial to parallel converter. After that it is grouped in x bits to form a complex number. These numbers are then modulated in a baseband manner by IFFT. Then through parallel to serial converted they are converted to serial data and transmitted. In order to avoid inter symbol interference a guard interval is inserted between the symbols. The discrete symbols are converted to analog and lowpass filtered for RF up-conversion. The receiver performs the inverse process of the transmitter. One tap equalizer is used to correct channel distortion. The tap coefficients of the filter are calculated based on channel information.
Q10) Write short note on OFDM?
A10)
- The Orthogonal Frequency Division Multiplexing (OFDM) transmission scheme is the optimum version of the multicarrier transmission scheme. In the past, as well as in the present, the OFDM is referred in the literature Multi-carrier, Multi-tone and Fourier Transform.
- In mid-1960 parallel data transmission and frequency multiplexing came. In high speed digital communication OFMD is employed. OFMD has a drawback of massive complex computation and high-speed memory which are no more problems now due to introduction of DSP and VLSI.
- The implementation of this technology is cost effective as FFT eliminates array of sinusoidal generators and coherent demodulation required in parallel data systems·The data to be transmitted is spread overlarge number of carriers. Each of them is then modulated at low rates. By choosing proper frequency between them the carriers are made orthogonal to each other.
- In OFDM the spectral overlapping among the sun carrier is allowed, at the receiver due to orthogonality the subcarriers can be separated. This provides better spectral efficiency and use to steep BPF is eliminated.
- The problems arising in single carrier scheme are eliminated in OFDM transmission system. It has the advantage of spreading out a frequency selective fade over many symbols. This effectively randomizes burst errors caused by fading or impulse interference so that instead of several adjacent symbols being completely destroyed, many symbols are only slightly distorted.
- Because of this reconstruction of majority of them even without forward error correction is possible. As the entire bandwidth is divided into many narrow bandwidths, the suband become smaller then the coherent bandwidth of the channel which makes the frequency response over individual subbands is relatively flat.Hence, equalization becomes much easier than in single carrier system and it can be avoided altogether if differential encoding is employed.
- The orthoganality of subchannles in OFDM can be maintained and individual subchannels can be completely separated by the FFT at the receiver when there are no intersymbol interference (ISI) and intercarrier interference (ICI) introduced by the transmission channel distortion.
- Since the spectra of an OFDM signal is not strictly band limited, linear distortions such as multipath propagation causes each subchannel to spread energy into the adjacent channels and consequently cause ISI.
- One way to prevent ISI is to create a cyclically extended guard interval, where each OFDM symbol is preceded by a periodic extension of the signal itself. When the guard interval is longer than the channel impulse response or multipath delay, the ISI can be eliminated.
- By using time and frequency diversity, OFDM provides a means to transmit data in a frequency selective channel. However, it does not suppress fading itself. Depending on their position in the frequency domain, individual subchannels could be affected by fading.
Q11) Compare the digital modulation systems?
A11)
Q12) What is pulse shaping explain with waveform?
A12) Pulse shaping is the process of changing the waveform of transmitted pulses. Its purpose is to make the transmitted signal better suited to its purpose or the communication channel, typically by limiting the effective bandwidth of the transmission.
In communications systems, two important requirements of a wireless communications channel demand the use of a pulse shaping filter. These requirements are:
1) generating bandlimited channels, and
2) reducing inter symbol interference (ISI) from multi-path signal reflections. Both requirements can be accomplished by a pulse shaping filter which is applied to each symbol.
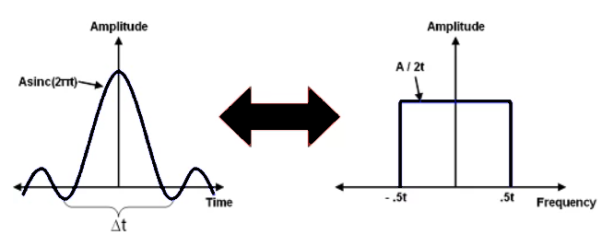
Fig 6. Time v/s Frequency Domain of Sinc Pulse
In fact, the sinc pulse, shown below, meets both of these requirements because it efficiently utilizes the frequency domain to utilize a smaller portion of the frequency domain, and because of the windowing affect that it has on each symbol period of a modulated signal. A sinc pulse is shown below along with an FFT spectrum of the given signal.
Q13) Derive expression for bandwidth of M-ary FSK?
A13) When the orthogonal signals of an M-ary FSK signal are detected coherently, the adjacent signals need only be separated from each other by a frequency difference 12T so as to maintain orthogonality. Hence, we may define the channel bandwidth required to transmit M-ary FSK signals as
B=M/2T
For multilevels with frequency assignments that make the frequency spacing uniform and equal to 1/2T, the bandwidth B contains a large fraction of the signal power.
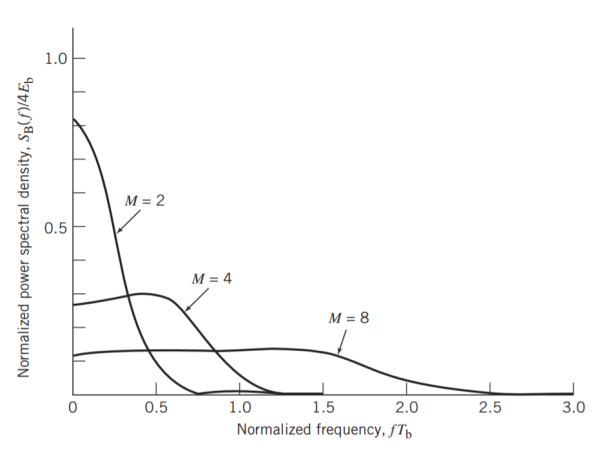
Fig 7. Power spectra of M-ary PSK signals for M = 2, 4, 8.
Hence, using Rb=1/Tb, we may redefine the channel bandwidth B for M-ary FSK signals as
B = RbM/2log2M
The bandwidth efficiency of M-ary signals is therefore
= Rb/B
= 2 log2M/M
Q14) Write short notes on M-ark FSK?
A14) Consider next the M-ary version of FSK, for which the transmitted signals are defined by
si(t) = 2E/T cos[ π/T (nc+i)t] 0≤t≤T
Where i = 1, 2, , M, and the carrier frequency fc = nc/(2T) for some fixed integer nc. The transmitted symbols are of equal duration T and have equal energy E. Since the individual signal frequencies are separated by 1/(2T) Hz, the M-ary FSK signals constitute an orthogonal set; that is,
 si(t)sj(t)dt = 0, i≠j
Hence, we may use the transmitted signals si (t) themselves, except for energy normalization, as a complete orthonormal set of basis functions, as shown by
i(t) = 1/E si(t), for 0 ≤ t ≤ T and i= 1, 2, ......, M
Accordingly, the M-ary FSK is described by an M-dimensional signal-space diagram. For the coherent detection of M-ary FSK signals, the optimum receiver consists of a bank of M correlators or matched filters, with i (t) providing the basis functions. At the sampling times t = kT, the receiver makes decisions based on the largest matched filter output in accordance with the maximum likelihood decoding rule. An exact formula for the probability of symbol error is, however, difficult to derive for a coherent M-ary FSK system. Nevertheless, we may use the union bound to place an upper bound on the average probability of symbol error for M-ary FSK. Specifically, since the minimum distance dmin in M-ary FSK is √2E, we have
Pe ≤ (M-)Q(E/N0)
For fixed M, this bound becomes increasingly tight as the ratio EN0 is increased. Indeed, it becomes a good approximation to Pe for values of Pe 10–3.
Power Spectra of M-ary FSK Signals
The spectral analysis of M-ary FSK signals is much more complicated than that of M-ary PSK signals. A case of particular interest occurs when the frequencies assigned to the multilevels make the frequency spacing uniform and the frequency deviation h = 12. That is, the M signal frequencies are separated by 1/2T, where T is the symbol duration. For h = 12, the baseband power spectral density of M-ary FSK signals is plotted in Figure below for M = 2, 4, 8.
Q15) Explain QAM modulator and demodulation?
A15) Basic QAM I-Q modulator circuit
The two resultant signals are summed and then processed as required in the RF signal chain, typically converting them in frequency to the required final frequency and amplifying them as required.
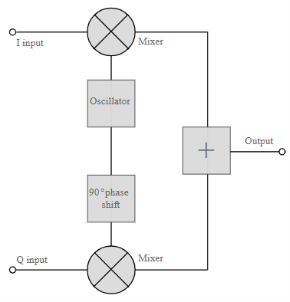
Fig. 8: Basic QAM
It is worth noting that as the amplitude of the signal varies any RF amplifiers must be linear to preserve the integrity of the signal. Any non-linearities will alter the relative levels of the signals and alter the phase difference, thereby distorting he signal and introducing the possibility of data errors.
Basic QAM I-Q demodulator circuit
The basic modulator assumes that the two quadrature signals remain exactly in quadrature.
A further requirement is to derive a local oscillator signal for the demodulation that is exactly on the required frequency for the signal. Any frequency offset will be a change in the phase of the local oscillator signal with respect to the two double sideband suppressed carrier constituents of the overall signal.
Systems include circuitry for carrier recovery that often utilises a phase locked loop - some even have an inner and outer loop. Recovering the phase of the carrier is important otherwise the bit error rate for the data will be compromised.
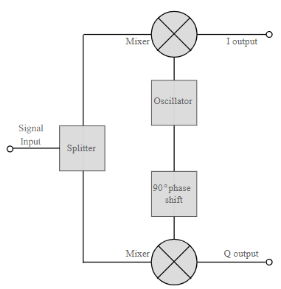
Fig. 9: Basic QAM demodulator
The circuits shown above show the generic IQ QAM modulator and demodulator circuits that are used in a vast number of different areas. Not only are these circuits made from discrete components, but more commonly they are used within integrated circuits that are able to provide a large number of functions.
Q16) Derive expression for error probability and explain the signal space representation of QAM?
A16) Error Probability
BER for QAM constellation
The SER for a rectangular M-QAM (16-QAM, 64-QAM, 256-QAM etc) with size L = M2 can be calculated by considering two M-PAM on in-phase and quadrature components. The error probability of QAM symbol is obtained by the error probability of each branch (M-PAM) and is given by

Signal Space Representation
For the case when M = 2k , k even, the resulting signal space diagram has a “square constellation.” In this case the QAM signal can be thought of as 2 PAM signals in quadrature. For M = 2k, k odd, the constellation takes on a “cross” form. For example, 16-QAM constellation is
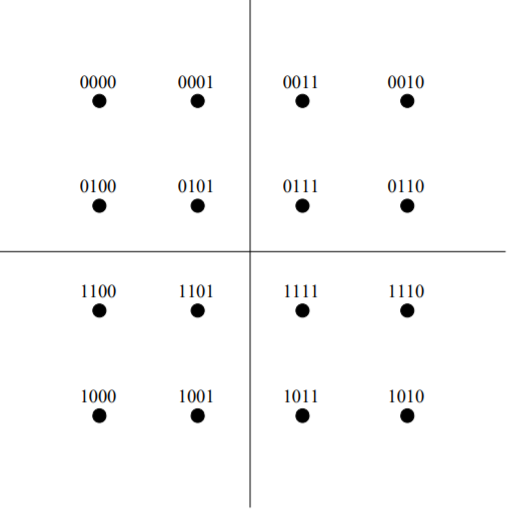
Fig 10:16-QAM constellation
Unit - 3
Digital Modulation Techniques
Q1) Compare MSK and QPSK techniques of modulation?
A1)
MSK | QPSK |
The MSK baseband waveforms are smoother than that of QPSK. | The QPSK baseband waveforms are not smoother comparatively. |
MSK signal has continuous phase in all the cases | The QPSK has abrupt phase shift of π/2 or π. |
MSK waveform doesnot support any amplitude variations | QPSK signals have abrupt amplitude variations |
The main lobe of MSK is wider than that of QPSK | The main lobe of MSK is wider than that of QPSK |
Side sections of MSK are smaller compared to that of QPSK | Side sections of QPSK are bigger compared to that MSK |
Bpf is not required in MSK | To avoid inter channel interference, QPSK needs band pass filtering |
Not exist in MSK | Band pass filtering changes the amplitude wavelength of QPSK |
The bandwidth requirement of MSK is 1.5fb
| The bandwidth is fb in case of QPSK
|
The generation & detection of MSK is slightly more complicated. Because of incorrect synchronization phase jitter can be present in MSK causing degradation of the performance of MSK.
| Comparatively simple in case of QPSK
|
Q2) Draw and explain the signal space diagram of MSK?
A2) We see that there are two orthonormal basis functions 1(t) and 2(t) characterizing the generation of MSK; they are defined by the following pair of sinusoidally modulated quadrature carriers:
1(t) = 2/Tb cos (πt/2Tb) cos (2πfct) 0≤ t ≤ Tb
2(t) = 2/Tb sin (πt/2Tb) sin (2πfct) 0≤ t ≤ Tb
s(t) = s11(t) + s11(t) 0≤ t ≤ Tb
Where the coefficients s1 and s2 are related to the phase states (0) and (Tb), respectively. To evaluate s1, we integrate the product s(t)1(t) with respect to time t between the limits –Tb and Tb, obtaining
s1 = 
= Eb cos [θ(0)] -Tb ≤ t ≤ Tb
Similarly, to evaluate s2 we integrate the product s(t)2(t) with respect to time t between the limits 0 and 2Tb, obtaining
s2 = 
From above two equations we conclude that
1. Both integrals are evaluated for a time interval equal to twice the bit duration.
2. The lower and upper limits of the integral used to evaluate s1 are shifted by the bit duration Tb with respect to those used to evaluate s2.
3. The time interval 0 t Tb, for which the phase states (0) and (Tb) are defined, is common to both integrals.
It follows, therefore, that the signal constellation for an MSK signal is two-dimensional (i.e., N = 2), with four possible message points (i.e., M = 4), as illustrated in the signal space diagram of Figure below.
( + Eb , + Eb), ( - Eb , + Eb), ( - Eb , - Eb) and ( + Eb , - Eb)
The possible values of (0) and (Tb), corresponding to these four message points, are also included in Figure below. The signal-space diagram of MSK is thus similar to that of QPSK in that both of them have four message points in a two-dimensional space. However, they differ in a subtle way that should be carefully noted:
- QPSK, moving from one message point to an adjacent one, is produced by sending a two-bit symbol (i.e., dibit).
- MSK, on the other hand, moving from one message point to an adjacent one, is produced by sending a binary symbol, 0 or 1. However, each symbol shows up in two opposite quadrants, depending on the value of the phase-pair: (0) and (Tb).
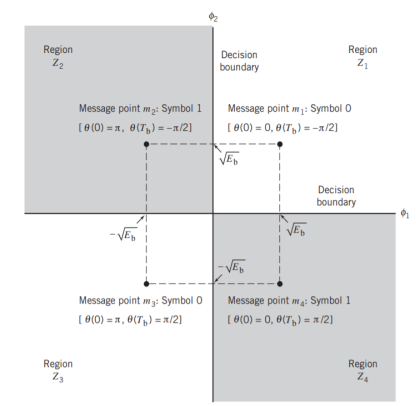
Fig 1. Signal-space diagram for MSK system
Q3) Derive the expression of probability of error of MSK?
A3) Error Probability of MSK
In the case of an AWGN channel, the received signal is given by
x(t) = s(t) + w(t)
Where s(t) is the transmitted MSK signal and w(t) is the sample function of a white Gaussian noise process of zero mean and power spectral density N0/2. To decide whether symbol 1 or symbol 0 was sent in the interval 0 t Tb, say, we have to establish a procedure for the use of x(t) to detect the phase states (0) and (Tb). For the optimum detection of (0), we project the received signal x(t) onto the reference signal over the interval –Tb t Tb, obtaining
x1 = 
w1 is the sample value of a Gaussian random variable of zero mean and variance N0/2. From the signal-space diagram, we see that if x1 > 0, the receiver chooses the estimate. On the other hand, if x1 0, it chooses the estimate. Similarly, for the optimum detection of (Tb), we project the received signal x(t) onto the second reference signal 2(t) over the interval 0 t 2Tb, obtaining
x2 =  0 ≤ t ≤ 2Tb
w2 is the sample value of another independent Gaussian random variable of zero mean and variance N02. Referring again to the signal space diagram, we see that if x2 0, the receiver chooses the estimate Tb= – 2. If, however, x2 0, the receiver chooses the estimate ˆ Tb = 2
It follows, therefore, that the BER for the coherent detection of MSK signals is given by
Pc = Q (2Eb/N0)
Q4) With the help of block diagram explain the generation and detection of MSK Signals?
A4) Generation and Coherent Detection of MSK Signals
With h = 1/2, we may use the block diagram of Figure(a) below to generate the MSK signal. The advantage of this method of generating MSK signals is that the signal coherence and deviation ratio are largely unaffected by variations in the input data rate. Two input sinusoidal waves, one of frequency fc = nc4Tb for some fixed integer nc and the other of frequency 14Tb, are first applied to a product modulator. This modulator produces two phase-coherent sinusoidal waves at frequencies f1 and f2, which are related to the carrier frequency fc and the bit rate 1/Tb in accordance with above equations for deviation ratio h = 12. These two sinusoidal waves are separated from each other by two narrowband filters, one centered at f1 and the other at f2. The resulting filter outputs are next linearly combined to produce the pair of quadrature carriers or orthonormal basis functions 1(t) and 2(t). Finally, 1(t) and 2(t) is multiplied with two binary waves a1(t) and a2(t), both of which have a bit rate equal to 1/(2Tb)
(b)
Fig 2. Block diagrams for (a) MSK transmitter and (b) coherent MSK receiver
Figure (b) above shows the block diagram of the coherent MSK receiver. The received signal x(t) is correlated with 1(t) and 2(t). In both cases, the integration interval is 2Tb seconds, and the integration in the quadrature channel is delayed by Tb seconds with respect to that in the in-phase channel. The resulting in-phase and quadrature channel correlator outputs, x1 and x2, are each compared with a threshold of zero
Q5) What is continuous phase frequency shift keying?
A5) In the coherent detection of binary FSK signal, the phase information contained in the received signal is not fully exploited, other than to provide for synchronization of the receiver to the transmitter. We now show that by proper use of the continuous-phase property when performing detection, it is possible to improve the noise performance of the receiver significantly. Here again, this improvement is achieved at the expense of increased system complexity. Consider a continuous-phase frequency-shift keying (CPFSK) signal, which is defined for the signaling interval 0 t Tb as follows:
Where Eb is the transmitted signal energy per bit and Tb is the bit duration.
Another useful way of representing the CPFSK signal s(t) is to express it as a conventional angle-modulated signal:
s(t) =  cos [ 2πfct + θ(t)]
Where (t) is the phase of s(t) at time t. When the phase (t) is a continuous function of time, we find that the modulated signal s(t) is itself also continuous at all times, including the inter-bit switching times. The phase (t) of a CPFSK signal increases or decreases linearly with time during each bit duration of Tb seconds, as shown by
θ(t) = θ(0) ± (πh/Tb)t, 0 ≤ t ≤ Tb
Here the plus sign corresponds to sending symbol 1 and the minus sign corresponds to sending symbol 0; the dimensionless parameter h is to be defined. We deduce the following pair of relations:
fc + h/2TB = f1
fc – h/2TB = f2
Solving this pair of equations for fc and h, we get
fc = ½ (f1 + f2)
h – Tb (f1 – f2)
Q6) What is inter symbol interference and what are its causes?
A6) This is a form of distortion of a signal, in which one or more symbols interfere with subsequent signals, causing noise or delivering a poor output.
Causes of ISI
The main causes of ISI are −
- Multi-path Propagation
- Non-linear frequency in channels
The ISI is unwanted and should be completely eliminated to get a clean output. The causes of ISI should also be resolved in order to lessen its effect.
To view ISI in a mathematical form present in the receiver output, we can consider the receiver output.
The receiving filter output y(t)y(t) is sampled at time ti=iTb (with i taking on integer values), yielding –
y(ti)= μ∑akp(iTb−kTb)
= μai+μ∑akp(iTb−kTb)
In the above equation, the first term μai is produced by the ith transmitted bit.
The second term represents the residual effect of all other transmitted bits on the decoding of the ith bit. This residual effect is called as Inter Symbol Interference.
In the absence of ISI, the output will be −
y(ti)=μai
This equation shows that the ith bit transmitted is correctly reproduced. However, the presence of ISI introduces bit errors and distortions in the output.
While designing the transmitter or a receiver, it is important that you minimize the effects of ISI, so as to receive the output with the least possible error rate.
Q7) What is eye diagram explain with waveform representation?
A7) An eye diagram or eye pattern is simply a graphical display of a serial data signal with respect to time that shows a pattern that resembles an eye.
The signal at the receiving end of the serial link is connected to an oscilloscope and the sweep rate is set so that one- or two-bit time periods (unit intervals or UI) are displayed. This causes bit periods to overlap and the eye pattern to form around the upper and lower signal levels and the rise and fall times. The eye pattern readily shows the rise and fall time lengthening and rounding as well as the horizontal jitter variation.
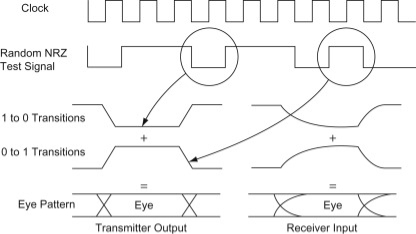
Fig. 3: Eye diagram
Q8) What is equalization?
A8) For reliable communication, we need to have a quality output. The transmission losses of the channel and other factors affecting the quality of the signal. The most occurring loss, as we have discussed, is the ISI.
To make the signal free from ISI, and to ensure a maximum signal to noise ratio, we need to implement a method called Equalization.

Fig. 4: Equalization
The noise and interferences which are denoted in the figure, are likely to occur, during transmission. The regenerative repeater has an equalizer circuit, which compensates the transmission losses by shaping the circuit. The Equalizer is feasible to get implemented.
Q9) Explain with the help of block diagram the OFDM system?
A9) The Orthogonal Frequency Division Multiplexing (OFDM) transmission scheme is the optimum version of the multicarrier transmission scheme. In the past, as well as in the present, the OFDM is referred in the literature Multi-carrier, Multi-tone and Fourier Transform.
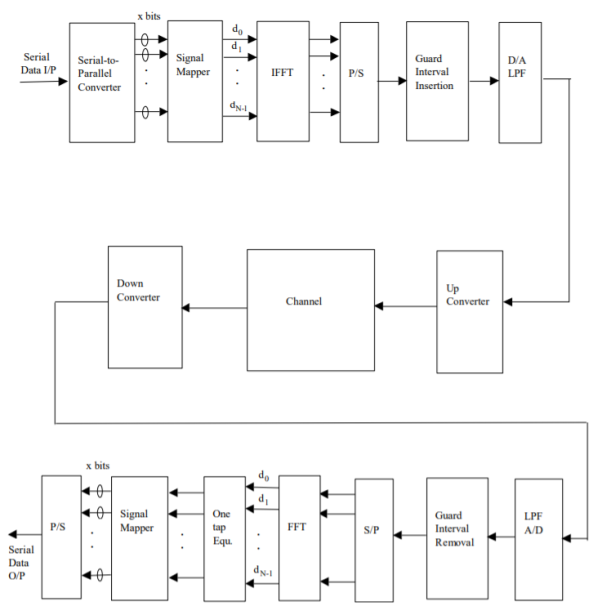
Fig 5. General OFDM System
The incoming signal is converted to parallel form by serial to parallel converter. After that it is grouped in x bits to form a complex number. These numbers are then modulated in a baseband manner by IFFT. Then through parallel to serial converted they are converted to serial data and transmitted. In order to avoid inter symbol interference a guard interval is inserted between the symbols. The discrete symbols are converted to analog and lowpass filtered for RF up-conversion. The receiver performs the inverse process of the transmitter. One tap equalizer is used to correct channel distortion. The tap coefficients of the filter are calculated based on channel information.
Q10) Write short note on OFDM?
A10)
- The Orthogonal Frequency Division Multiplexing (OFDM) transmission scheme is the optimum version of the multicarrier transmission scheme. In the past, as well as in the present, the OFDM is referred in the literature Multi-carrier, Multi-tone and Fourier Transform.
- In mid-1960 parallel data transmission and frequency multiplexing came. In high speed digital communication OFMD is employed. OFMD has a drawback of massive complex computation and high-speed memory which are no more problems now due to introduction of DSP and VLSI.
- The implementation of this technology is cost effective as FFT eliminates array of sinusoidal generators and coherent demodulation required in parallel data systems·The data to be transmitted is spread overlarge number of carriers. Each of them is then modulated at low rates. By choosing proper frequency between them the carriers are made orthogonal to each other.
- In OFDM the spectral overlapping among the sun carrier is allowed, at the receiver due to orthogonality the subcarriers can be separated. This provides better spectral efficiency and use to steep BPF is eliminated.
- The problems arising in single carrier scheme are eliminated in OFDM transmission system. It has the advantage of spreading out a frequency selective fade over many symbols. This effectively randomizes burst errors caused by fading or impulse interference so that instead of several adjacent symbols being completely destroyed, many symbols are only slightly distorted.
- Because of this reconstruction of majority of them even without forward error correction is possible. As the entire bandwidth is divided into many narrow bandwidths, the suband become smaller then the coherent bandwidth of the channel which makes the frequency response over individual subbands is relatively flat.Hence, equalization becomes much easier than in single carrier system and it can be avoided altogether if differential encoding is employed.
- The orthoganality of subchannles in OFDM can be maintained and individual subchannels can be completely separated by the FFT at the receiver when there are no intersymbol interference (ISI) and intercarrier interference (ICI) introduced by the transmission channel distortion.
- Since the spectra of an OFDM signal is not strictly band limited, linear distortions such as multipath propagation causes each subchannel to spread energy into the adjacent channels and consequently cause ISI.
- One way to prevent ISI is to create a cyclically extended guard interval, where each OFDM symbol is preceded by a periodic extension of the signal itself. When the guard interval is longer than the channel impulse response or multipath delay, the ISI can be eliminated.
- By using time and frequency diversity, OFDM provides a means to transmit data in a frequency selective channel. However, it does not suppress fading itself. Depending on their position in the frequency domain, individual subchannels could be affected by fading.
Q11) Compare the digital modulation systems?
A11)
Q12) What is pulse shaping explain with waveform?
A12) Pulse shaping is the process of changing the waveform of transmitted pulses. Its purpose is to make the transmitted signal better suited to its purpose or the communication channel, typically by limiting the effective bandwidth of the transmission.
In communications systems, two important requirements of a wireless communications channel demand the use of a pulse shaping filter. These requirements are:
1) generating bandlimited channels, and
2) reducing inter symbol interference (ISI) from multi-path signal reflections. Both requirements can be accomplished by a pulse shaping filter which is applied to each symbol.
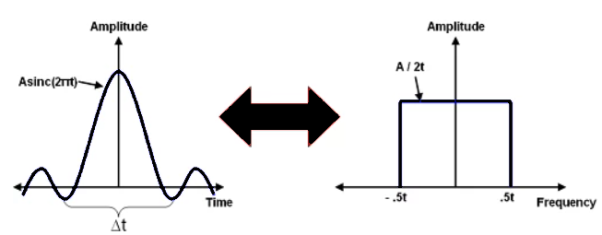
Fig 6. Time v/s Frequency Domain of Sinc Pulse
In fact, the sinc pulse, shown below, meets both of these requirements because it efficiently utilizes the frequency domain to utilize a smaller portion of the frequency domain, and because of the windowing affect that it has on each symbol period of a modulated signal. A sinc pulse is shown below along with an FFT spectrum of the given signal.
Q13) Derive expression for bandwidth of M-ary FSK?
A13) When the orthogonal signals of an M-ary FSK signal are detected coherently, the adjacent signals need only be separated from each other by a frequency difference 12T so as to maintain orthogonality. Hence, we may define the channel bandwidth required to transmit M-ary FSK signals as
B=M/2T
For multilevels with frequency assignments that make the frequency spacing uniform and equal to 1/2T, the bandwidth B contains a large fraction of the signal power.
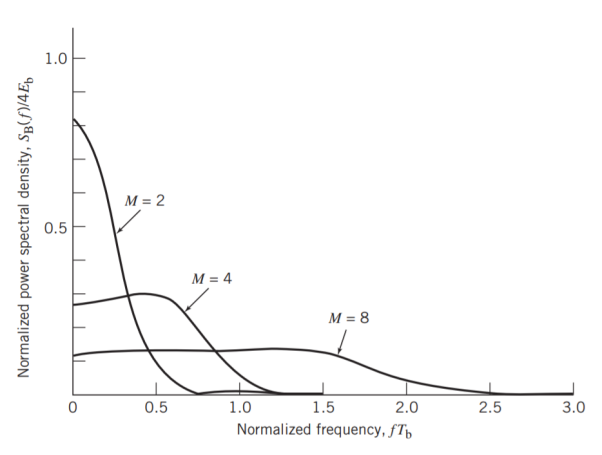
Fig 7. Power spectra of M-ary PSK signals for M = 2, 4, 8.
Hence, using Rb=1/Tb, we may redefine the channel bandwidth B for M-ary FSK signals as
B = RbM/2log2M
The bandwidth efficiency of M-ary signals is therefore
= Rb/B
= 2 log2M/M
Q14) Write short notes on M-ark FSK?
A14) Consider next the M-ary version of FSK, for which the transmitted signals are defined by
si(t) = 2E/T cos[ π/T (nc+i)t] 0≤t≤T
Where i = 1, 2, , M, and the carrier frequency fc = nc/(2T) for some fixed integer nc. The transmitted symbols are of equal duration T and have equal energy E. Since the individual signal frequencies are separated by 1/(2T) Hz, the M-ary FSK signals constitute an orthogonal set; that is,
 si(t)sj(t)dt = 0, i≠j
Hence, we may use the transmitted signals si (t) themselves, except for energy normalization, as a complete orthonormal set of basis functions, as shown by
i(t) = 1/E si(t), for 0 ≤ t ≤ T and i= 1, 2, ......, M
Accordingly, the M-ary FSK is described by an M-dimensional signal-space diagram. For the coherent detection of M-ary FSK signals, the optimum receiver consists of a bank of M correlators or matched filters, with i (t) providing the basis functions. At the sampling times t = kT, the receiver makes decisions based on the largest matched filter output in accordance with the maximum likelihood decoding rule. An exact formula for the probability of symbol error is, however, difficult to derive for a coherent M-ary FSK system. Nevertheless, we may use the union bound to place an upper bound on the average probability of symbol error for M-ary FSK. Specifically, since the minimum distance dmin in M-ary FSK is √2E, we have
Pe ≤ (M-)Q(E/N0)
For fixed M, this bound becomes increasingly tight as the ratio EN0 is increased. Indeed, it becomes a good approximation to Pe for values of Pe 10–3.
Power Spectra of M-ary FSK Signals
The spectral analysis of M-ary FSK signals is much more complicated than that of M-ary PSK signals. A case of particular interest occurs when the frequencies assigned to the multilevels make the frequency spacing uniform and the frequency deviation h = 12. That is, the M signal frequencies are separated by 1/2T, where T is the symbol duration. For h = 12, the baseband power spectral density of M-ary FSK signals is plotted in Figure below for M = 2, 4, 8.
Q15) Explain QAM modulator and demodulation?
A15) Basic QAM I-Q modulator circuit
The two resultant signals are summed and then processed as required in the RF signal chain, typically converting them in frequency to the required final frequency and amplifying them as required.
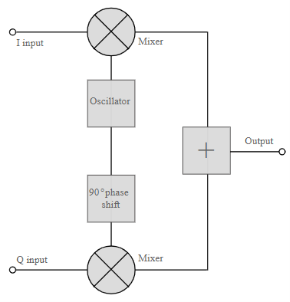
Fig. 8: Basic QAM
It is worth noting that as the amplitude of the signal varies any RF amplifiers must be linear to preserve the integrity of the signal. Any non-linearities will alter the relative levels of the signals and alter the phase difference, thereby distorting he signal and introducing the possibility of data errors.
Basic QAM I-Q demodulator circuit
The basic modulator assumes that the two quadrature signals remain exactly in quadrature.
A further requirement is to derive a local oscillator signal for the demodulation that is exactly on the required frequency for the signal. Any frequency offset will be a change in the phase of the local oscillator signal with respect to the two double sideband suppressed carrier constituents of the overall signal.
Systems include circuitry for carrier recovery that often utilises a phase locked loop - some even have an inner and outer loop. Recovering the phase of the carrier is important otherwise the bit error rate for the data will be compromised.
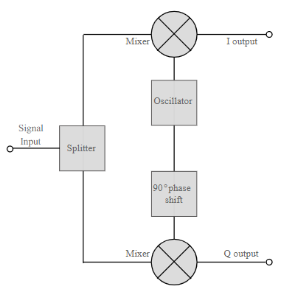
Fig. 9: Basic QAM demodulator
The circuits shown above show the generic IQ QAM modulator and demodulator circuits that are used in a vast number of different areas. Not only are these circuits made from discrete components, but more commonly they are used within integrated circuits that are able to provide a large number of functions.
Q16) Derive expression for error probability and explain the signal space representation of QAM?
A16) Error Probability
BER for QAM constellation
The SER for a rectangular M-QAM (16-QAM, 64-QAM, 256-QAM etc) with size L = M2 can be calculated by considering two M-PAM on in-phase and quadrature components. The error probability of QAM symbol is obtained by the error probability of each branch (M-PAM) and is given by

Signal Space Representation
For the case when M = 2k , k even, the resulting signal space diagram has a “square constellation.” In this case the QAM signal can be thought of as 2 PAM signals in quadrature. For M = 2k, k odd, the constellation takes on a “cross” form. For example, 16-QAM constellation is
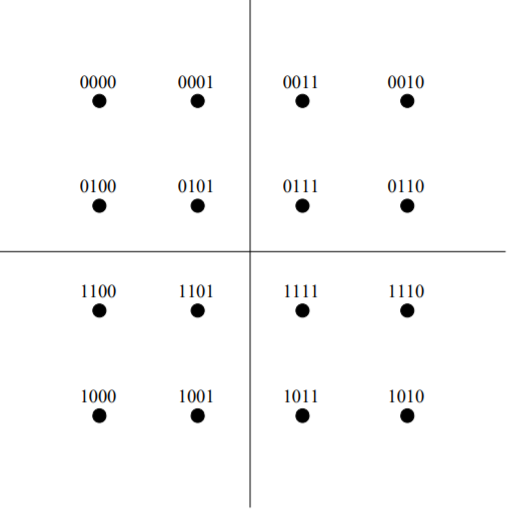
Fig 10:16-QAM constellation